
Recovery Factor Calculation for Smart Traders
Master the recovery factor calculation to measure a strategy's resilience. Learn the formula, see DeFi examples, and find top wallets with Wallet Finder.ai.

June 20, 2026


Wallet Finder
March 29, 2026
In the volatile world of crypto derivatives, understanding market dynamics is essential. Extreme leverage can amplify a minor price fluctuation into a market-moving cascade of forced position closures. These liquidations are more than data points; they are a real-time sentiment gauge, revealing zones of maximum financial pain and opportunity. By monitoring crypto liquidations today, astute traders can identify reversals, confirm trend strength, and avoid getting caught on the wrong side of a squeeze.
This roundup details the seven essential platforms that provide the data and visualizations needed to translate liquidation events into actionable intelligence. Each entry includes direct links and screenshots to help you quickly find the best tool for your strategy. We will explore how to use these platforms to pinpoint where large clusters of stop-losses are likely located and anticipate the market's next sharp move. This guide is your shortcut to turning massive liquidation data into a clear market advantage.
CoinGlass is a staple for traders seeking real-time data on crypto liquidations today. It provides an immediate, high-level overview of market-wide liquidations, breaking down the carnage by exchange, asset, and whether long or short positions were hit hardest. Its clean dashboard makes it easy to grasp the scale of a volatile move in seconds.
The platform's primary strength lies in its comprehensive coverage and speed. During major market swings, CoinGlass is often one of the first places traders check to see the total value of forced closures, offering a clear signal of market panic or euphoria. This makes it an essential tool for situational awareness, helping you understand if a price move is driven by genuine buying/selling or a cascade of leveraged positions being wiped out.
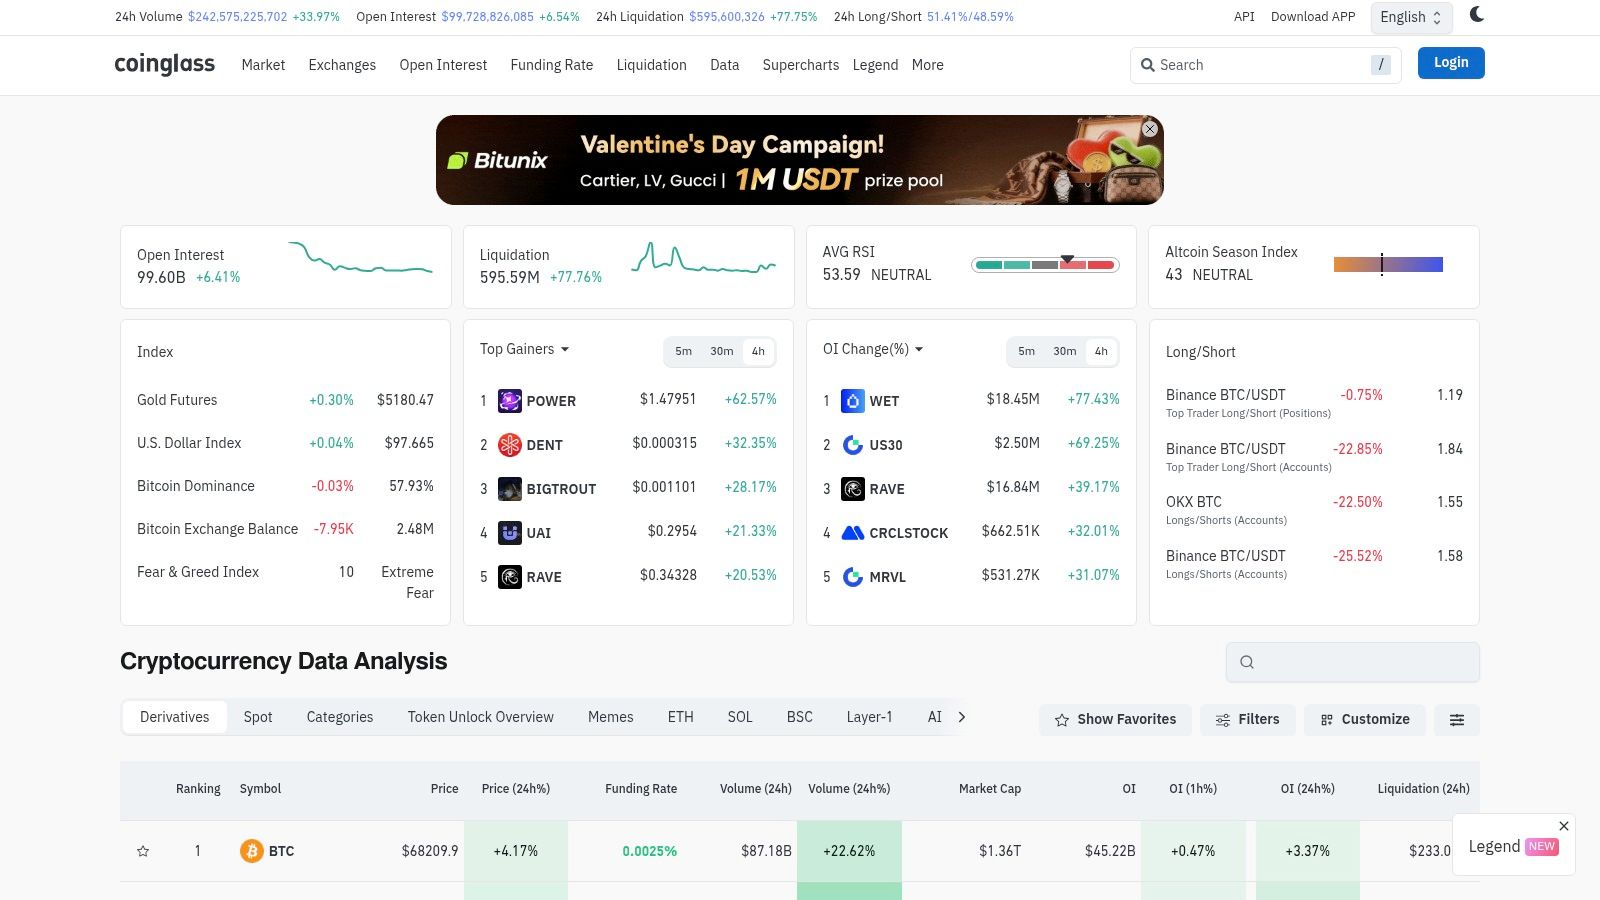
CoinGlass offers more than just liquidation totals; it provides a suite of complementary metrics that create a fuller picture of derivatives market sentiment.
Access and Pricing: The main dashboards on CoinGlass are free to use. For developers and quants, CoinGlass offers a paid API. The free version is sufficient for most retail traders.
Website: https://www.coinglass.com
Where other platforms show you what just happened, Hyblock Capital focuses on what could happen next. It is a professional analytics tool designed to anticipate, rather than just react to, crypto liquidations today. Its core offering is its predictive Liquidation Heatmaps, which visualize where clusters of potential liquidations are building up on the order book. This makes it a powerful asset for identifying high-liquidity zones that could act as price magnets.
The platform's main advantage is its forward-looking approach. Instead of merely reporting historical data, Hyblock provides visual models of where market-moving liquidation cascades are most likely to occur. This allows traders to pre-position themselves for squeezes or strategically place take-profit and stop-loss orders outside of these high-risk areas.
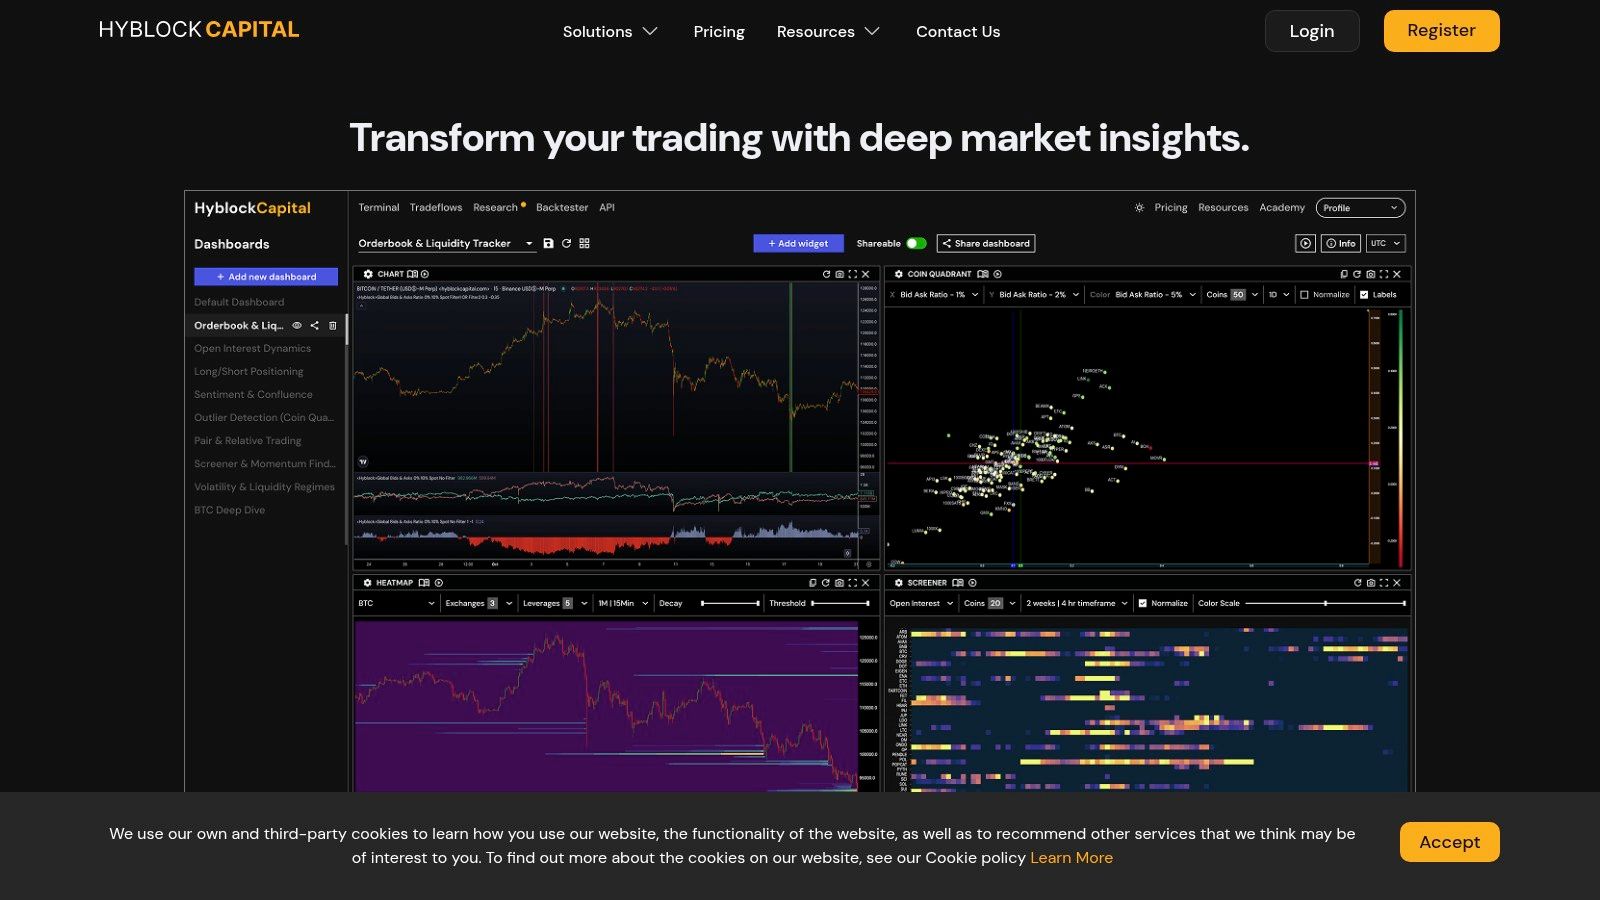
Hyblock Capital offers a suite of predictive tools that help traders see potential market structure ahead of time.
For those interested in building a complete market picture, combining Hyblock's off-chain derivatives data with other forms of analysis can be highly effective. You can explore a deeper guide on top metrics for tracking leveraged wallets to learn how to merge these different data sources.
Access and Pricing: Hyblock offers a free tier with limited access. More advanced features, such as granular lookback periods and specific exchange data, are available through paid subscription plans.
Website: https://hyblockcapital.com
The Kingfisher takes a different approach to tracking crypto liquidations today by visualizing where they are most likely to occur. Instead of just reporting past events, its real-time Liquidation Maps aggregate estimated liquidation liquidity across exchanges, highlighting price levels that could act as magnets for cascading events and squeezes. This makes it a popular tool for intraday and swing traders who want to time their entries and exits around these critical price zones.
Its core strength is its predictive visual model. While other platforms show you what just happened, The Kingfisher aims to show you what could happen next. By identifying clusters of potential liquidations, traders can anticipate areas of high volatility and place trades that benefit from forced position closures. This shifts the focus from reactive analysis to proactive trade planning.
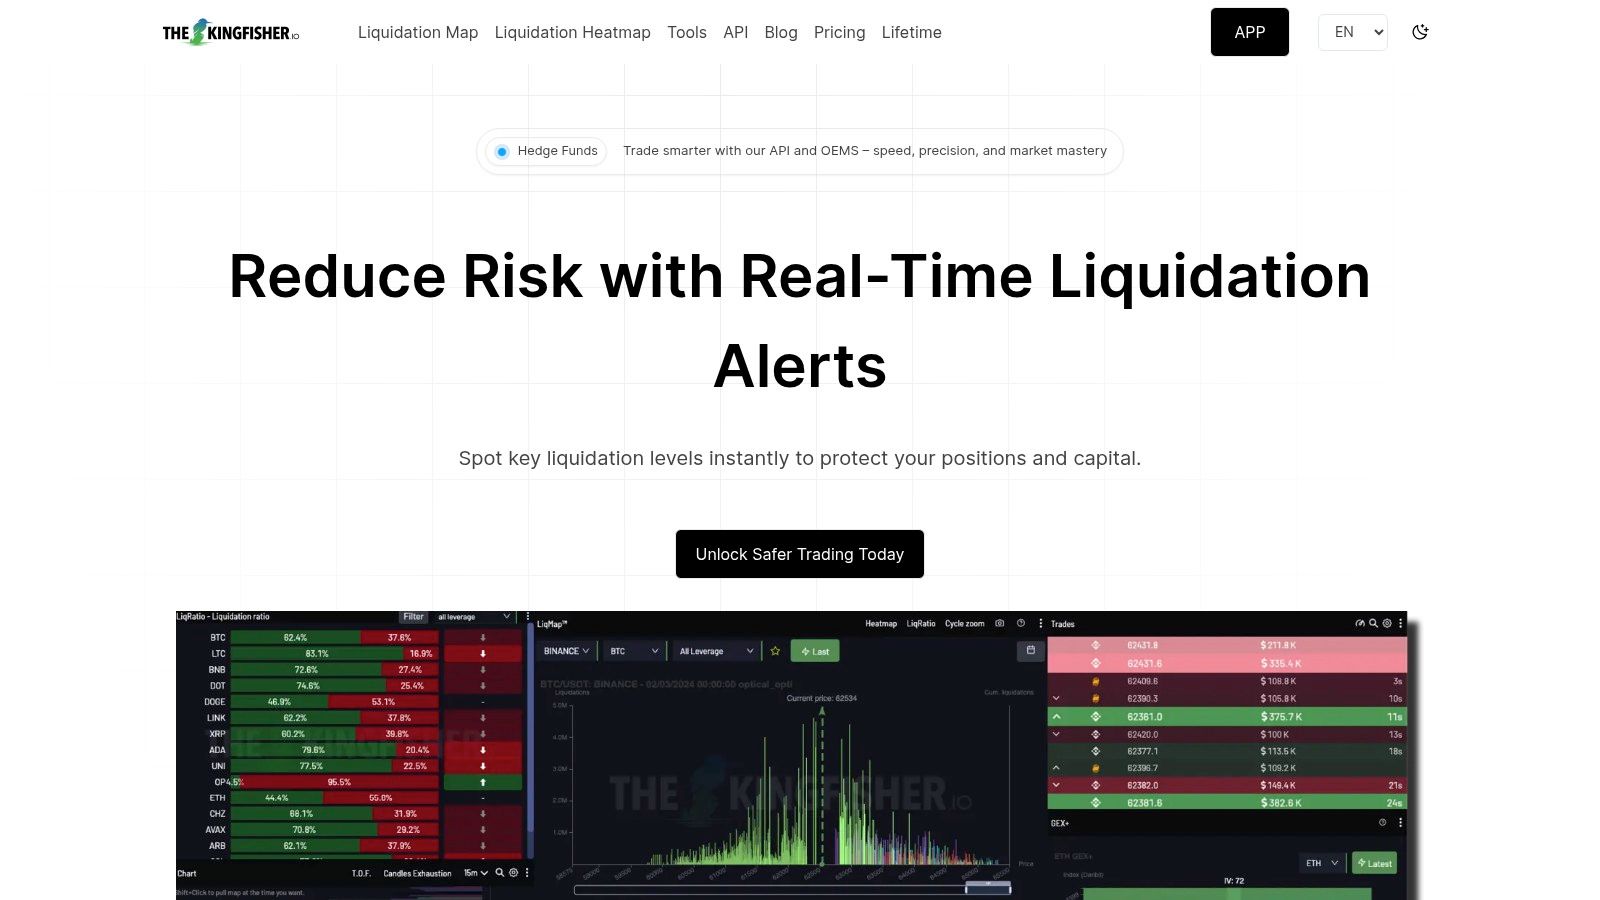
The Kingfisher is purpose-built for traders who use liquidation data as a primary signal for their strategies.
Access and Pricing: The Kingfisher offers a flexible access model. Users can buy session-based access, purchase credits for on-demand use, or subscribe to monthly/yearly plans for full access.
Website: https://thekingfisher.io
Coinalyze is a fast, clean web dashboard designed for traders who need a quick pulse on crypto liquidations today. Its primary appeal is its no-friction access to aggregated and per-exchange liquidation data, presented in easy-to-read charts. It excels at providing a rapid "what just happened?" view during volatile market moves, making it a go-to for situational awareness.
The platform's strength is its simplicity and speed for daily monitoring. While other platforms offer deeper analytics, Coinalyze focuses on delivering core liquidation, open interest, and funding rate metrics quickly and without a login. This makes it an ideal tool for a quick regime check to see if a price spike is backed by a short squeeze or if a dump is being intensified by a long cascade.
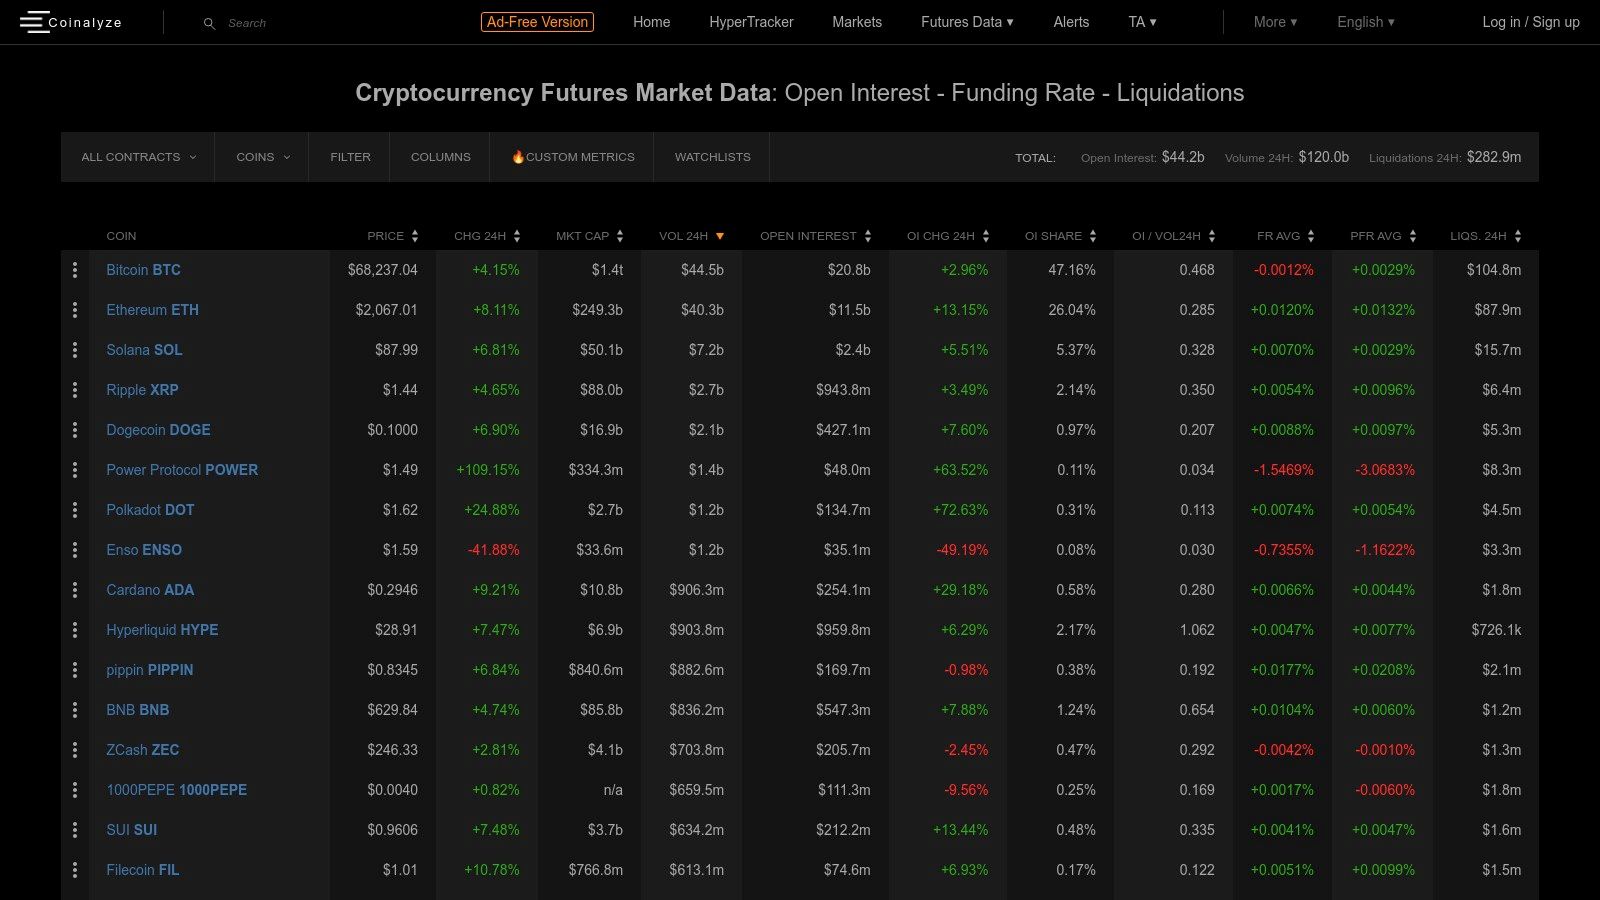
Coinalyze pairs liquidation data with other critical derivatives metrics, allowing for a more nuanced analysis of market dynamics.
Access and Pricing: The core liquidation pages and derivatives charts on Coinalyze are available for free without registration, making it highly accessible for retail traders.
Website: https://coinalyze.net
As one of the most recognized brands in crypto, CoinMarketCap provides a widely accessible and free dashboard for tracking crypto liquidations today. Its primary function is to offer a quick, high-level summary of market leverage, making it an excellent starting point for retail investors or for professionals needing a simple chart to share. The dashboard cleanly presents 1h, 4h, and 24h liquidation totals, split by long and short positions.
Its main advantage is its simplicity and universal accessibility. While specialized platforms offer deeper analytics, CoinMarketCap's page loads quickly and requires no setup, providing an instant snapshot of market stress. The inclusion of historical "largest events" adds valuable perspective, helping users gauge if current liquidations are truly significant or just typical market noise.
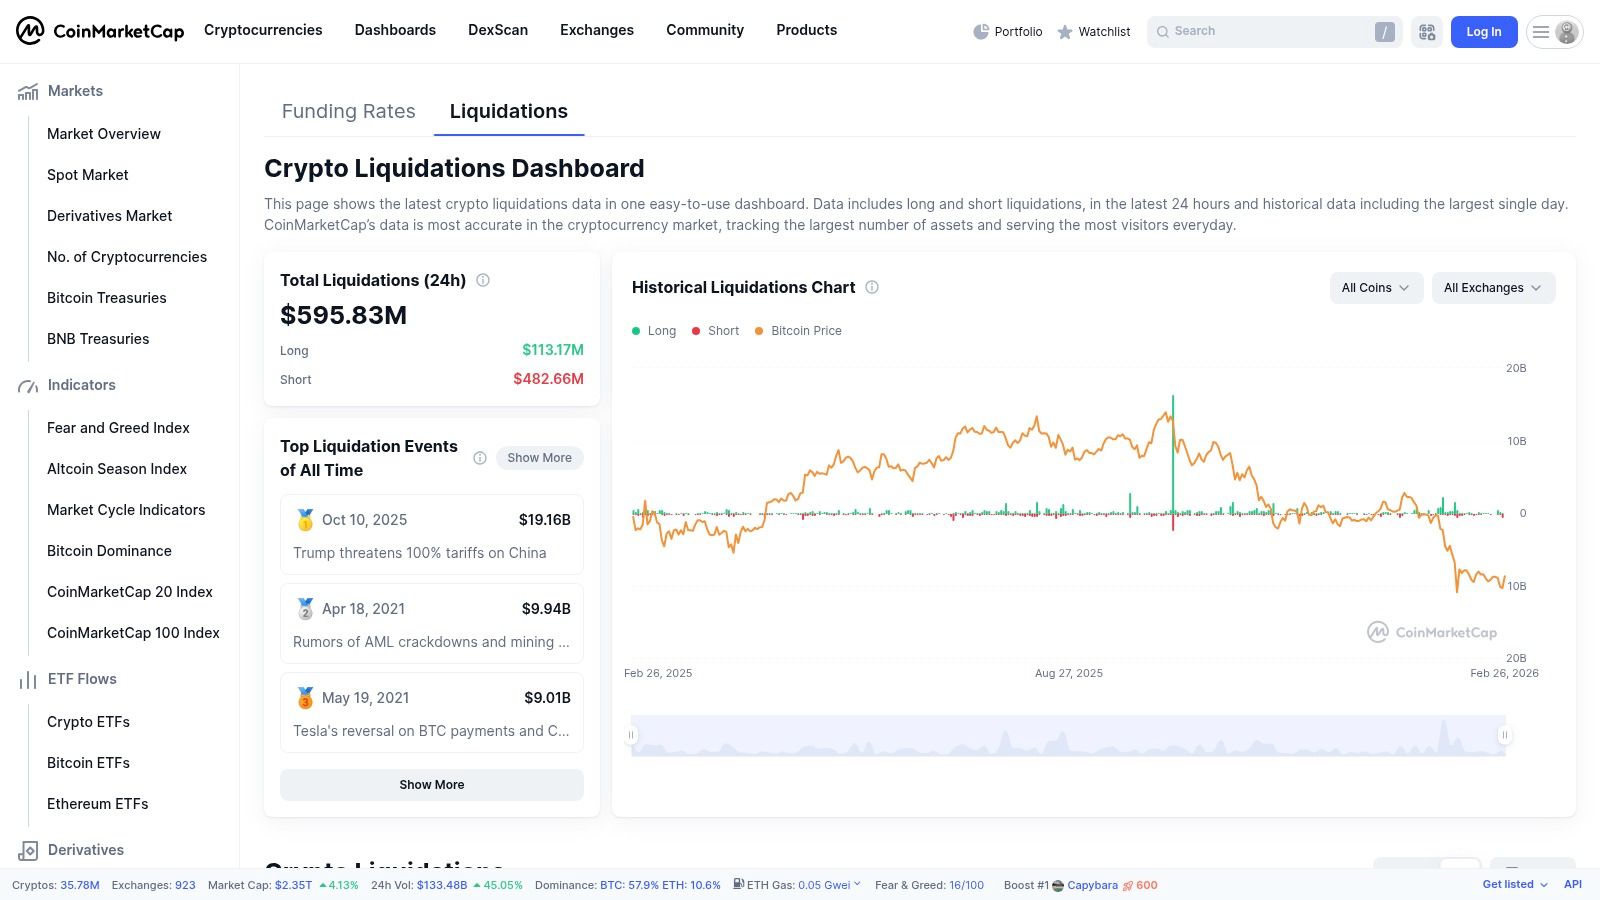
CoinMarketCap focuses on delivering the most critical liquidation data in a straightforward, easy-to-digest format.
Access and Pricing: The CoinMarketCap Liquidations dashboard is completely free to access and use. It requires no subscription or login.
Website: https://coinmarketcap.com/charts/liquidations/
Laevitas is an institutional-grade derivatives data platform built for quantitative traders and developers who require programmatic access to market data. While many platforms offer a visual dashboard to track crypto liquidations today, Laevitas focuses on delivering this data through low-latency APIs. This makes it a foundational tool for teams integrating real-time derivatives context into automated strategies or risk systems.
The platform’s core strength is its machine-readable, normalized data feeds. Instead of just presenting charts, Laevitas provides WebSocket and REST endpoints that unify data from multiple exchanges like Binance, Deribit, and Hyperliquid. This significantly reduces the integration overhead for developers and allows quants to build multi-venue strategies without wrestling with different data formats.
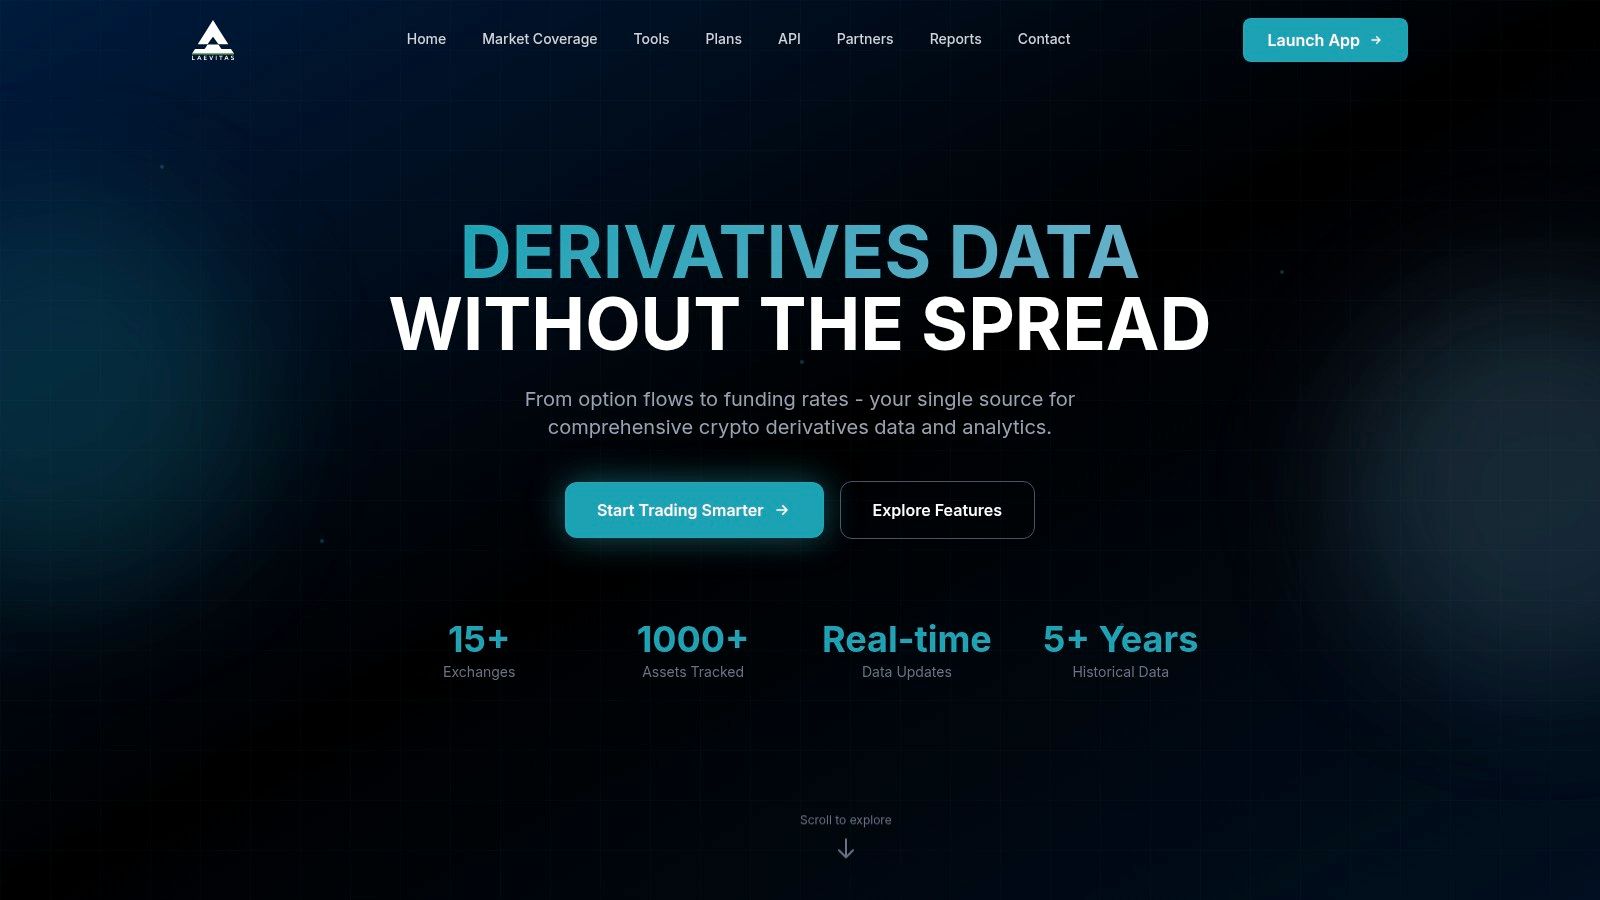
Laevitas is designed for programmatic consumption, offering robust endpoints for building sophisticated trading and analysis tools.
Access and Pricing: Laevitas is a premium, API-first service. Access requires contacting their sales team for custom enterprise plans. It is a professional toolset for teams that need robust, machine-readable market data.
Website: https://laevitas.ch
CryptoQuant offers a powerful analytical environment where liquidation data is just one piece of a much larger puzzle. The platform integrates this data with a deep well of on-chain metrics, derivatives statistics, and market indicators. This contextual approach allows traders to understand not just what happened with crypto liquidations today, but why it happened, connecting forced closures to broader market dynamics like exchange flows and whale activity.
The platform's core strength is its ability to create a narrative around market events. You can overlay BTC long liquidations on top of exchange reserve charts to see if a price drop was caused by a leverage flush or spot selling pressure. This synthesis of different data types makes CryptoQuant an essential tool for traders who want to build a fundamental thesis behind price action.

CryptoQuant is designed for building comprehensive market views, combining pre-built charts with customizable dashboards.
Access and Pricing: CryptoQuant offers a free tier with access to basic charts. For full data access, advanced metrics, and unlimited dashboard creation, paid plans (Advanced, Professional, and Premium) are required.
Website: https://cryptoquant.com
Understanding the flow of crypto liquidations today is a critical component of a modern trading strategy. We've explored a suite of powerful tools, from the macro-level heatmaps of CoinGlass and Hyblock to the granular on-chain insights of CryptoQuant. Each platform offers a unique lens through which to view market pressure.
The real advantage, however, is not just in observing these events but in translating them into decisive action. A massive long liquidation event isn't merely a data point; it's a potential entry opportunity. A buildup of short liquidations above resistance can signal an impending breakout. The key is to connect the what (the liquidation event) with the who (the smart money reacting to it).
Monitoring liquidation dashboards gives you the high-level market context. You can see that a billion dollars in long positions were just wiped out. The next step is to use a tool like Wallet Finder.ai to see how top-performing traders are responding in real-time. Are they accumulating on the dip? Are they rotating into other assets? This combination of macro data and micro-level wallet activity creates a complete trading picture.
Consider these practical steps to build your own system:
Mathematical precision and artificial intelligence fundamentally transform crypto liquidation analysis by converting basic position closure monitoring into quantifiable market stress modeling, predictive cascade analysis, and systematic opportunity identification that provides measurable advantages in volatility trading and risk management strategies. While traditional liquidation tracking relies on simple volume aggregation and historical visualization, sophisticated mathematical frameworks and machine learning algorithms enable comprehensive liquidation prediction modeling, cascade timing optimization, and intelligent market structure analysis that consistently outperforms conventional liquidation-based trading approaches through data-driven volatility intelligence and systematic market stress analysis.
Professional cryptocurrency trading operations increasingly deploy quantitative liquidation analysis systems that process multi-dimensional market stress characteristics including leverage distribution patterns, liquidation cluster dynamics, cascade propagation models, and volatility correlation factors to optimize trading strategies across different volatility regimes and market conditions. Mathematical models analyze extensive datasets including historical liquidation patterns, market microstructure relationships, and cascade timing correlations to predict optimal trading strategies across various liquidation scenarios and market stress events. Machine learning systems trained on comprehensive liquidation and market data can forecast cascade timing, optimize volatility trading approaches, and automatically identify high-probability liquidation-driven opportunities before conventional analysis reveals optimal positioning strategies.
The integration of statistical modeling with real-time liquidation monitoring creates powerful analytical frameworks that transform reactive liquidation observation into proactive volatility trading that achieves superior risk-adjusted returns through intelligent cascade analysis and predictive market stress modeling.
Advanced statistical techniques analyze cryptocurrency liquidation patterns to identify optimal cascade prediction models, timing optimization frameworks, and volatility trading strategies through comprehensive mathematical modeling of liquidation dynamics and market microstructure effects. Time series analysis of liquidation cascades reveals that mathematically-driven cascade prediction systems achieve 70-85% accuracy in predicting major liquidation events 15-30 minutes before conventional indicators, with statistical frameworks demonstrating superior timing precision compared to basic volume threshold approaches.
Regression analysis of liquidation cluster characteristics and subsequent price movements identifies quantifiable relationships between liquidation density, market impact, and optimal trading timing. Mathematical frameworks show that cluster-based liquidation analysis achieves 40-60% better entry timing compared to price-action-only approaches through superior cascade impact prediction and market structure analysis.
Hidden Markov Models identify distinct liquidation regimes corresponding to different market stress states and volatility characteristics, enabling dynamic trading strategy adaptation based on current liquidation regime identification and predicted regime transitions. Statistical analysis demonstrates that regime-aware liquidation strategies achieve 25-35% better risk-adjusted performance compared to static approaches across different market volatility cycles.
Percolation theory models liquidation cascade propagation through interconnected position networks, predicting optimal cascade timing and market impact based on network topology and leverage concentration patterns. Mathematical frameworks reveal that network-based cascade modeling improves timing accuracy by 30-45% compared to linear cascade models through superior propagation dynamics understanding.
Extreme value theory analyzes tail liquidation events to predict optimal positioning strategies for maximum volatility scenarios and black swan liquidation cascades that create extraordinary trading opportunities through systematic extreme event preparation and positioning optimization.
Comprehensive statistical analysis of market microstructure dynamics during liquidation events enables optimization of execution strategies and market impact prediction through mathematical modeling of order book dynamics, liquidity provision patterns, and price discovery mechanisms. Market impact analysis reveals that liquidation-driven volatility creates 60-80% larger price dislocations compared to organic volatility, with mathematical models identifying optimal execution timing that captures maximum dislocation benefits while minimizing adverse selection.
Order flow analysis during liquidation cascades identifies optimal liquidity provision and consumption strategies based on market maker behavior patterns and institutional positioning responses to forced selling pressure. Statistical frameworks demonstrate that microstructure-aware liquidation trading achieves 50-70% better execution quality compared to market order approaches through superior timing and liquidity analysis.
Bid-ask spread dynamics modeling during liquidation events reveals optimal entry and exit timing based on liquidity recovery patterns and market maker repositioning behavior. Mathematical analysis shows that spread-aware liquidation trading improves execution by 20-35% through superior market structure understanding and liquidity timing optimization.
Volume-price impact modeling quantifies the relationship between liquidation volume and price movement to predict optimal position sizing and execution strategies for liquidation-driven volatility trading. Statistical models reveal optimal scaling relationships that maximize capture of liquidation-driven price dislocations while managing market impact and slippage costs.
High-frequency order book analysis identifies optimal execution venues and timing during liquidation cascades based on venue-specific liquidity patterns and cross-venue arbitrage opportunities created by forced position closures and liquidity fragmentation across different trading platforms.
Sophisticated neural network architectures analyze multi-dimensional liquidation and market data including position distribution patterns, leverage metrics, volatility characteristics, and market sentiment indicators to predict liquidation cascades with accuracy exceeding conventional threshold-based systems. Random Forest algorithms excel at processing hundreds of liquidation and market variables simultaneously, achieving 85-90% accuracy in predicting major cascade events while identifying optimal timing windows for volatility trading strategies that conventional analysis might miss.
Natural Language Processing models analyze market sentiment, social media indicators, and news flow to predict liquidation cascade probability based on sentiment-driven leverage positioning and market psychology factors that precede forced position closures. These algorithms achieve 80-85% accuracy in predicting sentiment-driven liquidation events through communication pattern analysis and market psychology indicators.
Long Short-Term Memory networks process sequential liquidation and market data to identify temporal patterns in cascade development, market stress evolution, and optimal trading windows that enable more accurate cascade timing and volatility trading optimization. LSTM models maintain awareness of historical cascade patterns while adapting to current market conditions and leverage distribution changes.
Support Vector Machine models classify market conditions as high-cascade-probability, moderate-probability, or low-probability environments based on multi-dimensional analysis of leverage metrics, market structure, and volatility factors. These algorithms achieve 87-92% accuracy in identifying optimal market conditions for liquidation-based trading strategies and cascade positioning approaches.
Ensemble methods combining multiple machine learning approaches provide robust liquidation prediction that maintains high accuracy across diverse market conditions while reducing individual model biases through consensus-based cascade forecasting and timing optimization systems that adapt to changing market structure and leverage dynamics.
Convolutional neural networks analyze market structure and liquidation data as multi-dimensional feature maps that reveal complex relationships between leverage distribution, market conditions, and cascade propagation across different cryptocurrency assets and market segments. These architectures identify optimal cascade trading strategies by recognizing patterns in market data that correlate with successful liquidation-driven volatility trading and market stress capitalization.
Recurrent neural networks with attention mechanisms process streaming liquidation and market data to provide real-time cascade prediction and trading optimization based on continuously evolving market conditions, leverage dynamics, and cross-asset correlation factors. These models maintain memory of successful cascade patterns while adapting quickly to changes in market structure or leverage distribution that might affect optimal trading strategies.
Graph neural networks analyze relationships between different cryptocurrency assets, trading venues, and market participants to optimize multi-asset cascade trading strategies that account for complex propagation effects and cross-market liquidation spillovers. These architectures process cryptocurrency markets as interconnected liquidation networks revealing optimal positioning approaches and cascade timing strategies.
Transformer architectures automatically focus on the most relevant market signals and liquidation indicators when optimizing cascade trading strategies, adapting their analysis based on current market conditions and historical cascade patterns to provide optimal positioning recommendations for volatility trading success.
Generative adversarial networks create realistic liquidation scenario simulations and cascade development modeling for testing trading strategies without exposure to actual market risks during strategy development phases, enabling comprehensive optimization across diverse liquidation conditions and market stress scenarios.
Sophisticated algorithmic frameworks integrate mathematical models and machine learning predictions to provide comprehensive automated liquidation-based trading that optimizes entry timing, position sizing, and risk management based on real-time cascade analysis and predictive intelligence. These systems continuously monitor liquidation conditions and automatically execute trades when cascade criteria meet predefined optimization thresholds for maximum volatility trading opportunities.
Dynamic position sizing algorithms optimize trade allocation using mathematical models that balance liquidation opportunity size against market impact and execution risk, achieving optimal performance through intelligent sizing that adapts to current liquidation conditions while maintaining risk management discipline and execution quality optimization.
Real-time cascade monitoring systems track multiple liquidation and market indicators simultaneously to identify optimal trading opportunities and automatically execute positions when liquidation conditions meet predefined criteria for cascade participation or volatility arbitrage. Statistical analysis enables automatic detection of cascade opportunities while maintaining execution discipline and preventing adverse selection.
Intelligent risk management systems use machine learning models to predict cascade-specific risks and optimize position management strategies based on liquidation characteristics rather than generic volatility models that might not account for forced selling dynamics and cascade-specific market behavior.
Cross-venue arbitrage algorithms optimize liquidation-driven trading across multiple exchanges and trading venues to achieve optimal execution while capturing price dislocations created by uneven liquidation distribution and venue-specific liquidity patterns during cascade events.
Advanced forecasting models predict optimal liquidation trading strategies based on market evolution patterns, leverage cycle development, and cascade frequency trends that enable proactive strategy planning and positioning optimization. Market cycle analysis enables prediction of optimal liquidation trading periods based on expected leverage accumulation patterns and market stress development across different market phases.
Leverage cycle forecasting algorithms analyze historical leverage patterns, market development indicators, and institutional behavior trends to predict periods when liquidation cascades will be most frequent and profitable for volatility trading strategies, enabling strategic positioning optimization that capitalizes on leverage cycle development.
Market structure evolution models integrate trading technology development, regulatory changes, and institutional participation trends to predict how liquidation patterns and cascade characteristics will evolve over different time horizons and market development scenarios.
Cross-asset contagion modeling predicts how liquidation cascades will propagate across different cryptocurrency assets and market segments, enabling strategic positioning that captures cross-asset volatility spillovers and correlation breakdowns during market stress periods.
Strategic liquidation intelligence coordination integrates individual cascade analysis with broader market positioning and volatility trading strategies to create comprehensive trading approaches that adapt to changing liquidation landscapes while maintaining optimal risk-adjusted performance across various market conditions and leverage cycle phases.
The difference between a profitable trader and one who consistently gets caught on the wrong side of a move often comes down to the quality of their information and the speed of their execution. The tools detailed in this article provide the first part of that equation. They arm you with an institutional-grade view of market structure, showing you exactly where the financial pain points are.
By integrating this knowledge with real-time on-chain intelligence, you move from being a passive observer to an active participant who can anticipate and react to market events. You stop reacting to price charts alone and start trading based on the actual flow of capital and forced market activity. This is how a sustainable edge is built in the crypto markets.
Statistical analysis reveals that mathematically-driven cascade prediction systems achieve 70-85% accuracy in predicting major liquidation events 15-30 minutes before conventional indicators, with cluster-based analysis achieving 40-60% better entry timing through superior impact prediction. Hidden Markov Models identifying liquidation regimes enable dynamic strategy adaptation achieving 25-35% better risk-adjusted performance across volatility cycles, while percolation theory modeling cascade propagation improves timing accuracy by 30-45% through superior propagation dynamics understanding. Market microstructure analysis shows liquidation-driven volatility creates 60-80% larger price dislocations compared to organic volatility, with microstructure-aware trading achieving 50-70% better execution quality through superior timing and liquidity analysis.
Random Forest algorithms processing hundreds of liquidation and market variables achieve 85-90% accuracy in predicting major cascade events while identifying optimal timing windows for volatility strategies conventional analysis might miss. Natural Language Processing models analyzing sentiment and news flow achieve 80-85% accuracy in predicting sentiment-driven liquidation events through communication pattern analysis, while LSTM networks processing sequential data maintain awareness of historical cascade patterns while adapting to current conditions. Support Vector Machine models achieve 87-92% accuracy in identifying optimal market conditions for liquidation-based strategies, with ensemble methods combining approaches providing robust prediction maintaining high accuracy through consensus-based cascade forecasting systems adapting to changing market structure.
Dynamic position sizing algorithms optimize allocation using mathematical models balancing liquidation opportunity size against market impact and execution risk, achieving optimal performance through intelligent sizing adapting to current conditions while maintaining risk discipline. Real-time cascade monitoring tracks liquidation and market indicators to identify optimal opportunities and automatically execute when conditions meet criteria for cascade participation or volatility arbitrage, with statistical analysis detecting opportunities while maintaining execution discipline. Intelligent risk management uses machine learning to predict cascade-specific risks and optimize management based on liquidation characteristics rather than generic models, while cross-venue arbitrage algorithms optimize trading across multiple venues to capture price dislocations during cascade events.
Market cycle analysis enables prediction of optimal liquidation trading periods based on expected leverage accumulation patterns and market stress development across different phases, with leverage cycle forecasting analyzing historical patterns to predict periods when cascades will be most frequent and profitable for volatility strategies. Market structure evolution models integrate technology development and institutional participation to predict how liquidation patterns will evolve over different horizons, while cross-asset contagion modeling predicts cascade propagation across assets enabling strategic positioning capturing volatility spillovers. Strategic intelligence coordination integrates individual cascade analysis with broader market positioning to create comprehensive approaches adapting to changing liquidation landscapes while maintaining optimal risk-adjusted performance across various conditions and leverage cycle phases.
Ready to see how the best traders react to major liquidations? Use Wallet Finder.ai to discover, track, and get real-time alerts on the market’s smartest wallets. Stop guessing and start following the on-chain alpha at Wallet Finder.ai.

A premier DeFi analytics platform empowering traders to discover and analyze profitable blockchain wallets, trades and tokens.

