Year to Date Performance: Your 2026 DeFi Guide

Wallet Finder

Blank calendar icon with grid of squares representing days.

May 27, 2026

You're scanning wallet rankings, and one address jumps out with a giant year to date gain. Your first instinct is simple: copy it.

That's how a lot of traders get trapped.

A big year to date performance number can point to skill, strong positioning, or early conviction. It can also hide one lucky trade, a tiny starting base, or a strategy that only worked in a narrow burst of market mania. In DeFi, where wallets rotate through memes, perp bets, farming, airdrops, and liquidity games, a single percentage can be both useful and dangerously incomplete.

If you trade by headline numbers alone, you'll end up following noise. If you understand what YTD measures, how it gets distorted, and how to pair it with the right filters, you can use it the way experienced analysts do: as a fast screening tool, not a final verdict.

Understanding Year to Date Performance in DeFi

A wallet shows a massive YTD return. You check the recent trades and see a memecoin entry near the bottom, then a quick exit near the top. It looks brilliant. The problem is that the number itself doesn't tell you whether that trader is consistently good or landed one extraordinary hit.

That's why YTD causes so much confusion. It looks definitive because it's a single clean figure, but it compresses months of behavior into one line. In practice, YTD can be highly sensitive to the start date and recent volatility, so two assets with the same YTD return can carry very different risk profiles, as noted in this market commentary on YTD reliability and start-date sensitivity.

For DeFi traders, that issue gets sharper. Wallets don't just hold spot tokens. They bridge chains, add collateral, harvest rewards, rotate narratives, and sometimes sit inactive for stretches before one explosive trade changes the whole picture.

Why DeFi traders misread YTD

Three mistakes show up again and again:

  • They treat YTD as proof of skill. A high return might reflect timing, not repeatable execution.
  • They ignore path and risk. Two wallets can arrive at the same result through very different drawdowns and position sizing.
  • They skip context. A wallet may be up sharply because of one airdrop, one low-float token, or one early ecosystem bet.

Practical rule: Use YTD to find candidates worth investigating. Don't use it alone to decide who to copy.

The right question isn't “Who has the highest YTD?” It's “Who produced a strong YTD in a way I can understand, trust, and potentially replicate?”

That shift matters. It turns YTD from a vanity number into a research starting point.

What Is YTD Performance and Why It Matters

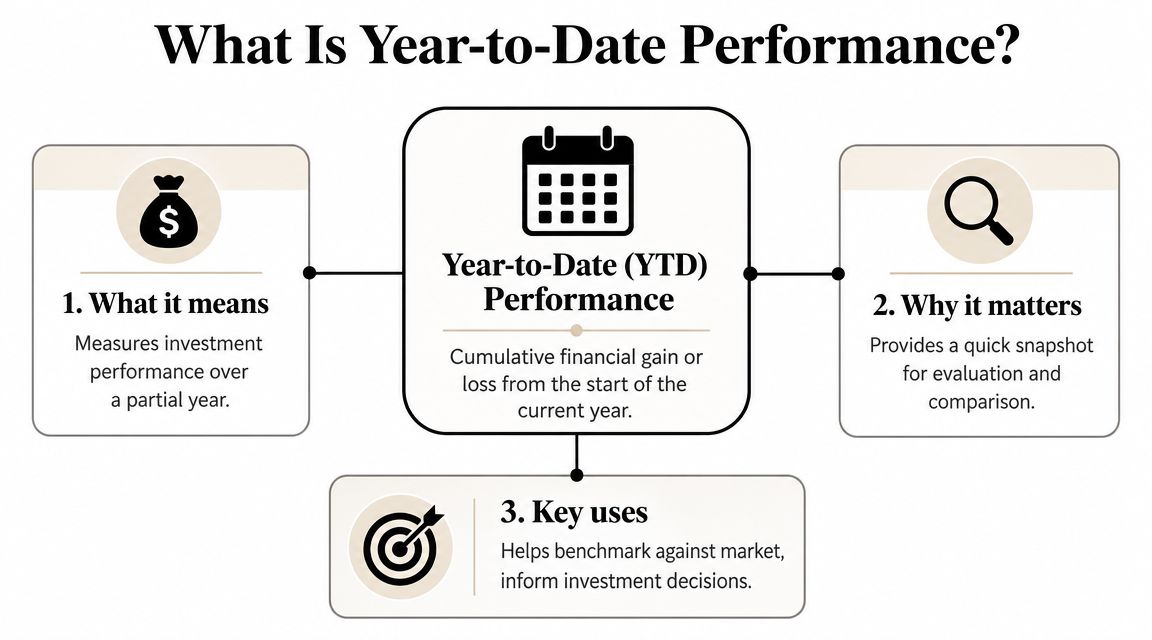
Year to date performance is the cumulative gain or loss from the first trading day of the calendar year up to the latest available point. Think of it as a mid-year report card. It tells you how an asset, strategy, or wallet has done so far this year, but it doesn't tell you everything about how those results were earned.
What Is YTD Performance and Why It Matters

In traditional market analytics, YTD is usually measured as the percentage change from the first trading day of the year to the latest close. For broad benchmarks, analysts often separate price return from total return because income changes the final result. S&P Global notes that the S&P 500's 2025 gain was 16.39% on a price basis versus 17.88% including dividends in its market attributes commentary.

That distinction matters even more in DeFi.

Price return versus total return in DeFi

If you only look at token price movement, you'll miss part of what the wallet earned. In DeFi, a fuller return picture may include:

  • Staking rewards from holding and securing a network
  • Airdrops that boosted wallet value without a direct buy
  • Liquidity incentives earned while providing capital
  • Yield farming proceeds from protocol participation

A wallet can look mediocre on price alone and still be strong on total economic return. The reverse is also true. A token price might surge while the trader gives back value through poor exits, slippage, or weak allocation discipline.

Why YTD matters for comparison

YTD helps because it puts multiple things on the same clock.

When you compare two wallets, two sectors, or two token baskets, YTD says: “Let's judge them over the same calendar window.” That standardization is useful when narratives shift quickly and traders need a common baseline.

Here's where it helps most:

What you're comparingWhy YTD helps
Wallet versus walletShows who captured more of this year's opportunity set
Token versus tokenHighlights relative strength in the same market regime
Strategy versus strategyMakes it easier to compare trend-following, farming, and rotation plays on equal dates

A good YTD number answers one narrow question well: how much ground has this wallet covered since the year began?

That's valuable. It's also incomplete, which is why interpretation matters as much as calculation.

How to Calculate Year to Date Performance

The core formula is simple:

YTD Return = ((Current Value - Starting Value) / Starting Value) × 100

How to Calculate Year to Date Performance

On paper, that looks easy. In a real DeFi wallet, it often isn't.

A clean example

Start with the simplest possible case. A wallet holds only one asset from the first trading day of the year until today. No deposits. No withdrawals. No rewards. No transfers between chains.

In that setup:

  1. Record the wallet value at the start of the year.
  2. Record the wallet value today.
  3. Subtract the starting value from the current value.
  4. Divide the change by the starting value.
  5. Convert it into a percentage.

That's the logic behind every YTD figure you see.

Where DeFi makes the math messy

Now take a more realistic wallet. It starts the year with ETH and SOL. Later, the trader adds fresh capital. Then the wallet receives an airdrop. Later still, the trader deploys assets into a farming position, exits part of it, and rotates the proceeds into a different token on another chain.

At that point, several problems appear:

  • Cash flow distortion: New deposits can make performance look stronger if you don't separate contribution from investment gain.
  • Reward accounting: Airdrops and yield need to be treated consistently.
  • Transfer noise: Moving assets between chains or wallets can look like exits or entries if the data model is weak.
  • Valuation timing: The same wallet can look different depending on when each asset gets priced.

Manual tracking usually breaks down here. You can sketch the logic, but once a wallet has many trades and multiple income sources, you need structured PnL tracking.

A practical way to think about it

Use two layers:

LayerQuestion
Calculation layerWhat was the wallet worth at the start of the year versus now?
attribution layerWhat part of the result came from price moves, rewards, timing, and new capital?

The first layer gives you the score. The second explains the score.

If you want to sharpen your intuition for return math beyond YTD, a separate ROI calculator guide helps clarify how gain, cost basis, and investment return differ in trading analysis.

Don't confuse a hard-looking percentage with easy math. In DeFi, the formula is simple, but the data inputs are rarely clean.

That's why serious traders care less about memorizing the equation and more about knowing what can contaminate the result.

Interpreting YTD and Its Hidden Dangers

A strong YTD figure attracts attention because it compresses complexity into one bold number. That's useful for screening. It's risky for judgment.

Interpreting YTD and Its Hidden Dangers

The biggest trap is assuming a high YTD means a wallet is currently strong, consistently strong, or safe to follow. None of those conclusions automatically follows.

The same return can mean very different things

A wallet that reaches a high YTD early in the year has done something very different from one that reaches the same number much later. The raw percentage doesn't show speed, efficiency, or the amount of risk taken along the way.

It also doesn't show path.

One trader may grind upward through many disciplined trades. Another may suffer large swings, nearly blow up, then recover on one outsized winner. If both end up with the same YTD, the number hides the difference in process.

YTD is a snapshot, not a permanent label

In traditional markets, YTD can move hard over a short stretch. The Dow Jones Industrial Average's 2026 YTD return was 5.05% as of May 26, 2026, while it was -3.58% on March 31, according to Slickcharts market-close YTD data. That swing happened over just a few weeks.

If that can happen in a major equity index, imagine how much faster the label can change in DeFi.

A wallet that looked untouchable in one month can look ordinary after a reversal. Another can look mediocre for weeks, then jump because its sector finally catches a bid.

A YTD leader isn't always a current leader. Sometimes you're looking at old alpha preserved in a calendar metric.

Before copying any wallet, ask when the gains happened.

Four common dangers

Start-date bias

YTD begins at the calendar year boundary. That's convenient, but arbitrary. A strategy that entered a major trend just before January can look similar to one that entered just after, even though their actual trade quality differs.

One-hit-wonder bias

A wallet can post an eye-popping YTD because of one extraordinary trade. Everything after that may be flat, inconsistent, or poor.

Check whether the PnL came from broad participation across trades or from one spike.

Survivorship bias

You usually notice the wallet that survived and won. You don't see the cluster of similar wallets that took the same type of risk and failed. That can make a fragile style look more sturdy than it is.

Return-without-context bias

A percentage without attribution tells you very little about durability. A separate guide to performance attribution is useful because it breaks returns into drivers instead of treating one top-line number as the whole story.

Here's a helpful reset before you continue your wallet research:

Questions that protect you

Use this short checklist when a wallet's YTD looks exceptional:

  • When did the gains happen? Early burst, steady climb, or recent acceleration?
  • How concentrated were the winners? Broad edge or one huge outlier?
  • Did the wallet stay active? Consistent execution matters more than one perfect call.
  • Can you replicate the style? If the edge depended on obscure access, speed, or luck, copying may fail.

YTD vs MTD, CAGR and Rolling Returns

YTD is useful, but it's only one lens. Professional traders compare several performance views because each metric answers a different question.

One reason is simple: a one-year window can look precise while still hiding whether performance is durable, repeatable, or driven by a narrow period of outperformance, as discussed in this research on variability within one-year measurement windows.

Performance Metrics Compared

MetricTimeframeBest Use CaseKey Limitation
YTDFrom the first trading day of the year to todayComparing wallets or assets on the same calendar windowSensitive to start date and recent moves
MTDFrom the start of the current month to todayChecking short-term momentum and recent trader formToo short to judge consistency
CAGRMulti-year annualized growth rateEvaluating long-term strategy qualityNot useful for fresh strategies with short histories
Rolling returnsA moving fixed window such as recent trailing periodsReducing calendar distortions and testing consistency across different entry pointsHarder to summarize in one headline number

When YTD is the right tool

YTD works well when you want a quick answer to a calendar-year question.

Examples:

  • Which wallet has captured the current year's trend best?
  • Which sector rotation has worked better since January?
  • Which strategies are leading in the present regime?

That makes YTD especially good for leaderboard scanning and broad ranking.

When another metric is better

MTD for current heat

A wallet with strong YTD may have gone cold. MTD helps you detect whether recent execution still looks sharp. If you copy active traders, recent form often matters more than what they did months ago.

CAGR for strategy quality

CAGR is a longer-horizon lens. It matters when you're studying whether someone can compound over time rather than just ride one annual wave.

Rolling returns for consistency

Rolling windows help reduce the distortion created by the calendar reset. Instead of asking, “How has this wallet done since January?” you ask, “How has this wallet performed over repeated trailing periods?” That's closer to how consistency feels in practice.

Analyst's shortcut: Use YTD to rank. Use MTD to verify current momentum. Use rolling views to judge stability.

A simple decision framework

If your question is about present-year opportunity, use YTD.

If your question is about what's working right now, use MTD.

If your question is about whether a trader has a process that survives different market conditions, use rolling returns or longer-horizon analysis.

That combination prevents a classic mistake: mistaking a calendar-based score for a complete evaluation.

Finding Winning Wallets with YTD on Wallet Finder.ai

The amateur move is to sort by YTD and copy the top wallet.

The professional move is to treat YTD like the first screen in a deeper filtering process.

Finding Winning Wallets with YTD on Wallet Finder.ai

A wallet tracker proves useful. Wallet Finder.ai lets traders inspect ranked wallets, historical trades, PnL behavior, entry and exit timing, and other on-chain activity signals rather than relying on one headline return. If you want the broader feature context, the platform's wallet tracker overview explains the available tracking workflow.

A better workflow than leaderboard chasing

Start with YTD, then narrow aggressively.

  1. Use YTD as your first pass
    You're not selecting a wallet yet. You're reducing the search field to addresses that have participated in this year's upside.

  2. Check trade distribution
    Scan whether gains were concentrated in one trade or spread across many positions. A lopsided distribution often signals luck or a one-off narrative hit.

  3. Review activity pattern
    A wallet that traded steadily gives you more evidence than one that appears only during a brief mania window.

  4. Inspect execution style
    Look at position sizing, holding period, and exit behavior. You want a style you can follow without changing your own risk profile beyond recognition.

What strong YTD looks like in practice

A more credible wallet usually shows a cluster of healthy traits:

  • Repeatable behavior: Entries and exits follow a visible pattern instead of random impulse.
  • Sustained participation: The wallet remains active across multiple setups, not just one.
  • Reasonable concentration: Big winners help, but the whole year doesn't rest on a single lottery ticket.
  • Understandable strategy: You can tell whether the trader focuses on momentum, rotation, farming, early ecosystem discovery, or another style.

A practical review checklist

Use this before mirroring any wallet you find through a YTD screen:

CheckWhat you want to seeWarning sign
Trade historyMultiple meaningful tradesOne giant winner dominates everything
Recent behaviorContinued activity and decision-makingLong inactivity after early gains
Positioning styleA pattern you can recognizeRandom shifts across unrelated setups
Risk profileDrawdowns you can tolerateLarge swings that don't fit your plan

Don't copy a wallet because its YTD looks impressive. Copy only if the underlying behavior matches a process you understand.

The highest-return wallet isn't always the best wallet to follow. A lower-ranked wallet with steadier execution, clearer timing, and a more replicable style can be far more useful in live trading.

That's the core shift. YTD helps you find candidates fast. Your real edge comes from filtering for quality after that first screen.


Wallet Finder.ai helps you turn year to date performance from a flashy leaderboard number into a practical research workflow. You can use it to discover wallets, inspect full trading histories, compare return patterns, and monitor new moves in real time before deciding whether a trader's edge looks durable enough to follow.