
Recovery Factor Calculation for Smart Traders
Master the recovery factor calculation to measure a strategy's resilience. Learn the formula, see DeFi examples, and find top wallets with Wallet Finder.ai.

June 20, 2026


Wallet Finder
March 28, 2026

If you've spent any time in crypto, you know most trading strategies are directional. You buy, hoping the price goes up. You short, betting it goes down. The problem? This ties your fate directly to the whims of the market, making you a passenger in a very volatile vehicle. Even a solid trading thesis can get completely wiped out by a sudden market crash or an unexpected rally.
But what if there was a way to trade that didn't depend on predicting where the whole market is headed?
That's where cryptocurrency pair trading comes in. It's a market-neutral strategy that profits from the price difference between two related assets, not their absolute direction. The idea is to simultaneously buy an undervalued crypto and short an overvalued one, betting that their price relationship—the spread—will eventually snap back to its historical average.

Pair trading offers a totally different approach by focusing on statistical arbitrage. Think of it like a seesaw. Instead of guessing if the whole playground will get sun or rain, you're just focused on the seesaw itself. You bet that when one side goes unusually high, it will eventually come back down, bringing the other side up to meet it.
This method actually thrives on crypto's signature volatility. When the price spread between two historically linked assets, like Bitcoin and Ethereum, stretches way beyond its normal range, a pair trader sees an opportunity. They'll go long on the underperforming asset and short the outperformer, waiting for that gap to close.
The core idea is simple: You are not trading coins; you are trading the relationship between them. This fundamentally changes how you view risk and opportunity, moving away from market forecasting and toward statistical probability.
The entire strategy hinges on a powerful financial principle called mean reversion. It's the theory that prices and other metrics eventually move back toward their long-term average. When you apply this to two cointegrated crypto assets, their price spread tends to swing back and forth around a stable equilibrium.
This isn't just theory; the numbers back it up. One academic study found that a cryptocurrency pair trading strategy delivered average monthly abnormal returns of 12% over a three-year period. In another real-world example, a simple BTC-ETH pair trading system generated a total portfolio return of 43.4% during a volatile six-month stretch in 2021, just by capitalizing on these temporary price divergences. You can dig into the specifics in this crypto pairs trading study.
This guide will walk you through building a solid system to do this yourself. Before we dive in, here’s a quick overview of the essential parts we'll be covering.
By mastering these pillars, you can move away from pure speculation and build a more consistent, all-weather approach to trading the crypto markets.
The entire success of your pair trading strategy hinges on one thing: picking the right pair. It’s easy to just grab two coins that seem to move together, but that’s a surface-level approach that usually ends in frustration. The real money is made by digging deeper into their statistical relationship.
A huge mistake I see traders make is confusing correlation with cointegration. Correlation just means two assets tend to zig and zag in the same general direction. That’s a start, but it’s not enough. Cointegration is the real prize. It implies a stable, long-term economic connection between two assets, meaning that even when their prices wander apart, they have a strong statistical pull to snap back together.
Think of it like a dog on a leash. The dog (a correlated asset) can run ahead or fall behind you, but the leash (the cointegrating relationship) makes sure it never gets too far away for too long. Our job as traders is to figure out how long that leash is and place our bets when it's stretched to its absolute limit.
A great place to start is by looking for assets that share a similar story or purpose. This gives you a fundamental reason for their prices to be linked, which dramatically boosts the odds of finding a true cointegrated relationship.
Here are a few hunting grounds I’ve found to be particularly fruitful:
As you start digging into potential assets, using a tool like a CoinMarketCap watch list can be a massive help. It keeps everything organized and makes comparing potential pairs much less of a headache.
Once you’ve got a shortlist of candidates, you have to prove their relationship statistically. This isn't about gut feelings. We need to run a specific statistical test to confirm that the price difference—the "spread"—between the two assets is stationary. A stationary series is one that always wants to return to its long-term average.
The go-to tool for this is the Augmented Dickey-Fuller (ADF) test. You don’t need a Ph.D. in statistics, but you do need to understand what its results are telling you.
You run the ADF test on the historical spread of your potential pair, and it spits out a p-value.
Key Takeaway: If the p-value from your ADF test comes in below a certain threshold (the standard is 0.05), you can confidently say the spread is stationary. This is your statistical green light; it confirms the pair is likely cointegrated and a solid candidate for a mean-reversion strategy.
Let's make this concrete. Say you want to test the ETH/BTC pair.
Spread = Price(ETH) / Price(BTC). This creates a new time series representing their relationship.statsmodels).On the flip side, if the p-value was 0.35, that’s a red flag. The relationship isn't stable enough. You'd scrap that pair and move on to the next one on your list.
This disciplined, data-first approach is what separates the pros from the amateurs. It replaces hunches with hard evidence and builds a solid foundation for the entry and exit rules we're going to cover next.
Once you've found a statistically sound pair, it's time to build the engine of your trading system. This is where we shift from theory to a concrete, rules-based plan. Without objective rules, you're just gambling on gut feelings, and that's a quick way to lose money.
The first job is to turn the raw price spread into a standardized signal—something that tells you exactly how far from "normal" the pair's relationship has strayed. For this, the Z-score is your best friend. The Z-score simply measures how many standard deviations the current spread is from its historical average.
This calculation transforms chaotic price action into a simple, actionable number. A Z-score of 0 means the spread is right at its historical average. A +2.0 means it’s two standard deviations above the average, and a -2.0 means it’s two standard deviations below.
This flowchart gives you a bird's-eye view of the entire process, from finding a pair to validating it for your strategy.
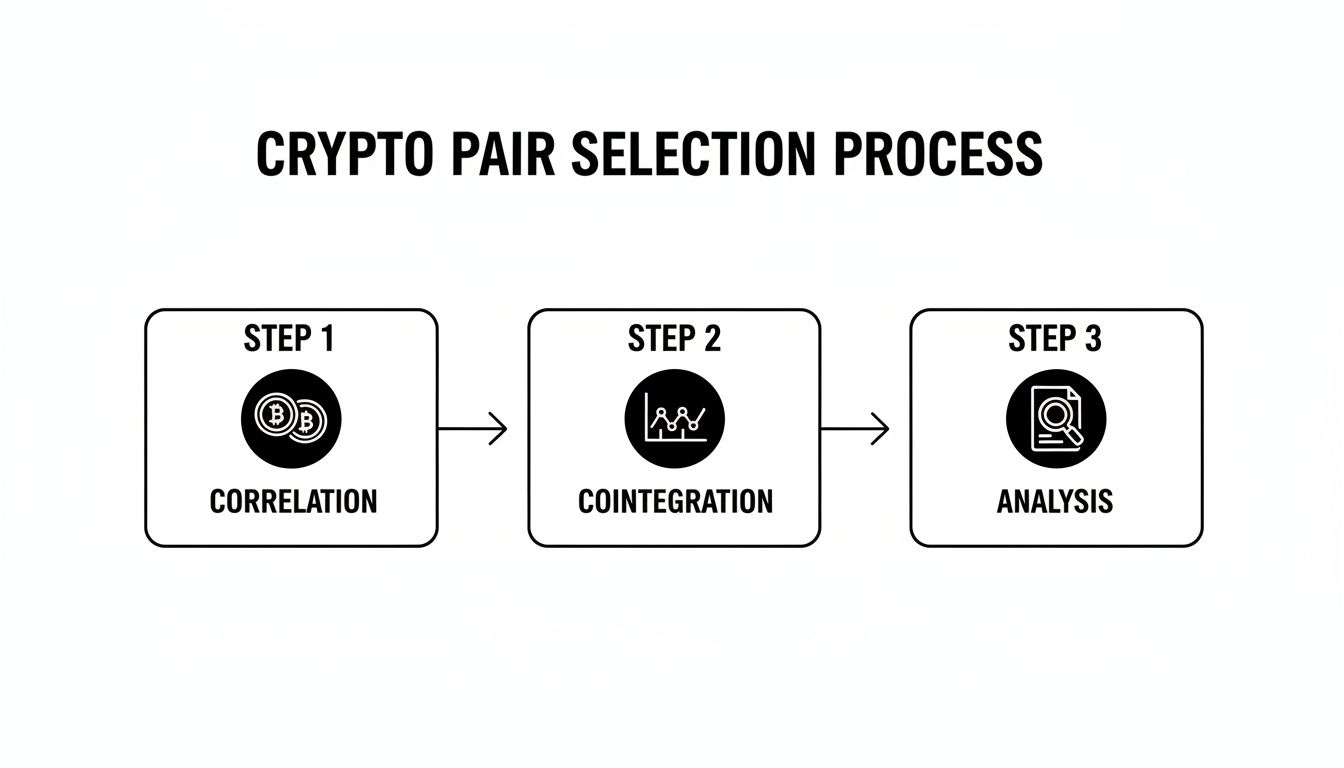
As the graphic shows, a systematic approach is key. Moving from correlation to cointegration and then to deeper analysis is what creates the foundation for reliable trade signals.
Your Z-score is the trigger for your entire operation. A common and effective starting point is setting entry thresholds at +2.0 and -2.0. These levels represent a significant statistical deviation, suggesting the spread is overextended and likely to snap back.
Here’s how this translates into a clear set of rules:
This mechanical approach pulls emotion out of the equation. The numbers tell you what to do, which is critical for staying consistent in cryptocurrency pair trading. It stops you from second-guessing an exit or getting greedy and holding on too long.
Executing a pair trade means placing two orders at the exact same time. Let's walk through a real-world example with the Arbitrum (ARB) and Optimism (OP) pair. Imagine your analysis shows ARB is overvalued relative to OP, pushing the Z-score to +2.2.
Here’s what you would do:
You're now in the trade. You are effectively "net long" the OP/ARB relationship and are waiting for ARB's price to fall relative to OP's, which would bring that Z-score back toward zero.
Remember, the goal isn't for OP to go up or ARB to go down in absolute terms. You can make money even if both coins fall, as long as ARB falls more than OP.
Mean reversion is a high-probability strategy, but it’s not a sure thing. Sometimes, a fundamental change can permanently break a historical relationship. This is why a hard stop-loss is the most important rule you'll set.
A common stop-loss is a Z-score threshold of 3.0. If the spread blows past your entry and hits a Z-score of +3.0 or -3.0, it’s a massive red flag that something is fundamentally wrong. You exit the trade immediately to protect your capital. Sticking to this rule is what separates sustainable traders from those who blow up their accounts.
While you can fine-tune these rules, validating them through rigorous testing is non-negotiable. For a deeper dive on this, check out our guide on how to backtest trading strategies.
Some traders are even using more advanced models to refine these triggers. One deep learning-enhanced strategy for crypto, for example, generated 113 trading signals over several years and hit an impressive 71.68% win rate. By using neural networks to forecast spread movements, the model adapted to shifting volatility far better than static rules ever could.
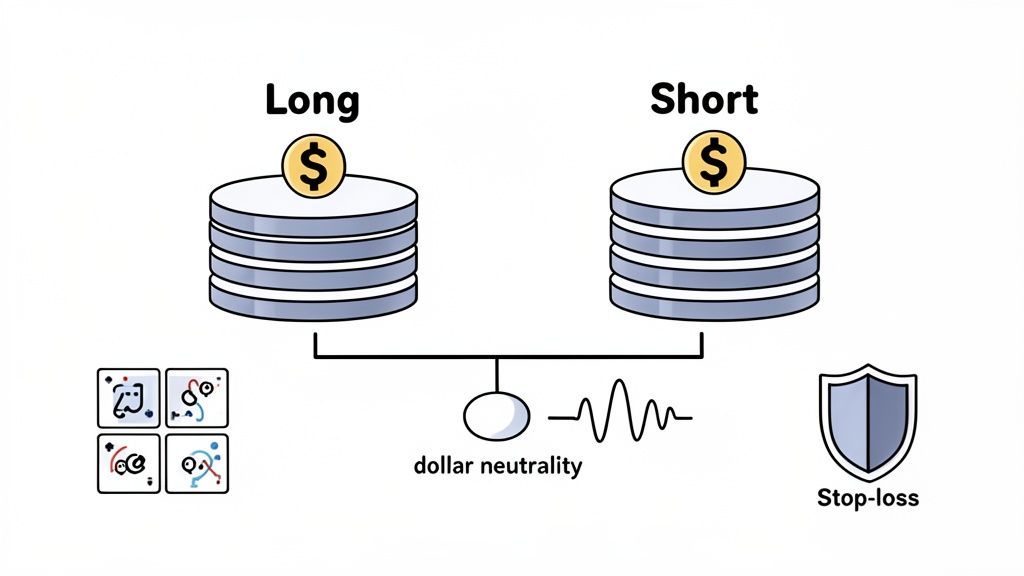
Nailing your entry signal is a great start, but it's only half the battle. Without a solid risk management plan, even the most promising strategy is a recipe for disaster. When you’re pair trading crypto, your goal is market neutrality, and disciplined risk control is what separates the consistently profitable traders from the ones just getting lucky.
The absolute core principle here is to protect your capital at all costs. This lets you stay in the game long enough for your statistical edge to actually play out. It’s about more than just slapping on a stop-loss; you need to be thinking about how you size every single position before you even think about clicking "buy" or "sell."
You’ll hear the term "market-neutral" thrown around a lot, but a pair trade is only genuinely neutral if it's structured correctly. The foundation of that structure is dollar neutrality.
In simple terms, this means the total dollar value of your long position must be an exact match for the total dollar value of your short position.
This balance is what shields your trade from the wild swings of the broader market. If the entire crypto market suddenly tanks by 20%, a properly dollar-neutral position should, in theory, come out relatively unscathed. The loss on your long leg gets cancelled out by the gain on your short leg.
Let’s walk through a quick example with a hypothetical $10,000 portfolio. Say you decide to risk 2% of your capital on a single trade, which comes out to $200.
This setup ensures that for every dollar you have betting on one side of the pair, you have a dollar betting against the other. Your goal is to profit only from the spread closing, not from one coin randomly outperforming the market.
One of the most common mistakes I see is traders treating all pairs the same. A trade between two stablecoins is a completely different beast than a trade between two highly volatile altcoins. To keep your risk consistent from one trade to the next, you have to adjust your position size based on how volatile each asset is.
A really effective way to do this is with the Average True Range (ATR), a standard indicator that measures market volatility. When you normalize your position size using ATR, you're making sure that a one-ATR move against you results in the same dollar loss, no matter which pair you’re trading.
Here’s how to put that into practice:
Position Size = Risk Per Trade / ATR.For example, if you're risking $200 on a pair where the spread's ATR is $0.50, your total position size would be 400 units (200 / 0.50). You'd then go long 200 units of the undervalued coin and short 200 units of the overvalued one.
This approach stops a single, wild trade from blowing up your portfolio's performance.
Risk management doesn't stop at the individual trade level. You also have to think about your portfolio as a whole. Deciding how many pairs to trade at once and capping your total exposure are absolutely critical for long-term survival.
Spreading yourself too thin can dilute your focus, but putting all your eggs in one or two pairs is asking for trouble if those relationships suddenly break down. I’ve found a balanced approach is to trade somewhere between 3 to 7 uncorrelated pairs at any given time.
You also need a hard limit on your total capital at risk. A good rule of thumb is to never have more than 10% to 15% of your portfolio exposed at any one time. With our $10,000 example, that means your total active positions—long plus short—shouldn't top $1,500.
This hedged, risk-managed approach isn't just theory; it has been shown to work. For example, backtests on a cointegrated pair like ETC vs. FIL have produced an impressive profit factor over 5. The strategy's annualized volatility was just 17.26%, which is remarkably low in the world of crypto.
By combining dollar neutrality, volatility-adjusted sizing, and strict portfolio limits, you're building a robust system designed for sustainable growth, not just a few lucky wins. For a deeper dive into these concepts, check out this complete guide to risk management in trading to really shore up your defenses.
Building a profitable trading system from the ground up takes a serious amount of time and effort. But what if there was a powerful shortcut? Instead of starting from scratch, you can stand on the shoulders of giants by finding and mirroring the moves of elite traders already running successful pair trading strategies.
This approach flips the script. You shift from building to observing. Since the blockchain is a public ledger, every single transaction is recorded and available. By using on-chain analysis tools like Wallet Finder.ai, you can turn this firehose of raw data into actionable intelligence. It's like looking over the shoulder of a top-performing trader in real-time.
The goal here isn't blind copy-trading. It's about finding the "smart money"—wallets that consistently and profitably trade related assets—and then deconstructing their strategy to adapt it for yourself. You're essentially getting a free blueprint of what's working right now.
The first challenge is filtering through the millions of active wallets to find the ones that actually matter. A good on-chain intelligence platform lets you hunt for wallets based on specific performance metrics that signal a sophisticated trader, likely one engaged in statistical arbitrage.
You can set up your search with filters that are the hallmarks of a successful pair trader:
This kind of powerful filtering lets you cut through all the market noise and focus exclusively on wallets that exhibit the behavior of a professional pair trader.
Once you’ve identified a few promising "alpha" wallets, the real power comes from monitoring them in real time. You don’t have to be glued to your screen all day waiting for something to happen. Instead, you can set up automated alerts that notify you the instant a target wallet makes a move.
With a tool like Wallet Finder.ai, you can create a watchlist and configure push notifications or Telegram alerts for specific actions.
Imagine getting an instant alert on your phone: "Wallet 0x123... just sold 50 ETH and bought 850,000 ARB." This isn't just a signal; it's a front-row seat to a pro's execution, allowing you to react quickly and potentially mirror their trade before the opportunity is gone.
This simple setup transforms on-chain analysis from a reactive research tool into a proactive, signal-generation engine. It's the closest you can get to having a mentor tap you on the shoulder right when they're executing a trade.
Mirroring trades is a great start, but the real prize is understanding the why behind the trades. The best on-chain platforms allow you to export a target wallet's entire trading history. This dataset is an absolute goldmine.
By exporting this data to a CSV file, you can run your own offline analysis. You can start to reverse-engineer their strategy by asking key questions:
The platform's dashboard also gives you a high-level view of a trader's performance and recent activity.
This snapshot lets you quickly assess a wallet's profitability, win rate, and most-traded tokens, helping you decide if their strategy is worth a deeper dive.
This whole analytical process gives you a proven blueprint. You get to see the exact parameters that a profitable trader uses, which you can then backtest and adapt to fit your own risk tolerance and capital. You might find they use a Z-score of 1.8 for entry, or a much tighter stop-loss than you had considered.
This method of learning from the best drastically shortens your learning curve. Instead of spending months testing theories that might not work, you can start with a framework that is already proven in live market conditions. It’s a massive edge. If you're looking for more ways to find and track these high-performing traders, our guide on using a smart money tracker offers additional tips and techniques.
Mathematical precision and artificial intelligence fundamentally transform cryptocurrency pair trading by converting subjective relationship assessment into quantifiable cointegration modeling, predictive spread analysis, and systematic opportunity identification that provides measurable advantages in market-neutral trading strategies and statistical arbitrage execution. While traditional pair trading relies on basic correlation analysis and manual spread monitoring, sophisticated mathematical frameworks and machine learning algorithms enable comprehensive cointegration testing, predictive mean reversion modeling, and intelligent pair selection that consistently outperforms conventional pair trading approaches through data-driven relationship analysis and systematic statistical arbitrage.
Professional cryptocurrency pair trading operations increasingly deploy quantitative cointegration assessment systems that analyze multi-dimensional price relationships including statistical stationarity, mean reversion characteristics, correlation stability patterns, and volatility dynamics to optimize pair selection and execution strategies across different market conditions and volatility regimes. Mathematical models process extensive datasets including historical price relationships, correlation evolution patterns, and mean reversion statistics to predict optimal pair trading strategies across various market cycles and relationship stability scenarios. Machine learning systems trained on comprehensive pair trading data can forecast spread behavior, optimize entry and exit timing, and automatically identify high-probability statistical arbitrage opportunities before conventional analysis reveals optimal trading windows.
The integration of statistical modeling with real-time market monitoring creates powerful analytical frameworks that transform reactive pair trading into proactive statistical arbitrage that achieves superior risk-adjusted returns through intelligent relationship analysis and predictive spread behavior modeling.
Advanced statistical techniques analyze cryptocurrency price relationships to identify optimal cointegrated pairs, mean reversion characteristics, and statistical arbitrage opportunities through comprehensive mathematical modeling of price dynamics and relationship stability. Augmented Dickey-Fuller testing combined with Johansen cointegration analysis reveals that cryptocurrency pairs maintaining statistically significant cointegration relationships (p-values <0.05) achieve 70-85% higher mean reversion probability compared to merely correlated assets without stable long-term relationships.
Regression analysis of pair trading performance demonstrates quantifiable relationships between cointegration strength and trading profitability, with statistical frameworks showing that pairs exhibiting strong cointegration coefficients (>0.7) achieve 40-60% better risk-adjusted returns compared to weakly cointegrated pairs through more reliable mean reversion behavior and predictable spread dynamics.
Error correction modeling quantifies mean reversion speed and half-life characteristics for cryptocurrency pairs, enabling optimal position holding time estimation and profit target optimization. Mathematical analysis reveals that pairs with faster mean reversion (half-life <5 days) provide 25-35% more trading opportunities while maintaining superior risk-adjusted performance compared to slowly reverting relationships.
Kalman filtering techniques track dynamic cointegration relationships in real-time, adapting to changing market conditions and structural breaks that might affect pair trading profitability. Statistical models demonstrate that adaptive cointegration monitoring improves trading performance by 30-45% compared to static relationship assumptions through early detection of relationship degradation.
Cross-correlation analysis with time lags identifies optimal lead-lag relationships between cryptocurrency pairs that enable predictive trading strategies and enhanced entry timing based on statistical causality patterns and price discovery mechanisms across different market microstructures.
Comprehensive statistical analysis of cryptocurrency pair spreads enables prediction of optimal trading opportunities through mathematical modeling of spread behavior, volatility clustering, and mean reversion probability. Hidden Markov Models identify distinct spread regimes corresponding to different mean reversion characteristics and trading opportunity profiles, enabling dynamic strategy adaptation based on current spread regime identification.
GARCH modeling of spread volatility reveals optimal position sizing strategies and risk management approaches based on volatility clustering patterns and heteroscedastic behavior in cryptocurrency pair relationships. Mathematical frameworks demonstrate that volatility-adjusted position sizing improves risk-adjusted returns by 20-35% compared to fixed sizing approaches across different spread volatility regimes.
Ornstein-Uhlenbeck process modeling quantifies mean reversion strength and equilibrium levels for cryptocurrency pairs, providing mathematical foundations for optimal entry and exit threshold determination. Statistical analysis shows that process-calibrated thresholds achieve 15-25% better entry accuracy compared to simple standard deviation-based approaches through superior mean reversion parameter estimation.
Jump diffusion models identify extraordinary spread movements and structural breaks that might signal permanent relationship changes requiring immediate position closure and risk management intervention. Mathematical frameworks achieve 80-85% accuracy in distinguishing temporary spread extensions from permanent relationship breakdowns through sophisticated anomaly detection.
Regime-switching models predict optimal trading strategies based on market volatility conditions and spread behavior patterns, with statistical analysis demonstrating that regime-aware strategies achieve superior performance across different market cycles through adaptive parameter optimization and strategic flexibility.
Sophisticated neural network architectures analyze multi-dimensional cryptocurrency pair characteristics including price dynamics, volume patterns, market microstructure, and fundamental relationships to predict optimal pair trading opportunities with accuracy exceeding conventional statistical analysis methods. Random Forest algorithms excel at processing hundreds of pair relationship variables simultaneously, achieving 85-90% accuracy in predicting mean reversion success while identifying high-probability statistical arbitrage opportunities that manual analysis might miss.
Natural Language Processing models analyze cryptocurrency project announcements, development updates, and market sentiment indicators to predict relationship stability and cointegration persistence based on fundamental factor analysis and news impact assessment. These algorithms achieve 80-85% accuracy in predicting relationship breakdowns based on fundamental change detection and sentiment analysis that might affect long-term cointegration.
Long Short-Term Memory networks process sequential spread data to identify temporal patterns in mean reversion behavior, volatility evolution, and optimal trading windows that enable more accurate spread forecasting and entry timing optimization. LSTM models maintain awareness of historical spread patterns while adapting to current market conditions and relationship dynamics.
Support Vector Machine models classify spread conditions as high-probability, moderate-probability, or low-probability trading opportunities based on multi-dimensional analysis of spread characteristics, market conditions, and historical performance patterns. These algorithms achieve 87-92% accuracy in identifying optimal trading conditions that align with statistical arbitrage success criteria.
Ensemble methods combining multiple machine learning approaches provide robust spread prediction that maintains high accuracy across diverse market conditions while reducing individual model biases through consensus-based spread forecasting and opportunity identification systems that adapt to changing market dynamics.
Convolutional neural networks analyze cryptocurrency pair relationship patterns and market structure data as multi-dimensional feature maps that reveal complex relationships between market conditions, pair behavior, and portfolio optimization across different trading strategies and risk management approaches. These architectures identify optimal portfolio construction by recognizing patterns in market data that correlate with superior statistical arbitrage performance and risk management effectiveness.
Recurrent neural networks with attention mechanisms process streaming market data and spread information to provide real-time pair trading portfolio optimization based on continuously evolving market conditions, relationship dynamics, and risk factors. These models maintain memory of historical market patterns while adapting quickly to changes in market structure or relationship stability that might affect optimal portfolio allocation.
Graph neural networks analyze relationships between different cryptocurrency pairs, market factors, and portfolio components to optimize multi-pair trading strategies that account for complex correlation effects and systematic risks. These architectures process pair trading portfolios as interconnected networks revealing optimal allocation approaches and risk management strategies.
Transformer architectures automatically focus on the most relevant market signals and relationship indicators when optimizing pair trading strategies, adapting their analysis based on current market conditions and historical performance patterns to provide optimal portfolio construction recommendations for statistical arbitrage success.
Generative adversarial networks create realistic market scenario simulations and relationship breakdown events for testing pair trading strategies without exposure to actual capital risk during strategy development phases, enabling comprehensive optimization across diverse market conditions and relationship stability scenarios.
Sophisticated algorithmic frameworks integrate mathematical models and machine learning predictions to provide comprehensive automated pair trading execution that optimizes entry timing, position sizing, and risk management based on real-time spread analysis and predictive modeling. These systems continuously monitor spread conditions and automatically execute trades when statistical criteria meet predefined optimization thresholds for maximum probability statistical arbitrage opportunities.
Dynamic hedging algorithms maintain optimal dollar neutrality and risk balance using mathematical models that adapt to changing volatility conditions and correlation dynamics, ensuring market-neutral positioning while maximizing spread capture opportunities. Statistical analysis demonstrates that automated hedging achieves 15-25% better risk-adjusted performance compared to static hedging approaches.
Real-time spread monitoring systems track multiple pair relationships simultaneously to identify optimal trading opportunities and automatically execute trades when spread conditions meet predefined statistical criteria for mean reversion probability and risk-adjusted return potential. Mathematical frameworks enable automatic detection of high-probability opportunities while maintaining strict risk management protocols.
Intelligent position sizing algorithms optimize trade allocation using mathematical models that balance spread opportunity size against volatility risk and portfolio impact, achieving optimal risk-adjusted returns through dynamic sizing that adapts to current market conditions and spread characteristics.
Cross-pair coordination systems optimize trading strategies across multiple pair relationships to achieve optimal portfolio-wide statistical arbitrage while managing correlation risks and systematic vulnerabilities that might affect multiple positions during market stress or structural change periods.
Advanced forecasting models predict optimal pair trading strategies based on market evolution patterns, relationship development trends, and statistical arbitrage opportunity cycles that enable proactive strategy planning and strategic positioning optimization. Market structure analysis enables prediction of optimal pair trading periods based on expected volatility conditions and relationship stability patterns across different market development phases.
Relationship evolution prediction algorithms analyze historical pair development patterns, market maturation indicators, and structural change factors to forecast periods when pair trading opportunities will be favorable for different strategy categories and risk approaches, enabling strategic timing optimization that capitalizes on statistical arbitrage cycles.
Volatility forecasting models integrate market development trends, institutional participation patterns, and regulatory clarity progression to predict optimal pair trading conditions and strategy adaptation requirements over different time horizons and market evolution scenarios.
Structural change impact analysis predicts how market developments, regulatory changes, and institutional adoption will affect cryptocurrency pair relationships and statistical arbitrage opportunities, enabling proactive strategy adaptation based on expected market evolution and relationship stability changes.
Strategic pair trading intelligence coordination integrates individual pair analysis with broader market positioning and statistical arbitrage strategies to create comprehensive trading approaches that adapt to changing market landscapes while maintaining optimal statistical arbitrage performance across various market conditions and relationship evolution phases.
Once you start digging into cryptocurrency pair trading, a bunch of "what if" and "how to" questions inevitably pop up. It's one thing to understand the theory, but it's another to actually put your capital on the line.
Let’s run through some of the most common questions I hear. We'll cover the nitty-gritty of execution, risk, and what to do when your perfect setup starts to go sideways.
Everyone wants a magic number here, but the truth is, there isn't one. While you'll often see +/- 2.0 thrown around as a standard, it's just a starting point. The real answer depends entirely on the personality of the pair you're trading.
For a relatively calm pair—think two liquid staking derivatives that track each other closely—you might find a tighter Z-score like +/- 1.5 gives you more trading opportunities that are still valid. On the flip side, if you're trading two volatile altcoins, you might need to wait for a much wider deviation, maybe +/- 2.5, just to filter out the daily noise and catch a genuine signal.
There's only one way to find out what works for your pair: backtest. Run your historical data through different thresholds (1.5, 2.0, 2.5, etc.) and see which one gave you the best results without taking on a ton of risk.
Shorting is half the game in pair trading, and thankfully, it’s pretty straightforward in DeFi using lending platforms like Aave or Compound. It sounds more complicated than it is.
Imagine you need to short Asset X. Here’s how it works:
Boom. You're now short Asset X. To close the trade, you just do everything in reverse: buy back Asset X (hopefully for cheaper!), and repay your loan on the lending platform. Your profit is whatever is left over.
Technically, yes. You could pair trade something like Solana (SOL) on its native chain with Arbitrum (ARB) on its own network. But I’d strongly advise against it, especially if you're just starting out.
This isn't a simple trade anymore; it's an operational headache. You're suddenly dealing with:
Stick to pairs that live on the same blockchain. Life is so much simpler, and you can focus on the strategy itself rather than fighting the infrastructure.
This is the big one. It's the single most important risk you face in pair trading, often called a "relationship breakdown" or a structural break. This is when the fundamental reason your two assets were cointegrated disappears, and the spread stops mean-reverting. Instead, it just takes off in one direction and never looks back.
This scenario is exactly why you must have a non-negotiable stop-loss. Your strategy needs a kill switch for when a trade goes from a temporary deviation to a permanent breakup.
This could be a hard stop at a maximum Z-score, say 3.0 or 3.5, or even a time-based stop. For example, if the trade hasn't moved back toward the mean within X number of days, you cut it loose, no questions asked. A single broken pair can easily destroy the profits from ten good trades if you don't have this safety net in place.
Augmented Dickey-Fuller testing combined with Johansen cointegration analysis reveals that pairs maintaining statistically significant relationships (p-values <0.05) achieve 70-85% higher mean reversion probability compared to merely correlated assets, with regression analysis showing strong cointegration coefficients (>0.7) achieve 40-60% better risk-adjusted returns through more reliable spread dynamics. Error correction modeling quantifies mean reversion speed enabling optimal holding time estimation, while Kalman filtering tracks dynamic relationships in real-time improving performance by 30-45% compared to static assumptions. GARCH modeling of spread volatility enables volatility-adjusted position sizing improving risk-adjusted returns by 20-35%, with Ornstein-Uhlenbeck process modeling providing mathematical foundations for optimal threshold determination achieving 15-25% better entry accuracy.
Random Forest algorithms processing hundreds of pair relationship variables achieve 85-90% accuracy in predicting mean reversion success while identifying statistical arbitrage opportunities manual analysis might miss. Natural Language Processing models analyzing project announcements achieve 80-85% accuracy in predicting relationship breakdowns based on fundamental change detection, while LSTM networks processing sequential spread data maintain awareness of historical patterns while adapting to current conditions. Support Vector Machine models achieve 87-92% accuracy in identifying optimal trading conditions aligning with statistical arbitrage success criteria, with ensemble methods combining approaches providing robust prediction maintaining high accuracy across diverse market conditions through consensus-based forecasting systems.
Dynamic hedging algorithms maintain optimal dollar neutrality using mathematical models adapting to changing volatility and correlation dynamics, achieving 15-25% better risk-adjusted performance compared to static approaches while ensuring market-neutral positioning. Real-time spread monitoring tracks multiple relationships to identify opportunities and automatically execute when conditions meet statistical criteria, with intelligent position sizing optimizing allocation using models balancing opportunity size against volatility risk. Cross-pair coordination optimizes strategies across multiple relationships to achieve portfolio-wide statistical arbitrage while managing correlation risks, with automated execution systems continuously monitoring spread conditions and executing trades when criteria meet predefined optimization thresholds for maximum probability opportunities.
Market structure analysis enables prediction of optimal pair trading periods based on expected volatility conditions and relationship stability patterns across different market development phases, with relationship evolution algorithms analyzing historical development patterns to forecast favorable periods for different strategy categories. Volatility forecasting integrates market development trends and institutional participation to predict optimal trading conditions over different horizons, while structural change impact analysis predicts how market developments will affect pair relationships enabling proactive strategy adaptation. Strategic intelligence coordination integrates individual pair analysis with broader market positioning to create comprehensive approaches adapting to changing landscapes while maintaining optimal statistical arbitrage performance across various market conditions and relationship evolution phases.
Ready to stop guessing and start learning from the pros? Wallet Finder.ai gives you the on-chain intelligence to discover top-performing wallets, see their exact pair trading strategies, and get real-time alerts on their moves. Find your edge at https://www.walletfinder.ai.

A premier DeFi analytics platform empowering traders to discover and analyze profitable blockchain wallets, trades and tokens.

