
Recovery Factor Calculation for Smart Traders
Master the recovery factor calculation to measure a strategy's resilience. Learn the formula, see DeFi examples, and find top wallets with Wallet Finder.ai.

June 20, 2026


Wallet Finder
February 15, 2026
The Dogelon Mars price is a rollercoaster. Like many memecoins, its extreme volatility creates a playground of high-risk, high-reward moments for traders who know where to look. While most people are watching charts and reacting to market sentiment, the real alpha is often buried in on-chain data—revealing what smart money is doing before the crowd catches on.
This guide provides actionable strategies to navigate ELON's price action by tracking on-chain signals and learning from profitable traders.
New to Dogelon Mars? Here's your fast-track guide to trading ELON without getting wrecked:
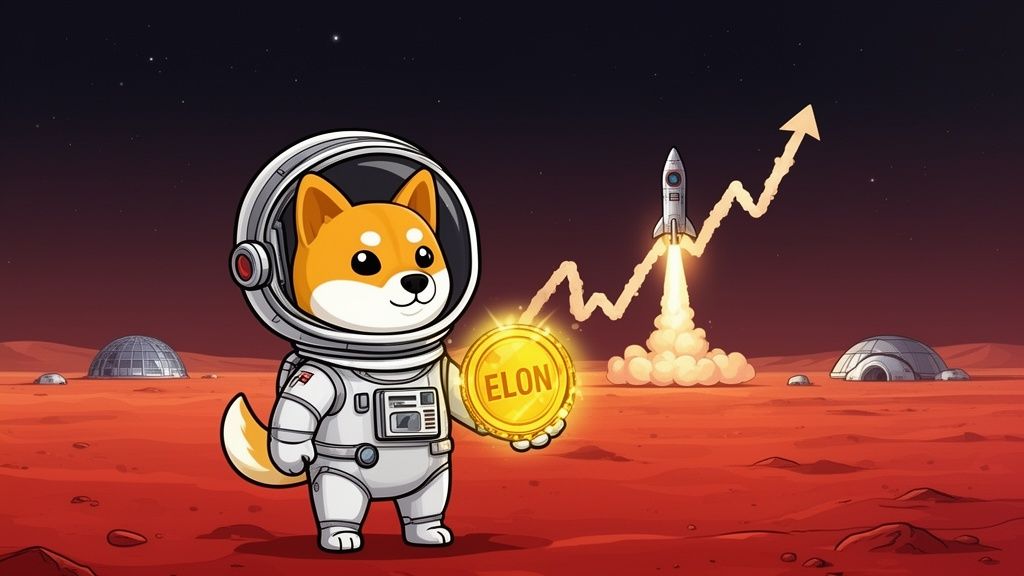
Dogelon Mars (ELON) is a classic memecoin, blending the viral appeal of Dogecoin with the space-faring ambitions of Elon Musk. It launched in April 2021 as an ERC-20 token on the Ethereum and Polygon networks, placing it in the heart of DeFi's busiest highways.
Unlike a stock, ELON's value isn't backed by company profits or physical assets. Its price is a pure reflection of:
Think of it less like a blue-chip investment and more like a high-speed vehicle; its direction can flip in a heartbeat. That’s why getting a handle on its key market vitals is non-negotiable if you plan to trade it.
Price charts show you what happened. Understanding why it happened is what separates profitable traders from bagholders.
ELON doesn't move on fundamentals. It moves on attention. The cycle is predictable once you know what to watch for.
What it looks like: A few influencers with 10K-50K followers start mentioning ELON. Reddit posts get 50-200 upvotes instead of the usual 10-20.
Price action: Slowly grinds up 5-15% over 3-7 days on slightly elevated volume.
What smart money does: Accumulates positions during this phase. They're buying before the crowd arrives.
Your move: If you catch this early through wallet tracking (seeing multiple profitable wallets buying), this is your entry window. You're getting in with smart money, not chasing them.
What it looks like: Major crypto influencers (100K+ followers) start posting. "#ELON" trends on X. Reddit posts hit frontpage with 2K+ upvotes.
Price action: Parabolic move up 50-200% in 24-72 hours. Volume spikes 300-800% above average.
What smart money does: Starts distributing their bags into the buying frenzy. They're selling to you.
Your move: If you're already in from Phase 1, take profits aggressively. Sell 50-75% of your position into the spike. If you're not in yet, stay out. Chasing parabolic moves is how you become a bagholder.
What it looks like: Hype dies down. Influencers stop posting. Reddit activity drops to normal levels.
Price action: Sharp 40-70% correction over 3-10 days. Volume collapses back to baseline.
What smart money does: They're already out. Wallets show they sold days ago.
Your move: If you're still holding, sell. Don't wait for the "recovery." The next pump cycle might be weeks or months away.
ELON doesn't trade in a vacuum. It's tethered to Bitcoin's movements with a lag effect.
The pattern:
Why this happens: Risk appetite. When Bitcoin rises, traders feel confident and rotate into higher-risk assets like memecoins. When Bitcoin falls, panic selling hits memecoins first and hardest.
Trading strategy: Watch Bitcoin's 4-hour chart. If BTC breaks major resistance (like $95K or $100K), ELON will likely pump within 24 hours. If BTC breaks support, ELON will crash before you can react.
Advanced tactic: Use Bitcoin futures funding rates as an early indicator. When BTC funding rate goes from negative to positive (shorts paying longs), it signals bullish sentiment shift. ELON usually follows within 12-24 hours.
Social media and Bitcoin correlation are important, but on-chain data is the closest thing to "insider information" that's completely legal and public.
What to monitor: Wallets moving 1 billion+ ELON tokens to exchange deposit addresses.
How to track: Use Etherscan or Wallet Finder.ai to set alerts for large transfers to Binance, KuCoin, or Gate.io hot wallets.
What it means: Someone's preparing to sell. Big deposits almost always precede price drops within 12-48 hours.
Historical example: On October 15, 2021, a whale deposited 2.3 trillion ELON to KuCoin. Price dropped 35% within 24 hours.
Your action: If you see 3+ whale deposits within 24 hours, exit your position immediately or tighten stop-losses to 5% below current price.
What to monitor: Large ELON withdrawals from exchanges to private wallets.
What it means: Accumulation. Traders moving tokens off exchanges are planning to hold, reducing selling pressure.
Bullish threshold: When exchange outflows exceed inflows by 20%+ for 3+ consecutive days.
Your action: This is a buy signal if you're looking for entry. Accumulation periods often precede 30-100% pumps within 2-4 weeks.
What to monitor: Are top wallets increasing or decreasing their holdings?
How to check: Etherscan's token holder page shows top 100 addresses. Check weekly if their holdings are growing or shrinking.
Bullish sign: Top 20-50 wallets (excluding exchanges) increasing holdings by 5%+ in a week.
Bearish sign: Top 20-50 wallets decreasing holdings by 10%+ in a week.
Why this matters: These are the market makers. When they accumulate, they're positioning for a pump. When they distribute, they know something you don't.
Not all times are equal for trading ELON. There are specific market conditions where memecoins absolutely explode, and times when they go to sleep for months.
Your strategy: When these align, ELON typically pumps 100-300% within 2-6 weeks. This is when you want to be positioned.
Your strategy: Exit any ELON positions within 48 hours when you see these signals converging. The next memecoin season might be 3-6 months away.
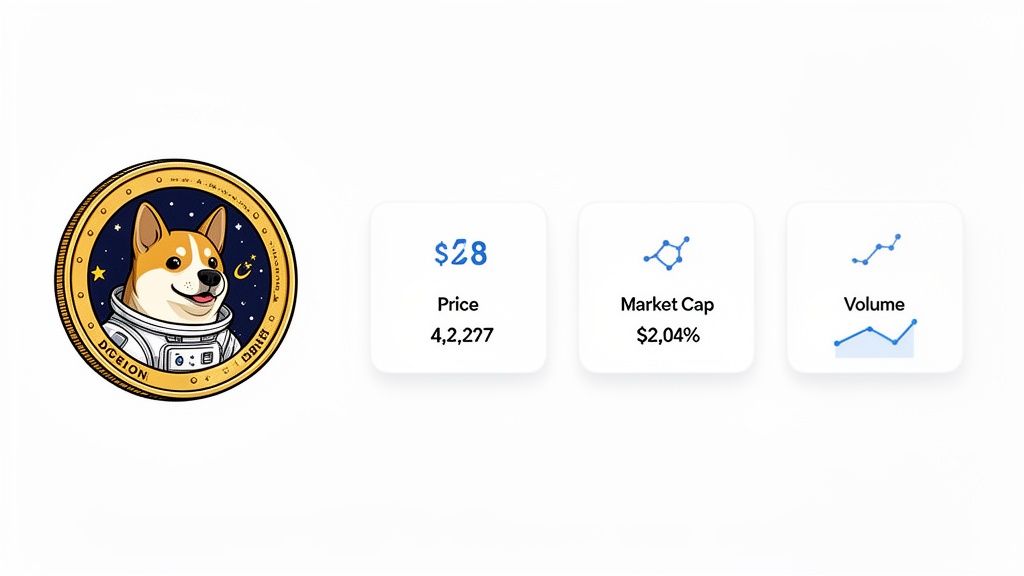
To get a quick read on the Dogelon Mars price right now, you need to glance at a few core metrics. This snapshot shows where ELON stands in the market.
Current Value: ~$0.00000015
What It Tells You: The current cost per token. This changes every second based on active trading.
Current Value: ~$83 Million
What It Tells You: The total value of all circulating ELON. Shows the project's overall size compared to other cryptocurrencies.
Current Value: ~$2.1 Million
What It Tells You: Measures current trader interest and liquidity. Higher volume means easier to buy or sell without affecting price.
Current Value: ~549 Trillion ELON
What It Tells You: The number of tokens available to trade. With such a massive supply, even small price increases require huge capital inflows.
Note: These values are constantly shifting with market activity.
These numbers tell a story. The market cap gives you a sense of its overall size, but the trading volume is where the action is. A spike in volume can be a heads-up that a major price move is either happening or just around the corner.
The real map to navigating ELON's price swings isn't just in the charts—it's in the on-chain data. Watching the moves of profitable wallets gives you a powerful leading indicator of where the market might be heading next.
While general sentiment is what gets memecoins moving, profitable traders always dig deeper. To learn more about how market mood affects assets like ELON, you can check out our guide on crypto market sentiment analysis.
This is exactly where tools like Wallet Finder.ai come in. They're designed to cut through the noise, letting you see what the most successful wallets are buying or selling—giving you a chance to mirror their strategies before they become yesterday's news.
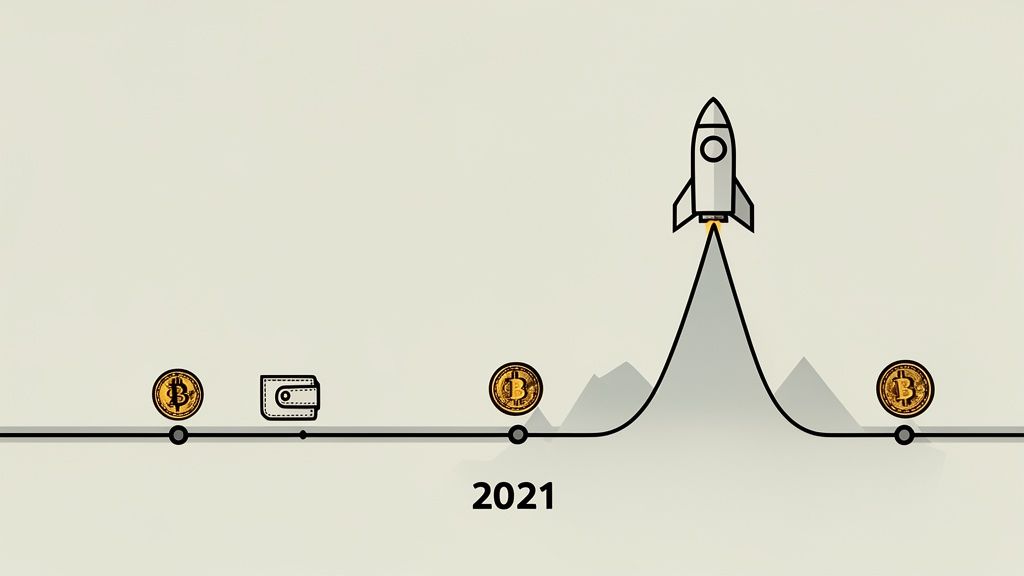
To really get a feel for the Dogelon Mars price today, you have to look back at its absolutely wild history. Like a lot of tokens that exploded onto the scene during the 2021 memecoin mania, ELON's chart tells a story of massive pumps, brutal corrections, and the kind of volatility that changes lives overnight. This isn't just old data; it's a perfect case study in market psychology and the art of timing.
ELON first appeared on April 23, 2021, and its debut was pure drama. The price action was fueled by a perfect storm of social media hype and pure speculative fever. In a single day on May 11, 2021, the token skyrocketed by an insane 201.33%, creating small fortunes for anyone who got in early.
But this is memecoin land, so what goes up must come down. The very next day brought a gut-wrenching -75.33% crash, the token's single worst day on record. This rollercoaster got even crazier when Ethereum's own Vitalik Buterin donated 430 billion ELON to the Methuselah Foundation, which triggered massive sell pressure. Even with that dump, traders who had bought in at sub-$0.000001 levels were already sitting on returns of over 1,000%.
History doesn't repeat, but it rhymes. ELON has shown specific patterns that, once you recognize them, give you a massive edge.
ELON follows a remarkably consistent pattern that plays out over weeks to months.
Price behavior: Trading in tight 10-15% range. Low volume (under $2M daily). Boring, sideways action.
What's happening: Smart money is quietly accumulating. They're buying slowly to avoid moving the price.
How to identify:
Historical examples:
Trading strategy: This is your buying zone. Accumulate positions using limit orders below current price. Set alerts for volume increase.
Price behavior: Parabolic vertical move. 100-300% gain in under 2 weeks. Volume explodes 500-1000%.
What's happening: FOMO kicks in. Retail floods in buying market orders. Smart money starts distributing into strength.
How to identify:
Historical examples:
Trading strategy: If you bought during accumulation, start selling. Take profits in tranches:
If you're not in yet, don't chase. Wait for the inevitable correction.
Price behavior: Sharp reversal. 50-80% drop from peak. Volume stays elevated initially, then collapses.
What's happening: Smart money is out. Late buyers panic sell. Price finds new bottom 60-70% below peak.
How to identify:
Historical examples:
Trading strategy: Stay out completely. Don't try to "buy the dip" early. Wait for price to stabilize and volume to normalize (4-6 weeks minimum) before considering re-entry.
Not every upward move is the start of a pump cycle. Failed pumps are common and destroy traders who don't recognize them.
Price action: 20-40% spike in 1-2 days, then immediate reversal below starting point.
Volume pattern: Volume spikes briefly but doesn't sustain. Returns to baseline within 48 hours.
Social media: Minimal engagement. No major influencers involved. Feels forced, not organic.
Whale activity: No corresponding on-chain accumulation. Wallets aren't buying the pump.
Example: February 2023 - Price pumped 35% in one day on announcement of "community initiative," then dropped 50% over next week. Total scam.
How to avoid:
This "boom-and-bust" pattern is practically baked into the DNA of most memecoins. A pump usually gets started by a few key ingredients that create a feedback loop of excitement and pure FOMO.
The key takeaway isn't just that ELON is volatile—it's that this volatility created very clear winners and losers. The winners were the ones who saw the signals and acted decisively. The losers either held on for too long or bought the top.
So, how do you make sure you're on the winning side? The answer is in the data. You have to find the patterns of those who have successfully ridden these waves before. Understanding the history of memecoin performance is everything, as we explored in our study on the price trends of 100 meme tokens.
Going back through the Dogelon Mars price chart isn't just an academic exercise. It's about building a blueprint for your future trades. The wallets that bought ELON before it went vertical and sold near the top left a permanent, traceable footprint right on the blockchain.
This is exactly where a tool like Wallet Finder.ai becomes your secret weapon. It lets you cut through all the noise and find those exact wallets. You can dig into their entire trading history, see precisely when they bought and sold their ELON, and start to piece together the strategy that led to those eye-watering profits.
By finding and tracking these smart money players, you turn a simple price chart into an actionable intelligence report. Instead of just guessing where the market is going, you can start following the footsteps of traders who have already proven they know how to call the next move.
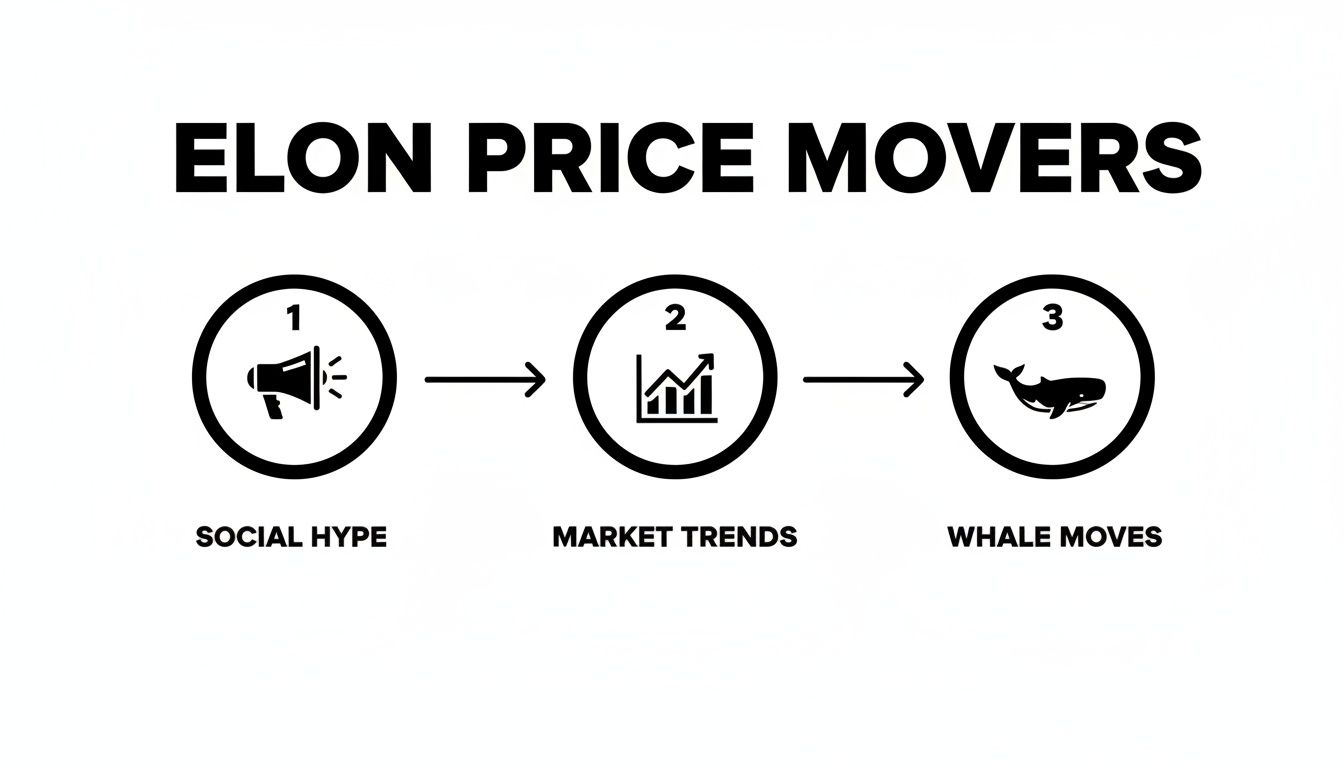
So, what really makes the Dogelon Mars price jump or tank?
If you only watch the daily charts, you’re just seeing the aftermath. The real story is in the hidden forces that kick off those big moves in the first place. Knowing what they are is the difference between blindly reacting to price action and actually getting ahead of it.
The most obvious driver is pure social media chaos. Platforms like X (formerly Twitter) and Reddit are rocket fuel for memecoins. All it takes is a single post from a major influencer or a coordinated buying spree from the community to send thousands of new traders piling in. This is what creates those insane, short-lived pumps. For ELON, this community buzz is its lifeblood.
But ELON isn't an island. It’s tightly tethered to the weather of the wider crypto market. When we’re in the middle of a “memecoin season”—those wild periods of pure speculative greed—a rising tide of optimism lifts all boats, ELON included.
On the flip side, when Bitcoin takes a nosedive, its gravitational pull tends to drag down altcoins like ELON with it, no matter how much hype the community is generating.
Look past the social media noise and market trends, and you’ll find the on-chain signals—the digital breadcrumbs left by every single transaction. These clues often signal huge price swings before they ever show up on a chart. Think of it like seeing storm clouds gathering on the horizon long before you feel the first drop of rain.
Here are the critical on-chain metrics you absolutely need to be watching:
Watching these on-chain metrics is like having insider information that’s completely public—if you know where to look. It’s your window into what the "smart money" is doing right now.
This is exactly why data tools are no longer optional for serious traders. Instead of trying to piece this all together yourself by digging through blockchain explorers, a platform like Wallet Finder.ai does the heavy lifting for you.
It automates the process, letting you track these hidden currents in real time and even sending you an alert when a big, profitable whale makes a move. It gives you the chance to act on the same intel the pros use, letting you get positioned before the rest of the market even knows what’s happening.
Trying to make sense of on-chain data can feel like you’re staring at the Matrix. It’s complicated. But a few modern tools have made it shockingly simple to see what the pros are doing. Instead of just reacting to the Dogelon Mars price after it spikes, you can now follow the wallets that consistently make the right calls.
This part of the guide is all hands-on. We'll walk through exactly how to use Wallet Finder.ai to find these profitable traders, mirror what they do, and get alerted the second they make a move.
Think of it this way: you want to find the best fishing spots in a huge ocean. You could spend all day guessing, or you could find the handful of fishing boats that always come back with a massive catch and just follow them. Wallet Finder is your GPS for finding those expert "fishermen" in the crypto sea.
The whole point is to build a simple, repeatable process: find the best traders, check their track record, follow them, and get an instant heads-up when they buy or sell. This approach transforms confusing on-chain data into a straightforward, actionable signal.
This table breaks down the workflow.
StepActionGoal1. DiscoverGo to the "Discover Wallets" feature and filter for the ELON token.Get a clean list of every wallet that has traded Dogelon Mars. This is your starting pool of potential smart money.2. AnalyzeSort that list by key metrics like Total PnL (Profit and Loss), Win Rate, and Average ROI.Pinpoint the most consistently profitable traders and filter out all the noise from struggling or breakeven wallets.3. FollowFound a wallet you like? Add it to your personal watchlist inside the platform with a single click.Build a curated dashboard of elite ELON traders you want to keep a close eye on.4. AlertSet up real-time notifications for your watchlist through Telegram or push notifications.Get an immediate alert the moment a wallet you're tracking buys or sells ELON, so you can act instantly.
Following a system like this takes the emotion and guesswork completely out of the equation. You're no longer chasing pumps after they've already happened; you're getting a front-row seat to the moves that kick them off. To go even deeper on this strategy, check out our guide on using a smart money tracker.
The "Discover Wallets" page is your mission control. This is where you can dial in specific filters to find exactly what you're looking for. For instance, you could set a minimum profit of $10,000, require a win rate above 75%, and specify that you only want to see wallets that have traded ELON in the last week.
The real magic here is seeing—in seconds—which wallets have made the most money trading a specific token. It gives you a clear, data-backed starting point for your research.
Once your list is filtered, you can click into any wallet to see its entire trading history. I’m talking every single buy and sell, the exact entry and exit prices, and the final PnL for each trade. It’s like getting a transparent blueprint of a winning strategy that you can learn from or even replicate.
By setting up alerts, you get the signal you need right when it matters most. An alert telling you that a top ELON trader just made a huge buy is an incredibly powerful, data-driven indicator that something might be brewing with the Dogelon Mars price.
Daily charts are just noise. If you want to understand the Dogelon Mars price, you have to zoom out and look at the bigger picture. Its long-term performance is a classic memecoin saga, filled with unbelievable highs, crushing lows, and long, quiet periods where nothing seems to happen. Getting a handle on this journey is crucial if you're holding ELON or just looking for a smart entry point.
The life of a memecoin is usually short and violent. Most just flare up and die after the initial hype. But every so often, a few show a stubborn refusal to fade away. So far, Dogelon Mars has managed to survive multiple market cycles, which already puts it in a different league than the thousands of failed projects out there. This kind of staying power usually comes down to one thing: a die-hard community that keeps the story alive, even through the worst crypto winters.
The long-term chart for Dogelon Mars tells a wild story of volatility. It kicked off on April 23, 2021, at a price of roughly $0.000000048 and hit its all-time low of $0.000000017563 not long after. But the real story is the aftermath of its peak; ELON is still languishing over 95.2% below its all-time high of $0.00000259, set way back on October 30, 2021. You can dig into the full history yourself to get more context on the Dogelon Mars token performance.
That massive drop is a painful but important lesson. It shows just how risky it is to buy into the hype at the top and proves why you always need an exit plan. For anyone who held on, it's been a true test of faith. For new traders, it might look like a chance to get in at a massive discount—assuming the project can ever grab the market's attention again.
To get a real sense of its long-term potential, you have to compare ELON's performance to the big dogs like Bitcoin (BTC) and Ethereum (ETH). When the market turns bearish or goes sideways, memecoins like Dogelon Mars almost always get hit harder than the majors. That’s because when fear kicks in, money flees from high-risk assets and rushes into more established, "safer" coins.
This predictable pattern teaches a few key lessons about managing your portfolio:
A memecoin’s survival across multiple cycles really boils down to its narrative and community. Thousands of them vanish, but the ones that stick around often become cultural icons in the crypto world.
At the end of the day, a long-term view on the Dogelon Mars price demands perspective. It's a high-risk, speculative bet whose future depends entirely on community buzz and the overall health of the crypto market. Pro traders know this and use powerful tools to get ahead. By exporting historical on-chain data from platforms like Wallet Finder.ai, they can see how holders behaved in the past to predict how the market might react to future events. It's how they turn old data into a forward-looking advantage.
Basic buy-low-sell-high doesn't cut it with ELON. You need specific tactics for this level of volatility.
Setup: Price has crashed 60-80% from recent high and is consolidating for 4+ weeks.
Entry rules:
Exit rules:
Win rate: 55-65% (many attempts fail, but winners pay for losers)
Average return: 35-50% on winners, -10% on losers
Time in trade: 3-8 weeks typically
Setup: Multiple profitable wallets (tracked via Wallet Finder.ai) start accumulating ELON simultaneously.
Entry rules:
Exit rules:
Win rate: 70-80% (following proven winners is powerful)
Average return: 50-120% on winners, -12% on losers
Time in trade: 1-4 weeks
Setup: Bitcoin breaks major resistance level ($95K, $100K, etc.) on high volume.
Entry rules:
Exit rules:
Win rate: 50-60% (correlation isn't perfect)
Average return: 40-80% on winners, -15% on losers
Time in trade: 1-3 days (very short-term)
Setup: ELON pumps 20-40% in single day on no clear catalyst.
Entry rules (short bias):
Exit rules:
Win rate: 65-75% (most unexplained pumps are manipulation)
Average return: 25-35% on winners, -18% on losers
Note: This requires ability to short, available on some CEXes with margin trading
Regardless of strategy:
Position Sizing:
Stop Losses:
Profit Taking:
Emotional Discipline:
Honest answer: Anyone giving you a specific price target for ELON in 2026 is guessing. Most "prediction" sites show ranges from $0.0000002 to $0.0000006, but these are algorithmic extrapolations with no real analytical basis.
What actually matters isn't the price target—it's understanding the patterns that create price movement:
Bullish scenario: If we enter a full memecoin season in 2026 with renewed retail interest, ELON could 3-5x from current levels during pump phases. This has happened in every previous bull cycle.
Bearish scenario: If crypto enters bear market or memecoin attention dies out, ELON could trade sideways or down 30-50% for extended periods.
The smarter approach: Instead of fixating on price predictions, track the factors that actually drive price: whale accumulation, social media momentum, Bitcoin correlation, and memecoin season indicators. These tell you when to be in or out, which matters more than any 12-month price guess.
There are specific, observable signals that precede most ELON pumps:
Signal 1: Whale Accumulation Pattern
Signal 2: Exchange Withdrawal Trend
Signal 3: Volume Divergence
Signal 4: Social Media Early Buzz
Signal 5: Bitcoin Momentum Shift
Best practice: Use Wallet Finder.ai to track 10-15 historically profitable ELON wallets. Set alerts for their buying activity. When 3+ of these wallets buy within 72 hours, it's your strongest signal.
The answer depends entirely on where we are in the pump-dump cycle and current market conditions.
Good times to buy:
Bad times to buy:
How to check right now:
If answers are mostly bullish, consider small position with stop-loss. If mostly bearish, wait.
ELON is available on both centralized and decentralized exchanges. Your choice depends on your priorities.
For beginners (Centralized Exchanges):
KuCoin
Gate.io
Crypto.com
For experienced traders (Decentralized Exchanges):
Uniswap (Ethereum)
QuickSwap (Polygon)
Pro tip: Check prices across multiple platforms before buying. Sometimes DEX prices are 2-5% different from CEX prices due to arbitrage delays. Buy where it's cheapest.
Knowing when to exit is more important than knowing when to enter. Here are concrete sell signals:
Immediate sell signals (exit within hours):
Sell within 1-3 days signals:
Plan your exit before you buy:Set predetermined profit targets:
Never "hope" for more gains without a concrete exit plan. Hope is not a strategy.
Let's do the math:
Current price: ~$0.00000015Target price: $0.001Required gain: 666,567% (6,666x)
Current market cap: ~$83 millionMarket cap at $0.001: $554 billion
Reality check: That would make ELON worth more than:
Is it possible? Technically yes. Mathematically no.
Why it won't happen:
What's actually realistic:
Trade ELON for what it is: a speculation vehicle for 50-300% swings, not a retirement plan.
Manipulation is rampant in low-liquidity memecoins like ELON. Here's exactly how it works:
Tactic 1: Wash Trading
How to detect: Check if large trades happen between wallets funded from same source address.
Tactic 2: Spoofing
How to detect: Watch order book closely. Large orders that appear and disappear without filling are spoofs.
Tactic 3: Coordinated Pump
How to detect: Check if pump coincides with whale exchange deposits. If whales depositing during pump, they're preparing exit.
Tactic 4: Slow Grind Accumulation then Fast Dump
How to protect yourself:
Stop guessing and start tracking. With Wallet Finder.ai, you can discover the most profitable ELON traders and get real-time alerts when they make a move. Find your edge and start your free trial today.

A premier DeFi analytics platform empowering traders to discover and analyze profitable blockchain wallets, trades and tokens.

