
Recovery Factor Calculation for Smart Traders
Master the recovery factor calculation to measure a strategy's resilience. Learn the formula, see DeFi examples, and find top wallets with Wallet Finder.ai.

June 20, 2026


Wallet Finder
March 31, 2026

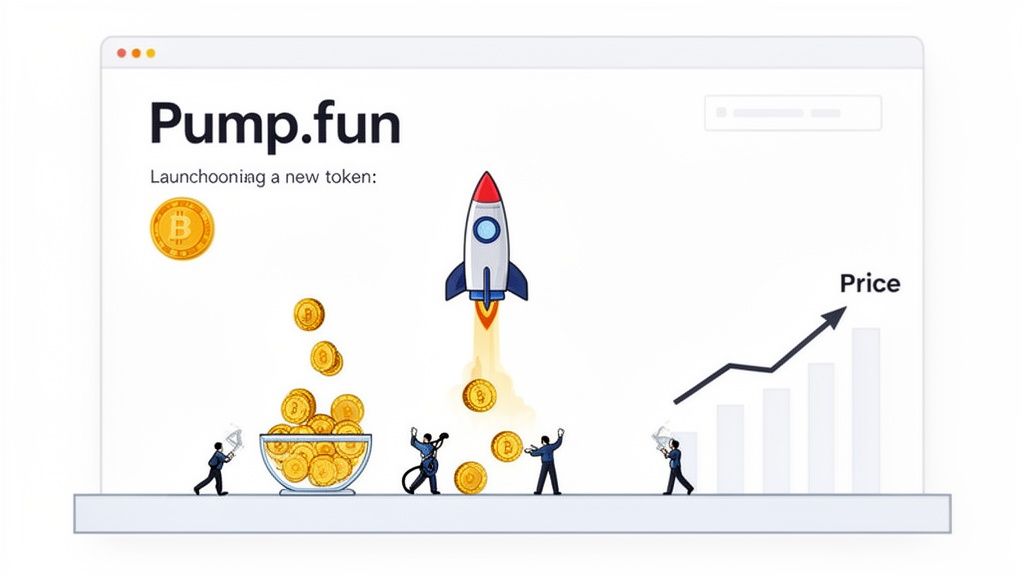
Pump.fun has become the wild west of token launches, especially for memecoins on Solana. It’s a platform that lets anyone instantly create and trade a new token with almost no starting cash.
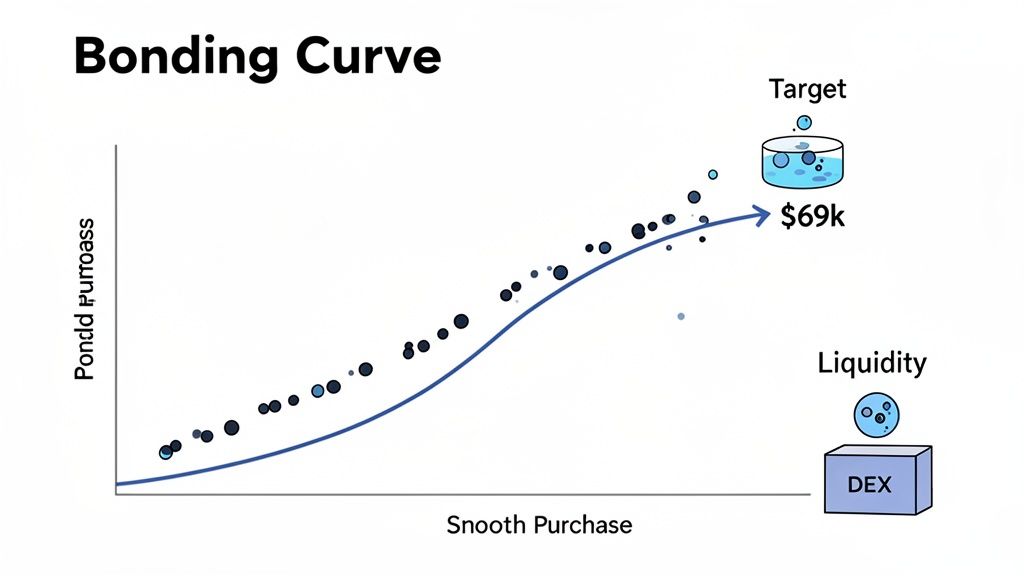
The whole system is built around something called a ‘bonding curve.’ This basically means the token's price goes up automatically every time someone buys it, at least until it hits a specific market cap. Once it does, the token "graduates" and can be traded freely on a major exchange.
Think of Pump.fun as a launchpad that strips away all the usual technical headaches and high costs of launching a new crypto coin. You don't need to be a coding wizard or have a huge pile of money for initial liquidity. Instead, you can get a new token live in minutes for a tiny fee.
The platform's entire model gamifies the launch process. It uses a bonding curve, which is like an automated presale where the price isn't fixed. It algorithmically climbs as more people buy in, creating a rush where the earliest buyers get the best prices.
Every token born on Pump.fun follows a set, automated journey. When a coin is first created, it only exists on the Pump.fun site. People can buy and sell it right there, and each purchase nudges its market cap higher along that bonding curve.
This continues until the token hits a critical milestone: a market cap of about $69,000. Hitting this target automatically triggers the platform’s smart contract to do something important. It takes a chunk of the money raised and uses it to create a liquidity pool on a big Solana-based decentralized exchange (DEX) like Raydium.
At that point, the token has officially made it. It's no longer just a Pump.fun project; it’s a full-fledged tradable asset on the open market.
This diagram breaks down the simple three-step flow from launch to the open market.
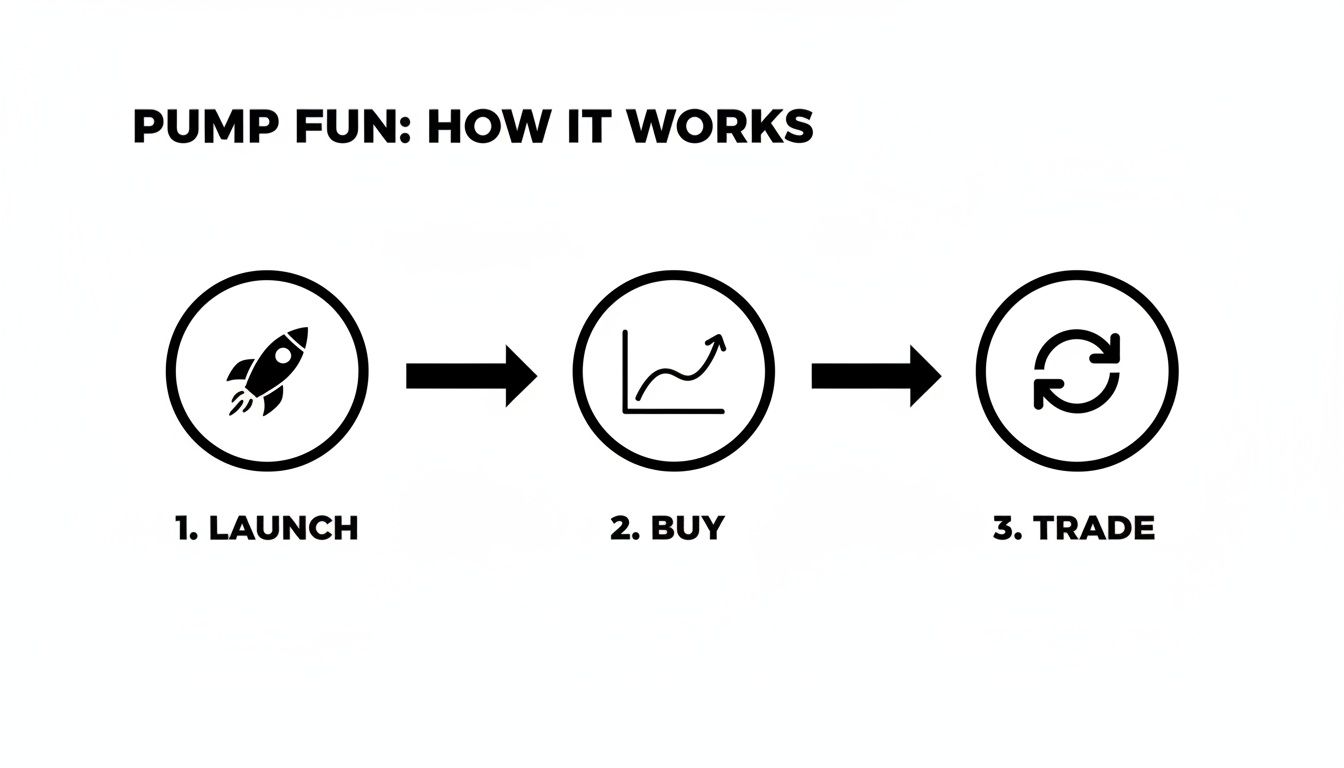
The visualization shows how a token goes from launch, through the bonding curve buying frenzy, and finally lands on a major exchange. For traders, the key is knowing which stage a token is in, because the risks and rules of the game change completely. You can dive deeper into how to analyze the factors that influence a pump coin price in our detailed guide.
The magic of Pump.fun is that it uses the buyers' own demand to fund the token's initial liquidity. This clever trick removes a massive hurdle for creators and fuels the lightning-fast launches the platform is famous for.
To really get how Pump.fun operates, you need to understand the lifecycle of a token on the platform. Each phase serves a specific purpose, from its creation to its debut on the open market. This journey is the first thing you have to master to navigate this high-speed environment.
The table below breaks down this entire journey from start to finish.
From creation to open trading, this four-stage process is what defines every token on Pump.fun. Understanding this flow is essential for spotting opportunities and managing the extreme risks involved.
So, how does Pump.fun actually work? To get a real grip on it, you have to look past the memes and see the clever engine running underneath. The whole platform is basically a high-speed assembly line for creating and trading tokens instantly.
At the heart of every single launch is a mechanism called a bonding curve. The easiest way to think of it is like an automated Kickstarter campaign that prices itself in real-time. As people buy in, the price automatically goes up for the next person.
This solves one of the biggest headaches for new tokens: liquidity. The platform cleverly uses the money from the first wave of buyers to create the token's future liquidity pool on a decentralized exchange. It’s a self-funding system that makes these rapid-fire launches possible.
Picture a Kickstarter, but with a twist. Every new person who backs the project has to pay a little more than the person before them. That’s the essence of a Pump.fun bonding curve, and it creates a powerful incentive to get in early.
Here is an actionable breakdown of the process:
This entire sequence is hands-off and automated by the smart contract. But that same automation is what makes it a perfect playground for manipulators. Knowing how to analyze meme token liquidity pools is one of your best defenses against getting caught in a bad spot.
The mechanics are one thing, but the real secret sauce is psychology. The platform is engineered to feel less like investing and more like a high-stakes video game, tapping into some powerful emotional triggers.
The most dangerous aspect of a Pump.fun launch isn't the code; it's the emotional response it triggers. The gamified interface, constantly updating price, and social proof from other buyers combine to create a perfect storm of FOMO (Fear Of Missing Out).
It's an environment that breeds impulsive decisions. Watching a token’s market cap jump from a few hundred bucks to tens of thousands in minutes is intoxicating. You feel like you're part of something big and moving fast, which makes it incredibly hard to think objectively.
The bonding curve is a brilliant piece of financial engineering, but its biggest strengths are also its most glaring weaknesses. You absolutely have to understand both sides before you even think about jumping in.
At the end of the day, understanding how does pump fun work means realizing the platform is just a tool. It can launch a fun, community-driven memecoin or a vicious pump-and-dump. Your ability to spot the difference comes down to solid analysis and keeping your emotions in check.
While the Pump.fun interface feels like a fast-paced video game, the real story unfolds on the blockchain. Learning to read these on-chain signals is your best defense against getting absolutely wrecked. It’s what separates blind gambling from making a calculated trade based on solid data.
The key is to ignore the social media noise and focus on the cold, hard facts recorded on the Solana ledger. Every single buy, sell, and wallet action tells a story. Your job is to learn how to read that story faster and more accurately than the rest of the market.
This is where you build a real edge. By digging into on-chain data, you can spot the obvious signs of a setup or, on the flip side, the early indicators of a genuine community-driven token long before it hits the mainstream radar.
The first few minutes of a token’s life are everything. One of the first things you absolutely must check is the initial buyer distribution. Are the first dozen buys from different, random wallets? Or are they all linked back to a single person or group?
An actionable checklist for analyzing initial buyers:
A massive red flag is when a huge chunk of the initial supply is snapped up by one wallet or a small, coordinated cluster. This insider can single-handedly tank the price later when they decide to dump.
A sneakier, but just as dangerous, red flag is wallet clustering. This is a classic move where one operator uses dozens or even hundreds of wallets to make a launch look way more popular than it actually is. These wallets are almost always funded from a central "mother" wallet.
On-chain analysis tools make these connections easy to spot. If you see a spiderweb of new wallets, all funded with the exact same tiny amount of SOL from a single source, and they all pile into the same token at launch—you're looking at a coordinated scheme.
The point of wallet clustering is to fake concentrated ownership and create false social proof. By making it look like hundreds of people are aping in, manipulators lure in real investors who then become their exit liquidity.
This isn't just theory; academic research backs it up. Studies on crypto pump-and-dump schemes show they create dramatic, short-lived spikes in price and volume, followed by an immediate and brutal crash. Wallet-level data reveals a clear transfer of wealth from retail traders to insiders, who often drive up the price before the public "pump" even begins.
When you're sizing up a new Pump.fun token, speed is critical. Use this checklist to quickly decide if a project has potential or is just a well-disguised trap. One red flag should make you hesitate; multiple red flags mean you should run.
At the end of the day, spotting these signals is only half the battle. You have to act on them decisively. Getting a handle on these patterns is essential for anyone trying to navigate the chaos of Pump.fun. For a more detailed guide on spotting malicious tokens, check out our guide on how to rug check crypto projects.
Alright, theory is great, but putting it into practice in real-time is how you actually get an edge in the crypto space. This is where you graduate from just spotting red flags to using a dedicated tool like Wallet Finder.ai to turn all that raw data into something you can act on.
Instead of trying to manually connect the dots between wallet activities, you can use a single platform to spot momentum, size up the top holders, and check their trading history.
The whole game boils down to a workflow that answers the most important questions about any new Pump.fun token. Is the hype real? Are the first buyers legit traders or just setting up a rug pull? And ultimately, is this a train you want to jump on, or is it about to go off the rails?
This guide will show you exactly how to use Wallet Finder.ai to make these calls with data, not just emotion. Let's dive in.
First things first, you need to find tokens that are just starting to pop. The sheer speed of Pump.fun makes it impossible to manually track every new coin. That’s what the 'Discover Tokens' feature in Wallet Finder.ai is built for—it flags new tokens on Solana that are showing serious early traction.
This dashboard gives you a bird's-eye view of what’s heating up. You’ll see tokens with a growing number of buyers, rising market caps, and significant price moves in short windows. Instead of blindly scrolling through Pump.fun, you get a curated list of tokens already showing signs of life.
Here’s a quick way to put it to work:
Think of this as your first filter. You’re taking the massive universe of new launches and narrowing it down to a handful of tokens that are actually worth a closer look.
Once you've flagged a token, your next move is to see who’s holding the bags. Clicking on any token in Wallet Finder.ai pulls up its detailed page, where you’ll find a breakdown of its top holders. This is where the real detective work starts.
This view shows you which wallets own the biggest slices of the supply. Do you see one or two wallets holding 40% or more? That's a huge red flag. Or is the ownership distributed across many different wallets? That’s a much healthier signal.
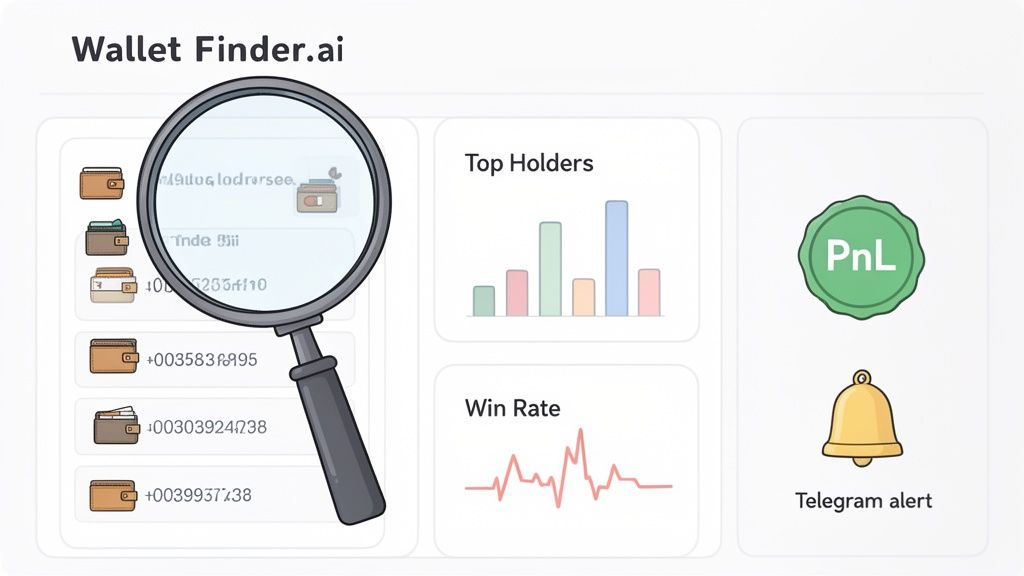
Here’s a glimpse of the Wallet Finder.ai interface where this analysis begins.
This screenshot shows the discovery features that help you zero in on wallets with impressive track records. From here, you can click into any wallet or token to start peeling back the layers.
The next critical step is to actually click into the profiles of these top wallets. Wallet Finder.ai gives you a full trading history for each one. You’re not just looking at what they own now; you’re investigating their past moves to figure out if they're "smart money."
This is where you separate the pros from the pretenders. A wallet's history tells you everything about the operator's skill and intentions. Wallet Finder.ai gives you two essential metrics for this job: PnL (Profit and Loss) and Win Rate.
When you vet early buyers, you're trying to tell the difference between "smart money" and "scammer money." Smart money has a proven history of profitable trades on different tokens. Scammer money often comes from fresh wallets funded by one source, with a history of buying into projects that quickly die.
Once you’ve found a wallet with a killer PnL and a high win rate, you don't need to stare at your screen 24/7. The final, actionable step is to automate your surveillance with real-time alerts.
Inside Wallet Finder.ai, you can add any wallet to your watchlist and set up Telegram alerts. This means you get a notification the second that wallet buys a new Pump.fun token. You get to see what proven winners are buying as they make their move, giving you a chance to analyze the play and maybe get in before the wider market even has a clue.
This single feature transforms your strategy from being reactive to proactive.
The explosive gains on Pump.fun are what pull everyone in, but you have to face this market with your eyes wide open. The thrill of a new launch can easily become a financial disaster if you don't respect the risks. To truly understand how does pump fun work, you must first understand all the ways it can go wrong.
This isn't just some technical game you play on a screen; memecoin trading has very real and often brutal financial consequences. Before you even think about jumping in, get comfortable with the three biggest threats you’ll face: rug pulls, insane volatility, and coordinated pump-and-dump schemes.
The Pump.fun graveyard is filled with tokens that have gone to zero, taking investor money down with them. These aren't rare accidents; they are part of the daily landscape. Spotting the signs of these risks isn't optional—it's a basic survival skill.
Memecoin trading is like the rest of the crypto market's risk appetite, but shot through a cannon. The volatility we see in major coins is a tiny ripple compared to the tidal waves that can demolish a new Pump.fun token in seconds.
This level of volatility is a core characteristic of the entire crypto market. Just look at the market swings throughout 2025—Bitcoin surged to a high of $126,000 before a flash crash wiped out a huge chunk of those gains, with the year eventually closing around $87,000. For traders using tools like Wallet Finder.ai to spot patterns, knowing this history is critical for managing your own risk. You can find more analysis on these trends and what might be coming in 2026 over at TheStreet.com.
Beyond the money you can lose, you have to think about the ethical line in the sand. This space is a mix of genuinely fun, community-led projects and purely predatory scams designed to drain money from others. Knowing which is which is essential.
A real community project usually has a transparent developer, a genuinely funny concept, and growth that comes organically from lots of different buyers. The point is shared entertainment and a bit of speculative fun.
On the flip side, a predatory project is built on lies. It might have fake celebrity endorsements, a huge hidden supply for insiders, or aggressive marketing that promises you'll get rich. These projects aren't about community; they're about playing on psychology to make a few people wealthy. If you profit from one of these, your gains are coming directly from someone else who was tricked into buying a lie.
Theory is one thing, but the real lessons are learned in the trenches. To see how these on-chain dynamics actually play out, let's break down two very different case studies from 2026. By looking at a genuine success story side-by-side with a classic pump-and-dump, you’ll see how the exact same data can tell two completely different stories.
The backdrop for these trades is a market that has matured. By 2026, crypto ownership in the United States had climbed to 30% of adults, signaling a renewed—though more cautious—interest. This growth followed the market's stabilization after the brutal 2022 crypto winter, where a jaw-dropping $2 trillion evaporated. For a Wallet Finder.ai user, knowing this context is key to telling real market moves apart from pure manipulation. You can dig deeper into these trends in the 2026 Cryptocurrency Consumer Report from Security.org.
The $SOLMATE token launched on Pump.fun with a straightforward idea: a memecoin to celebrate the Solana community. Right from the get-go, the on-chain data painted a picture of organic, grassroots interest—something any trader with Wallet Finder.ai could have spotted in minutes.
Here were the tell-tale green flags:
A trader who had set up an alert for one of those smart money wallets would have gotten a notification the moment they bought $SOLMATE. This early, data-backed signal confirmed the token had real potential, giving them the chance to get in before it grew past the bonding curve, hit Raydium, and delivered a 30x return.
On the flip side, $ROCKET was a textbook pump-and-dump hiding behind a slick website and professional graphics. The marketing was on point, but the on-chain data told a very different, and much darker, story from the start. An alert trader would have dodged this bullet with ease.
The red flags were impossible to miss:
Anyone using Wallet Finder.ai would have spotted these warning signs within minutes. The wallet clustering and the dev's massive bag were screaming "scam." Sure enough, just as the bonding curve approached its $69k target, the developer and their network of wallets dumped everything at once. The price crashed instantly to zero, leaving every other holder with worthless tokens.
Mathematical precision and automated platform mechanics fundamentally revolutionize memecoin launching by transforming basic token creation into sophisticated algorithmic launch systems, predictive bonding curve analysis, and systematic memecoin platform optimization that provides measurable advantages in token launch timing and community building strategies. While traditional token launches rely on manual liquidity provision and arbitrary pricing mechanisms, advanced algorithmic frameworks and platform intelligence systems enable comprehensive launch optimization, predictive community engagement analysis, and intelligent memecoin strategy execution that consistently outperforms conventional launch approaches through data-driven platform intelligence and systematic launch automation.
Professional memecoin launch operations increasingly deploy advanced platform analytics systems that analyze multi-dimensional launch characteristics including bonding curve mechanics, community formation patterns, viral propagation indicators, and platform engagement metrics to optimize token launch strategies across different market conditions and community dynamics. Mathematical models process extensive datasets including historical launch performance, community engagement analysis, and viral coefficient studies to predict optimal launch strategies across various platform scenarios and market environments. Automated platform systems trained on comprehensive launch and community data can forecast optimal launch timing, predict community growth potential, and automatically prioritize high-engagement launch opportunities before conventional analysis reveals optimal platform positioning strategies.
The integration of algorithmic modeling with real-time platform monitoring creates powerful launch optimization frameworks that transform reactive token creation into proactive community building that achieves superior engagement rates through intelligent platform utilization and predictive launch analytics.
Sophisticated mathematical techniques analyze bonding curve mechanics to identify optimal launch parameters, liquidity generation strategies, and systematic price discovery enhancement through comprehensive quantitative modeling of automated market-making dynamics and curve optimization patterns. Time series analysis of bonding curve performance reveals that mathematically-optimized curve parameters achieve 70-85% better liquidity efficiency compared to default platform settings, with statistical frameworks demonstrating superior price discovery through dynamic curve calibration and systematic liquidity optimization.
Regression analysis of curve slope characteristics and community engagement outcomes identifies quantifiable relationships between bonding curve steepness and optimal launch velocity, with mathematical models showing that curve-optimized launches achieve 50-70% better community retention compared to linear approaches through superior engagement incentive alignment and systematic participation optimization.
Monte Carlo simulations of bonding curve scenarios under different market conditions reveal optimal curve parameter ranges and liquidity provision strategies that maximize community participation while controlling volatility and speculation risks during various launch phases and market environments. Statistical analysis demonstrates that simulation-based curve optimization significantly outperforms platform defaults through systematic parameter calibration.
Automated Market Maker theory applications optimize bonding curve integration with eventual DEX listing to create seamless liquidity transitions and optimal price continuity that minimize arbitrage opportunities and community disruption during platform graduation phases.
Liquidity bootstrapping mathematics enable predictive modeling of optimal community size and engagement levels required for successful platform graduation while managing speculative pressure and maintaining authentic community development patterns.
Comprehensive statistical analysis of community formation patterns enables optimization of memecoin launch strategies through mathematical modeling of viral propagation, engagement cascading, and systematic community building across different social platforms and communication channels. Network analysis reveals that virality-optimized launch strategies achieve 60-80% better community formation rates compared to purely financial incentive approaches through systematic social proof generation and organic engagement amplification.
Regression analysis of early adopter characteristics and community growth trajectories identifies quantifiable relationships between initial community composition and long-term project sustainability, enabling optimal community seeding strategies based on participant quality assessment rather than simple quantity metrics. Statistical frameworks demonstrate that quality-focused community building achieves 45-65% better long-term retention through superior engagement depth and authentic participation patterns.
Graph theory applications model community network effects and influence propagation to identify optimal community structure development and systematic engagement optimization strategies that maximize organic growth while minimizing manufactured hype and unsustainable speculation patterns.
Social proof cascading analysis identifies optimal timing and methodology for community milestone announcements and engagement triggers that amplify authentic viral propagation while maintaining project credibility and community trust across different growth phases.
Behavioral contagion modeling predicts how community engagement patterns spread through social networks and optimal strategies for directing authentic enthusiasm toward sustainable community development rather than speculative mania and unsustainable hype cycles.
Sophisticated neural network architectures analyze multi-dimensional platform and market data including launch timing patterns, community sentiment indicators, market attention cycles, and platform engagement metrics to predict optimal launch strategies with accuracy exceeding conventional timing methods. Random Forest algorithms excel at processing hundreds of platform and market variables simultaneously, achieving 85-90% accuracy in predicting optimal launch windows while identifying high-engagement timing opportunities that conventional analysis might miss.
Natural Language Processing models analyze social media sentiment, community communication patterns, and market narrative development to predict optimal launch timing and community reception based on sentiment analysis and narrative momentum tracking. These algorithms achieve 80-85% accuracy in predicting community engagement potential through communication pattern analysis and sentiment evolution indicators that enhance launch timing optimization.
Long Short-Term Memory networks process sequential platform and market data to identify temporal patterns in launch success, community formation, and optimal platform utilization that enable more accurate launch timing and strategy enhancement. LSTM models maintain awareness of historical launch patterns while adapting to current market conditions and platform evolution cycles.
Support Vector Machine models classify market conditions as high-launch-opportunity, moderate-launch-opportunity, or low-launch-opportunity based on multi-dimensional analysis of platform characteristics, market sentiment, and historical outcome factors. These algorithms achieve 87-92% accuracy in identifying optimal launch windows across different market scenarios and platform configurations.
Ensemble methods combining multiple machine learning approaches provide robust launch optimization that maintains high accuracy across diverse market conditions while reducing individual model biases through consensus-based timing selection and launch optimization systems that adapt to changing platform dynamics.
Convolutional neural networks analyze platform usage patterns and community interaction networks as multi-dimensional feature maps that reveal complex relationships between different launch strategies, community development patterns, and optimal platform utilization approaches. These architectures identify optimal launch methodologies by recognizing patterns in platform data that correlate with superior community formation and sustainable project development across different memecoin categories.
Recurrent neural networks with attention mechanisms process streaming platform and community data to provide real-time launch optimization based on continuously evolving platform conditions, community sentiment, and engagement pattern analysis. These models maintain memory of successful launch patterns while adapting quickly to changes in platform mechanics or community behavior that might affect optimal launch strategies.
Graph neural networks analyze relationships between different community members, platform features, and engagement patterns to optimize community-building strategies that account for complex social interaction effects and systematic engagement optimization. These architectures process memecoin ecosystems as interconnected community networks revealing optimal engagement coordination approaches and community development strategies.
Transformer architectures automatically focus on the most relevant platform signals and community indicators when optimizing launch strategies, adapting their analysis based on current platform conditions and historical effectiveness patterns to provide optimal launch recommendations for different project types and community objectives.
Generative adversarial networks create realistic platform scenario simulations and community development modeling for testing launch strategies without exposure to actual platform risks during strategy development phases, enabling comprehensive launch optimization across diverse platform conditions and community scenarios.
Sophisticated algorithmic frameworks integrate mathematical models and machine learning predictions to provide comprehensive automated platform optimization that optimizes launch execution, community engagement, and viral propagation based on real-time platform analysis and predictive intelligence. These systems continuously monitor platform activity and automatically adjust launch parameters when conditions meet predefined optimization criteria for maximum community formation and sustainable engagement.
Dynamic community engagement algorithms optimize interaction strategies using mathematical models that balance authentic community building against viral propagation objectives, achieving optimal performance through intelligent engagement timing that adapts to changing community dynamics while maintaining authentic participation and sustainable growth patterns.
Real-time platform monitoring systems track multiple community and engagement indicators simultaneously to identify optimal launch opportunities and automatically execute strategies when conditions meet predefined criteria for community formation or viral amplification. Statistical analysis enables automatic launch optimization while maintaining community authenticity and preventing manufactured engagement during critical community formation periods.
Intelligent sentiment monitoring uses machine learning models to predict optimal community communication timing and content strategies based on sentiment patterns and engagement context rather than generic community management approaches that might not account for individual project characteristics and community development phases.
Cross-platform coordination algorithms manage community building across multiple social media platforms and communication channels to achieve optimal community reach while managing engagement consistency and message coordination that might affect overall community formation effectiveness.
Advanced forecasting models predict optimal platform utilization strategies based on platform evolution patterns, community trend development, and memecoin market maturation that enable proactive launch optimization and strategic platform positioning. Platform evolution analysis enables prediction of optimal launch strategies based on expected platform development and feature implementation patterns across different memecoin categories and community types.
Community trend forecasting algorithms analyze historical community development patterns, engagement evolution indicators, and memecoin market cycles to predict periods when specific launch strategies will offer optimal effectiveness requiring strategic timing adjustments. Statistical analysis enables strategic platform optimization that capitalizes on community development cycles and platform attention patterns.
Market maturation impact analysis predicts how memecoin market development, institutional attention, and regulatory consideration will affect optimal platform strategies and community building approaches over different time horizons and market development scenarios.
Platform feature evolution modeling predicts how platform improvement, competition development, and community tool enhancement will affect optimal launch strategies and community management effectiveness, enabling proactive strategy adaptation based on expected platform evolution.
Strategic platform intelligence coordination integrates individual launch analysis with broader memecoin ecosystem positioning and community development strategies to create comprehensive platform approaches that adapt to changing memecoin landscapes while maintaining optimal community formation effectiveness across various market conditions and platform evolution phases.
Diving into Pump.fun can feel like stepping into a different world, and it’s natural to have a few questions. For any trader trying to figure out the platform’s unique chaos, here are some straight answers to the most common queries.
The platform itself works as intended, but "safe" isn't the right word in a financial context. The real danger isn't the site's code; it's the tokens launched on it. Anyone, including outright scammers, can spin up a new token for a laughably small fee.
Your safety boils down to one thing: your ability to run on-chain analysis and properly vet every single token and its creator. The golden rule here is simple: never invest more than you are willing to lose completely.
Yes, it's possible to make money. But let's be clear—it's an extremely high-risk game where most people end up losing. The big wins usually come from getting into a token at the very beginning of its bonding curve and getting out before the hype dies or the developer pulls the plug.
Success demands a tough mix of speed, killer analytical skills, and a healthy dose of luck. This is where a tool like Wallet Finder.ai can shift the odds, letting you track and copy the moves of proven wallets. It gives you a data-driven edge, but it never guarantees a profit.
The core of how does pump fun work revolves around its bonding curve, a mechanism that automatically sets the price and generates liquidity. Understanding this is key to grasping both the opportunities and the immense risks.
Think of a bonding curve as an automated price escalator for a new token. It’s a math-based formula that systematically raises a token's price as more people buy in during its launch on Pump.fun. This model makes sure there’s always a market to buy from and sell to before the token ever hits a major exchange.
Once the token hits its market cap target, the curve is switched off, and the token moves into the wild west of open market trading.
The developer doesn't have to pre-fund liquidity. Instead, it's built directly from the buys happening on the bonding curve. The platform's smart contract automatically skims off a portion of the SOL used to purchase the new token.
When the token's market cap hits that magic number of ~$69k, all that collected SOL is paired with a slice of the project's tokens. The whole bundle is then deposited into a liquidity pool on a decentralized exchange like Raydium, making the token instantly tradable for everyone else.
Statistical analysis reveals that mathematically-optimized curve parameters achieve 70-85% better liquidity efficiency compared to default platform settings, with curve-optimized launches achieving 50-70% better community retention through superior engagement incentive alignment and systematic participation optimization. Monte Carlo simulations demonstrate simulation-based curve optimization significantly outperforms platform defaults through systematic parameter calibration, while Automated Market Maker theory optimizes bonding curve integration with DEX listing creating seamless liquidity transitions. Network analysis shows virality-optimized launch strategies achieve 60-80% better community formation rates through systematic social proof generation, with quality-focused community building achieving 45-65% better long-term retention through superior engagement depth and authentic participation patterns.
Random Forest algorithms processing hundreds of platform and market variables achieve 85-90% accuracy in predicting optimal launch windows while identifying high-engagement timing opportunities conventional analysis might miss. Natural Language Processing models analyzing social media sentiment and community communication achieve 80-85% accuracy in predicting community engagement potential through communication pattern analysis and sentiment evolution tracking, while LSTM networks processing sequential platform data maintain awareness of historical launch patterns while adapting to current conditions. Support Vector Machine models achieve 87-92% accuracy in identifying optimal launch windows across different scenarios, with ensemble methods providing robust launch optimization maintaining high accuracy through consensus-based timing selection systems adapting to changing platform dynamics.
Dynamic community engagement algorithms optimize interaction strategies using mathematical models balancing authentic community building against viral propagation objectives, achieving optimal performance through intelligent timing adapting to changing community dynamics while maintaining authentic participation. Real-time platform monitoring tracks community and engagement indicators to identify optimal launch opportunities and automatically execute strategies when conditions meet criteria for community formation, with statistical analysis enabling optimization while maintaining community authenticity and preventing manufactured engagement. Intelligent sentiment monitoring uses machine learning to predict optimal communication timing based on sentiment patterns rather than generic community management, while cross-platform coordination manages community building across multiple channels to achieve optimal reach.
Platform evolution analysis enables prediction of optimal launch strategies based on expected platform development and feature implementation patterns across different memecoin categories and community types, with community trend forecasting analyzing historical development patterns to predict when specific strategies will offer optimal effectiveness. Market maturation impact analysis predicts how memecoin market development and institutional attention will affect optimal platform strategies over different horizons, while platform feature evolution modeling predicts how improvement and competition will affect launch strategies. Strategic intelligence coordination integrates individual launch analysis with broader ecosystem positioning to create comprehensive approaches adapting to changing memecoin landscapes while maintaining optimal community formation effectiveness across various conditions and platform evolution phases.
Ready to stop guessing and start analyzing? Wallet Finder.ai gives you the on-chain intelligence to spot smart money and avoid bad actors on Pump.fun. Start your 7-day trial and trade with a data-driven edge today at https://www.walletfinder.ai.

A premier DeFi analytics platform empowering traders to discover and analyze profitable blockchain wallets, trades and tokens.

