
Recovery Factor Calculation for Smart Traders
Master the recovery factor calculation to measure a strategy's resilience. Learn the formula, see DeFi examples, and find top wallets with Wallet Finder.ai.

June 20, 2026


Wallet Finder
April 18, 2026
As of April 2026, IMX was still trading about 93.6% below its all-time high. That alone tells traders what kind of asset they are dealing with. IMX can deliver outsized moves, but it also punishes entries made on comfort, headlines, or lagging confirmation.
Price is only the surface layer. A candlestick chart shows where IMX has traded. It does not show whether larger wallets are building positions into weakness, whether a rebound is being carried by a small cluster of aggressive buyers, or whether liquidity is thin enough to turn a decent setup into a trap.
A better read on the imx token price comes from stacking market structure with wallet behavior.
Start with the token’s role inside the Immutable ecosystem. Then place the current move in historical context, especially how IMX has reacted during narrative expansions and sentiment breakdowns. After that, track wallet flows. In volatile assets, the identity of the buyer often carries as much weight as the candle itself. That is where tools like Wallet Finder.ai become useful. They help separate random volume from smart money activity you can act on.
IMX went from a low token sale base to a sharp exchange debut, then pushed to an early-cycle peak before spending a long stretch repricing lower. That kind of path matters because it shows the token can overshoot in both directions. Traders are not dealing with a slow, valuation-led asset here. They are dealing with a narrative-driven market that can expand fast, then retrace just as hard.
A common mistake is to treat this volatility as noise and wait for clarity. On IMX, "clear" setups often appear after the best asymmetric entry has already passed. By then, early wallets have usually built their positions and late buyers are reacting to a move, not anticipating it.
IMX trades at the intersection of several high-beta themes: Ethereum scaling, NFT infrastructure, and Web3 gaming. Each theme brings its own flow of attention and speculation. When two or three of them heat up at the same time, price can move faster than fundamentals can justify in the short term. When sentiment fades, the same reflex works in reverse.
That pattern has shown up repeatedly around ecosystem catalysts. A game partnership, marketplace expansion, or new launch can trigger a fast upside response as traders price in future usage. The first move is often sharp. The retrace can be just as sharp if wallet follow-through is weak, volume is concentrated in short-term traders, or the broader alt market rolls over.
That is why I treat IMX as a trading vehicle first and a conviction hold second.
A better way to read the move is to ask four practical questions:
Those questions turn raw price action into something usable. A green candle after a headline means little on its own. A green candle backed by repeat buys from larger wallets, improving market structure, and steady liquidity is a different setup.
Practical rule: For IMX, price matters less than who is buying, when they started buying, and whether they keep adding after the headline hits.
Volatility is where the edge comes from, but only if it is measured correctly. Chart traders watch breakouts. On-chain traders can go one layer deeper and track whether smart money wallets were active before the breakout, whether they sold into strength, or whether they kept accumulating through the first pullback. Tools like Wallet Finder.ai help separate random volume from coordinated positioning, which is often the difference between chasing a spike and catching the next leg early.
Preparation matters more than prediction here. Set levels in advance. Mark catalyst dates. Watch wallet clusters around those dates. On IMX, the traders who stay ahead usually read participation early, not just price after the move is obvious.
Before trading the imx token price, you need a reason the token should exist at all. If you skip that step, every move looks random. If you understand the role of Immutable, the price starts to make more sense.
Immutable is a Layer 2 network built around NFTs and Web3 gaming on Ethereum. The practical pitch is simple: Ethereum gives security, but trading digital assets directly on Ethereum can be slow and expensive. Immutable tries to solve that by making NFT and gaming-related activity faster and cheaper while staying tied to Ethereum’s base layer.
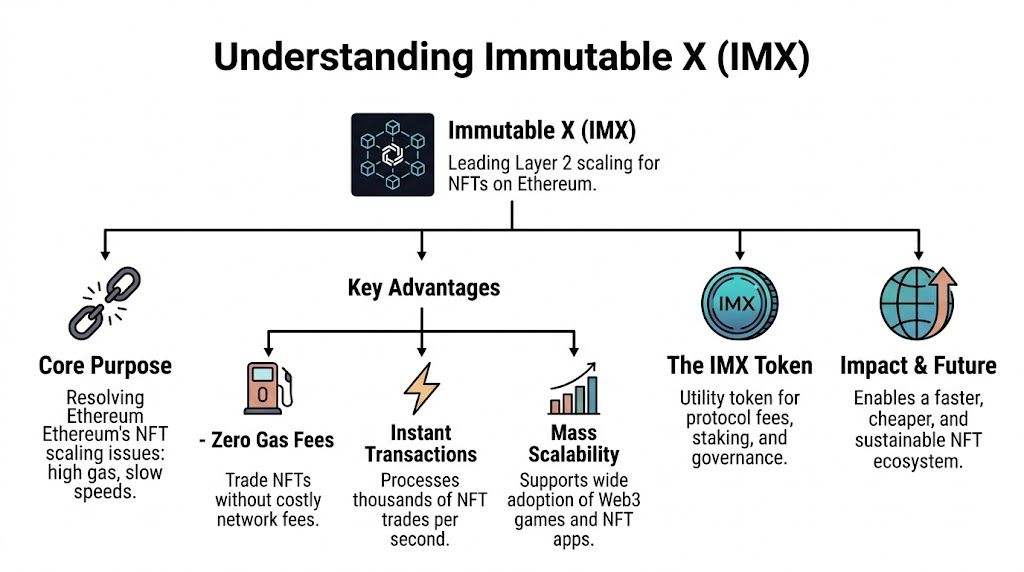
Treat Immutable like a dedicated fast lane for digital asset activity that would otherwise clog the main Ethereum highway. Developers want smoother user experience. Players want transactions that don't feel like a tax event. Traders want infrastructure that can handle activity spikes without becoming unusable.
That matters because infrastructure tokens usually trade on two different clocks. In the short term, they trade on narrative and momentum. Over longer periods, they trade on whether the network remains useful enough for developers, users, and speculators to keep coming back.
The IMX token matters because it isn't separate from the ecosystem's operating logic. Its role is usually discussed through three functions:
| IMX function | Why traders should care |
|---|---|
| Protocol utility | Utility creates a reason for the token to stay relevant beyond pure speculation. |
| Governance | Governance gives token holders a say in network direction, which can matter when ecosystem priorities shift. |
| Staking | Staking can affect how tokens move through the market and how holders think about time horizon. |
Those functions don't guarantee price appreciation. They do give you a framework for deciding whether a rally has substance or is just heat.
A useful token thesis is usually grounded in observable behavior, not slogans. For IMX, the better questions are practical:
The strongest price bases usually form when a token still has real utility but the surrounding narrative has gone quiet.
A weak approach is buying IMX only because it once traded much higher. A prior high tells you the market once paid more. It doesn't tell you that the same conditions still exist.
Another weak approach is assuming all Layer 2 or gaming-related tokens will move together. Correlation helps at times, but token-specific demand, exchange liquidity, and wallet concentration can create very different outcomes.
If you're going to trade IMX seriously, start by respecting the product-market story behind it. Price becomes easier to dissect when you know what demand is supposed to attach to.
A token that can trade from roughly $0.15 in its earliest sale phase to above $9, then spend years giving most of that move back, should be treated as a regime-driven market, not a simple trend chart. That is the right frame for IMX.
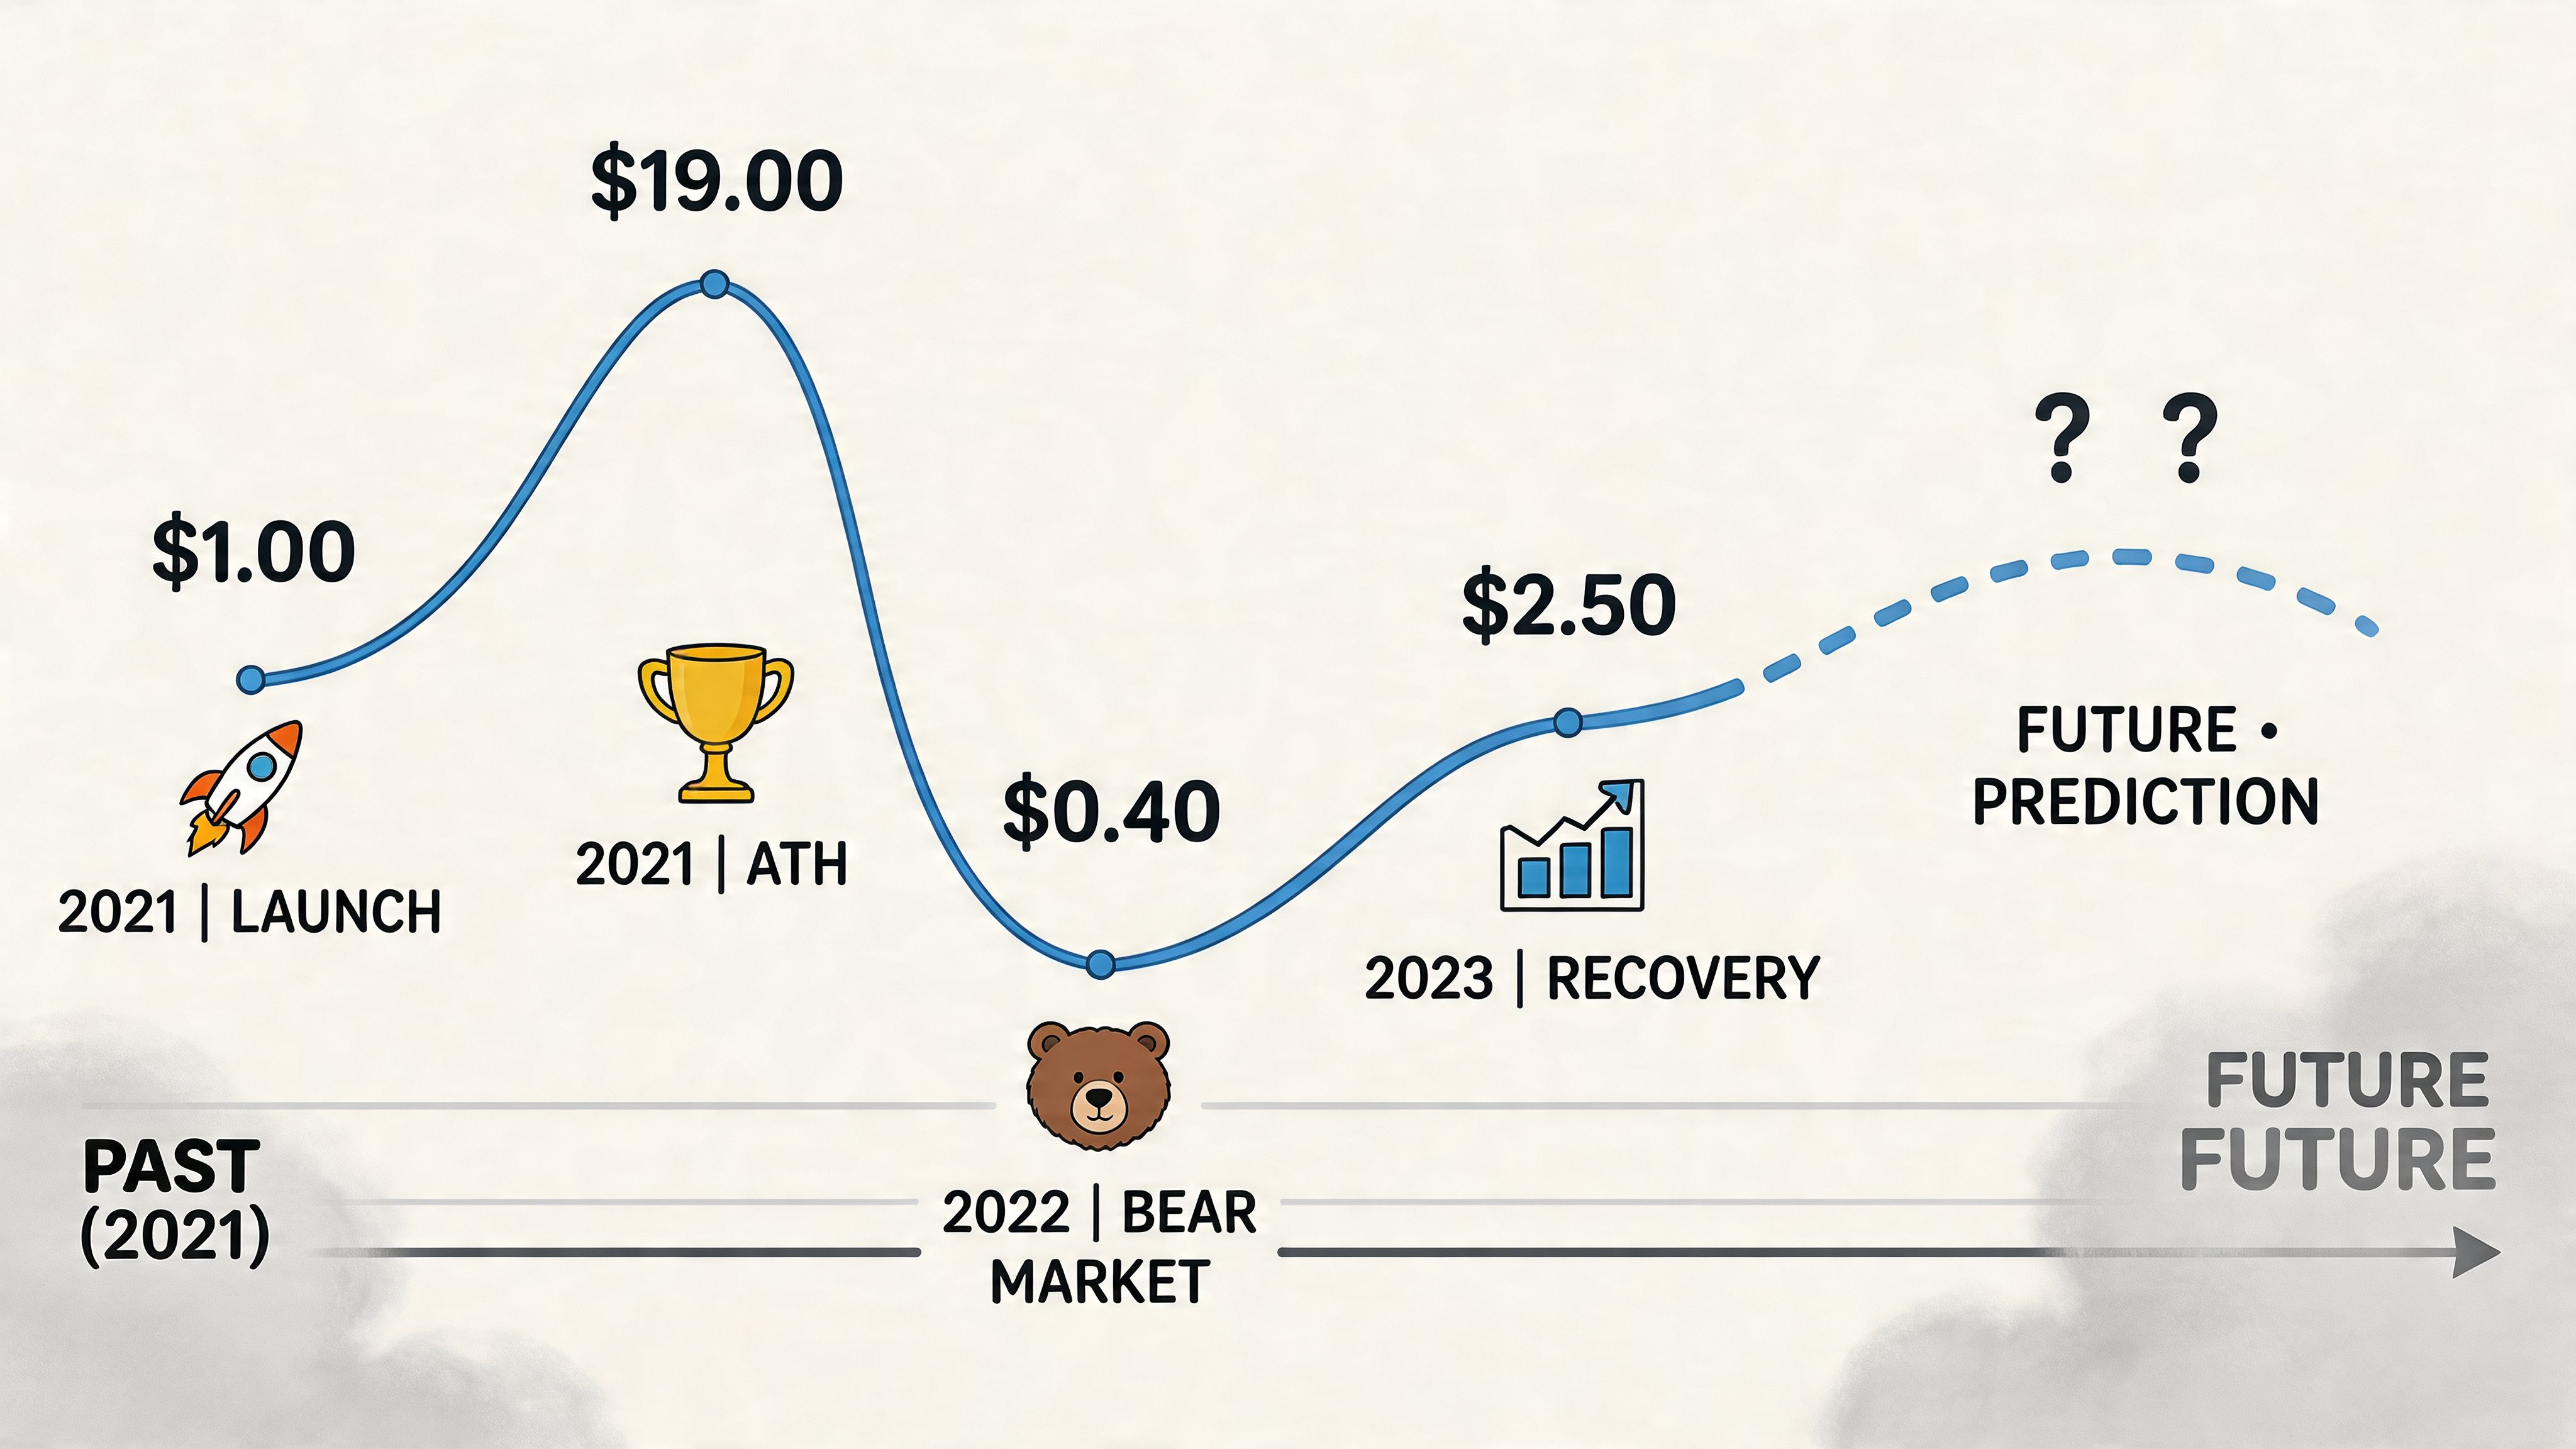
IMX launched via ICO on September 8, 2021 at around $0.15 and began exchange trading on November 5, 2021 at $5.65, as noted earlier in the article. Soon after, it reached its all-time high of $9.52 on November 26, 2021.
That opening sequence matters because it set the psychological map traders still react to. Early participants saw extreme upside in a short window. Later entrants bought into a market already crowded with momentum, narrative demand, and thin tolerance for disappointment.
When a token goes vertical that quickly, the first chart usually exaggerates every future expectation. Traders anchor to the peak. Smart money usually does the opposite. It studies who distributed into strength, who kept size after listing, and which wallets stopped buying once the first expansion phase ended.
After the 2021 peak, IMX moved into a prolonged repricing phase. The token has retraced 93.6% to around $0.17, as noted earlier.
That kind of decline is not just a weak chart. It is a full reset in what the market is willing to pay for the same asset under different liquidity conditions. In practice, many traders make the same mistake. They treat a large drawdown as proof of value instead of asking whether stronger wallets are returning.
The better read is to split the unwind into two tradeable conditions:
Price alone will not separate those two. Wallet behavior often will. If you want a cleaner framework for reading how narrative shifts filter into price, this breakdown of sentiment and token price correlation is useful background before you layer on wallet flows.
IMX had one clear exception to the broader damage. In 2023, it opened at an average of $0.5787, peaked at $2.60, and closed at $2.14, a 369.45% yearly gain, as noted earlier.
That year is worth isolating because it shows what an actual re-rating looks like. Buyers were not just chasing an oversold bounce. The market was willing to pay up again for renewed ecosystem expectations, and that shift lasted long enough to change higher-timeframe positioning.
I usually break IMX history into four market regimes:
| Period | What the market was pricing |
|---|---|
| Launch phase | Scarcity, hype, and category leadership potential |
| Post-ATH decline | Unwinding of inflated expectations and broad sector weakness |
| 2023 recovery | Renewed belief that ecosystem execution could bring demand back |
| 2025 to 2026 weakness | A harder test of whether value buyers and strategic wallets still want exposure |
IMX has reached an all-time low of $0.1322 in April 2026, as noted earlier. That level attracts very different types of buyers, and they should not be grouped together.
One group scales in slowly because they see asymmetry at depressed levels and can wait through volatility. The other group buys because the token is far below prior highs. The first approach can work if wallet accumulation, exchange outflows, and market breadth start to improve. The second approach usually fails because past price is not support by itself.
The practical takeaway is simple. IMX history is useful because each major turn came from a change in who was active, not just a change in candle color. If you track those participation shifts early, especially among larger wallets, you get a better shot at catching the next inflection before it is obvious on the chart.
The imx token price doesn't move for one reason. It moves when several forces line up at once. The cleanest way to read it is to separate market structure, token structure, and narrative pressure.
According to CoinGecko’s IMX market page, IMX posted a 93.6% decline from its all-time high, but also a 76.9% recovery from its all-time low. Over the year to April 2026 it shed 65.36%, yet still showed 47.1% gains over 30 days. The same source notes 24-hour volume above $12.3 million across 109 exchanges, with major liquidity on MEXC and Coinbase.
Those figures matter because they tell you IMX can be weak in the larger timeframe and still violent in shorter windows. Traders who ignore that mismatch usually do one of two things wrong. They short local strength into a sharp squeeze, or they overcommit to a bounce that exists inside a broader downtrend.
CoinGecko also notes a fixed supply of 2 billion IMX. Fixed supply doesn't make a token bullish by itself, but it gives you a cleaner framework for valuation than a token with uncertain issuance or inflation surprises.
What matters more in practice is how supply behaves in the market:
If you're building a framework around sentiment, the relationship between narrative and pricing is worth studying through Wallet Finder’s piece on the correlation between sentiment and token prices.
IMX is tied closely to Ethereum, NFT activity, and gaming-related risk appetite. That gives it upside when those themes come back into favor, but it also makes the token vulnerable when traders abandon those sectors.
CoinGecko’s historical summary highlights the contrast clearly. IMX reached a 2023 peak of $3.75 and logged a 369% yearly gain, but then struggled through the following correction cycle. That kind of path usually means the token has high beta to sector narratives rather than stable demand independent of them.
A practical way to organize the drivers looks like this:
| Driver | Bullish read | Bearish read |
|---|---|---|
| Liquidity | Volume supports continuation | Thin order books increase trap risk |
| Fixed supply | Cleaner valuation framework | Doesn't matter if demand fades |
| Gaming and NFT narrative | Ecosystem interest expands | Category remains out of favor |
| Recent price behavior | Short-term momentum attracts traders | Countertrend strength fails quickly |
Don't treat IMX as a pure fundamentals trade. It often trades as a narrative asset first and a utility asset second.
The traders who handle it best usually ask one blunt question: is this move being sponsored by real participation, or is it just a temporary vacuum on one side of the order book?
Price charts alone won't tell you whether the current IMX move is being built by informed buyers or by late momentum chasers. That's the gap most IMX analysis leaves open.
MEXC’s write-up on IMX notes a disconnect between bullish long-term projections and recent market reality, including an all-time low of $0.134529 on February 6, 2026, while also pointing out that many analysts ignore whale wallet activity and trader PnL. The same piece adds that 24-hour volume in the $12 million to $19 million range can create liquidity traps for copy traders who don't know who is behind the move, as discussed in MEXC’s IMX analysis.
Most traders see the candle after it forms. Wallet tracking lets you inspect the participants before the move becomes obvious on a public chart.
That's especially useful on a token like IMX because price can look healthy while the move is narrow and fragile. If only a small set of wallets is active and broad participation never follows, continuation is less reliable. If several strong wallets begin building exposure across multiple entries, that's a very different setup.
The best use of smart money analysis isn't blind copying. It's confirmation.
Use a repeatable process instead of reacting to isolated transactions.
Start with token-level screening
Pull recent IMX activity and identify whether buying is clustered around a few known profitable wallets or spread across lower-quality accounts.
Rank wallets by behavior, not just one trade
A wallet that caught one good IMX bounce isn't enough. Look for consistency, realized gains across multiple trades, cleaner timing, and disciplined exits.
Check trade sequencing
The useful question isn't “did this wallet buy IMX?” It's “did this wallet scale in during weakness, chase a breakout, or rotate from another theme into IMX?”
Separate accumulation from noise
One buy can be a probe. Repeated buys around a range tell a stronger story. So do coordinated buys from multiple profitable wallets within a short window.
Map wallet activity against price structure
If strong wallets buy into local support and price holds, that's usable. If they buy and price immediately loses structure, wait.
For traders who want a framework for this style of research, the concept is close to what smart money tools aim to organize in this guide to smart money tracking.
Not all “profitable” wallets are worth following. Some are too early, some are too illiquid, and some behave in ways that are impossible to mirror responsibly.
Focus on these traits:
Follow wallets whose process you can understand. If you can't explain why a wallet entered and how it typically exits, it's a bad candidate for copying.
A walkthrough helps. This video shows the style of wallet-led analysis that many copy traders use before acting on token signals.
When I assess IMX wallet flow, I give the highest weight to alignment. The strongest setup isn't just “a whale bought.” It's when several things agree:
| Signal layer | What you want to see |
|---|---|
| Price context | IMX is holding a meaningful level or reclaiming structure |
| Wallet quality | Buyers have a track record you respect |
| Trade clustering | More than one good wallet is involved |
| Execution style | Entries look deliberate, not impulsive |
| Liquidity conditions | Enough market depth to avoid immediate slippage traps |
What doesn't work is copying every large transaction or chasing public chatter after wallets have already rotated out. Smart money tracking is useful because it narrows your attention. It doesn't remove the need for discretion.
A good IMX trade usually needs two forms of confirmation. Technical structure tells you where the trade makes sense. Wallet behavior tells you whether better operators are seeing the same thing.
TipRanks’ technical analysis for IMX notes that recent price around $0.75 sits above the 20-day EMA at $0.70, 50-day EMA at $0.64, 100-day SMA at $0.56, and 200-day SMA at $0.56, with ROC at 5.23 and ADX at 24.86, all supporting a bullish trend framework in that dataset, according to TipRanks’ IMX technical page.
The best technical setup on a volatile token is usually simple: trend alignment plus a non-random entry.
If price is above the key moving averages and holds above the 50-day EMA, you're dealing with a market that at least has a favorable trend backdrop in that timeframe. TipRanks also states that mirroring smart money buys while price holds above the 50-day EMA showed a 68% win rate in backtests.
That matters because it gives you a framework, not just an opinion.
Here are three trade structures that make sense for IMX.
Trend continuation trade
Use it when IMX remains above the higher-timeframe moving averages and wallets are buying pullbacks instead of breakouts. This is the cleanest version of bullish participation.
Reclaim trade
Use it when price loses structure, then recovers an important average or level while stronger wallets start re-entering. This setup is attractive because it often catches the move before confidence fully returns.
Reaction trade after oversold pressure
Use it only when selling looks exhausted and wallet buying appears deliberate. This is the highest-risk setup because weak assets can stay weak, but it can also produce strong snapbacks.
TipRanks notes a practical framework for risk control: stops placed below the 100-day SMA at $0.56 with 15% to 25% upside targets. That's a useful example because it ties the stop to structure instead of emotion.
If you trade IMX, position sizing matters as much as entry quality. The token moves fast enough that oversized positions can turn a manageable mistake into a portfolio problem. A good primer on that is Wallet Finder’s guide to position sizing for high-volatility trades.
A disciplined IMX risk checklist looks like this:
| Rule | Why it matters |
|---|---|
| Size smaller than your conviction wants | Volatility punishes oversized certainty |
| Use structure-based stops | Stops should reflect chart invalidation, not discomfort |
| Take partial profits | IMX often gives sharp moves that don't last |
| Require signal agreement | Technicals without wallet support can fail quickly |
| Skip thin setups | Low-quality liquidity creates bad fills and worse exits |
The trade is only good if you already know where you're wrong.
Two habits consistently hurt IMX traders.
First, they chase breakouts after the most visible candle, with no proof that stronger wallets are still adding. Second, they hold every winner as if it must return to old highs. IMX has a history of violent repricing, and that cuts both ways.
The better approach is mechanical. Let the trend define the backdrop. Let wallet behavior act as confirmation. Let risk limits decide your size. That's not glamorous, but it fits the asset.
Some questions come up repeatedly with the imx token price because IMX sits between infrastructure, gaming, and speculative momentum. The answers are more useful when they're tied to process instead of hype.
| Question | Answer |
|---|---|
| Does IMX have a long-term bull case even after a deep drawdown? | Yes, but only if you base that case on ecosystem relevance and actual demand rather than the fact that price used to be much higher. Historical highs show what happened in a specific market regime, not what must happen again. |
| Do major game launches matter for IMX price action? | They can. New launches and ecosystem developments often act as catalysts because traders reprice the broader network story. The important part is whether those events bring sustained wallet activity and follow-through, not just a short headline spike. |
| Is IMX better traded short term or held long term? | For most market participants, IMX is easier to manage as a structured trading asset. Long-term holding can work, but only if you can tolerate severe drawdowns and still judge the network on utility rather than sentiment. |
Tokenomics matter, but traders often overrate them in isolation. Fixed supply is useful because it gives you a cleaner valuation frame, yet supply discipline doesn't create demand by itself.
What matters more is whether the ecosystem remains active enough that the market continues assigning value to the token's role. If that activity fades, good tokenomics won't rescue price on their own.
Yes, if you use it as context rather than prophecy. Wallet activity is most helpful when it answers a narrow question: are stronger traders accumulating while the broader market is distracted, or are they distributing into strength while retail is getting excited?
That can improve timing, but it won't remove false signals. You still need chart structure and risk control.
They confuse volatility with inevitability. A big bounce doesn't mean a new cycle has started. A deep drawdown doesn't mean value has appeared automatically.
The better habit is to ask what kind of move you're seeing:
If you can classify the move correctly, your trade management usually improves with it.
The right question isn't “Can IMX go higher?” It's “What evidence says this move deserves capital right now?”
Trading the imx token price well means resisting single-indicator thinking. No chart pattern, moving average, or wallet alert is enough by itself.
The stronger process is layered. Historical context tells you how IMX behaves when narratives flip. Ecosystem understanding tells you why the token can attract demand in the first place. Market structure tells you whether participation is healthy or fragile. Wallet analysis tells you whether skilled operators are positioning before the crowd catches up.
That's the true edge in 2026. Not prediction. Synthesis.
If IMX is above important moving averages, that matters. If stronger wallets are also buying into support, that matters more. If the move is happening in thin liquidity with no quality follow-through, the same chart can become a trap. Reading those differences is what separates reactive trading from informed trading.
A practical IMX routine should stay simple:
IMX has already shown that it can rally hard, collapse significantly, and recover when the market rediscovers the story. That makes it a difficult token for passive assumptions and a very usable token for disciplined traders.
The goal isn't to know exactly where IMX goes next. The goal is to know what kind of evidence earns a trade, what kind of evidence cancels it, and what kind of move should be ignored.
If you want to turn wallet activity into something you can trade, Wallet Finder.ai helps you track profitable on-chain wallets, inspect trade history and PnL, build watchlists, and get real-time alerts when tracked wallets buy or sell. For IMX and other volatile tokens, that kind of workflow can help you act before broad market attention catches up.

A premier DeFi analytics platform empowering traders to discover and analyze profitable blockchain wallets, trades and tokens.

