
Recovery Factor Calculation for Smart Traders
Master the recovery factor calculation to measure a strategy's resilience. Learn the formula, see DeFi examples, and find top wallets with Wallet Finder.ai.

June 20, 2026


Wallet Finder
April 14, 2026
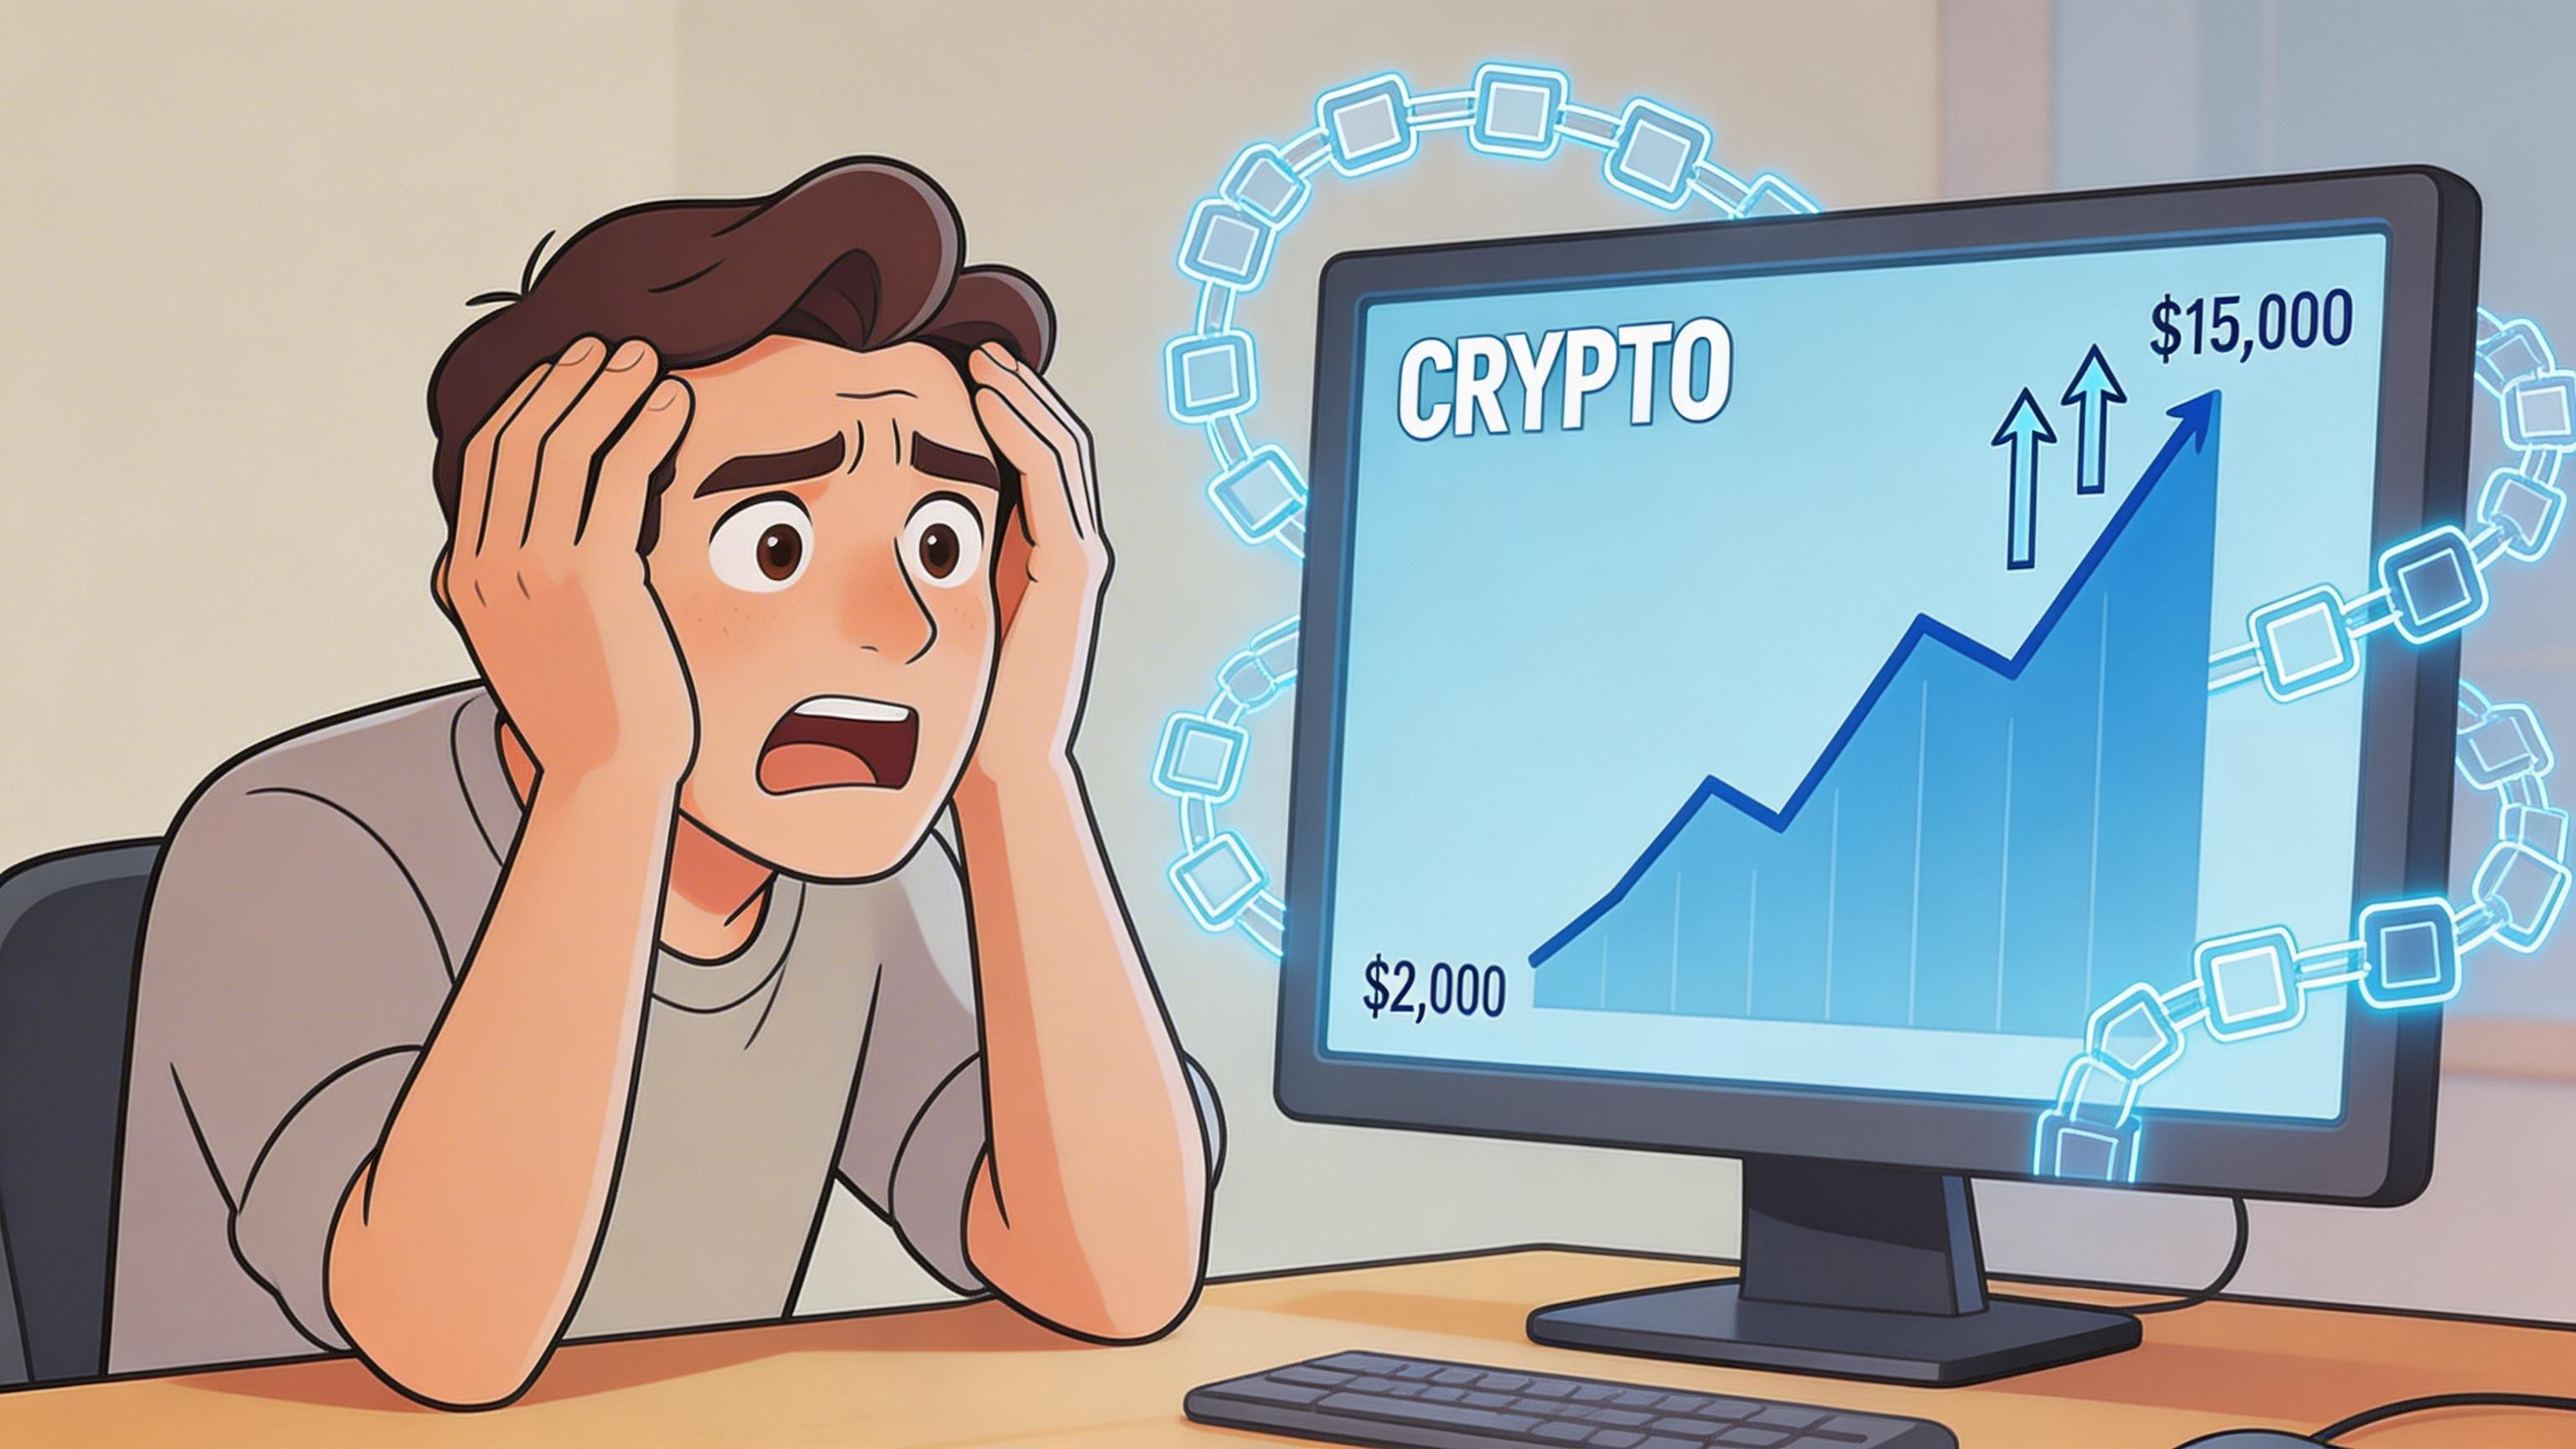
You know the feeling. A token starts running, CT gets loud, your alerts fire late, and by the time you look at the chart the clean entry is gone.
Most traders blame speed. The problem lies in where they look. They watch price, engagement, and headlines. Smart money leaves a trail earlier than all of that. It shows up in inflow and outflow data.
That’s the edge. Not just spotting money entering or leaving an exchange, but tracking what happens next. Did the funds go dormant in a fresh wallet. Did they bridge to Base. Did they hit Raydium or Uniswap minutes later. Did the same wallet size into a new pair with the same discipline it used on previous winners.
You usually don’t miss the move because you’re uninformed. You miss it because your signals are lagging.
Price alerts trigger after the first expansion. Social chatter explodes after early buyers are already green. “Trending” dashboards mostly show you what already happened. That’s why late entries feel cursed. You’re reading the market after the people moving size have already acted.
In traditional finance, operators care about cash flow before they care about appearances. Strong inflow means the business has room to operate, invest, and survive pressure. In the first half of FY2024, Indian businesses saw cash balances surge by 18% to nearly ₹10 trillion, the fastest growth in four years, showing how inflows exceeding outflows support stability and growth according to Recur Club’s explanation of cash inflow and outflow.
Crypto works the same way in principle, even if the terrain is different.
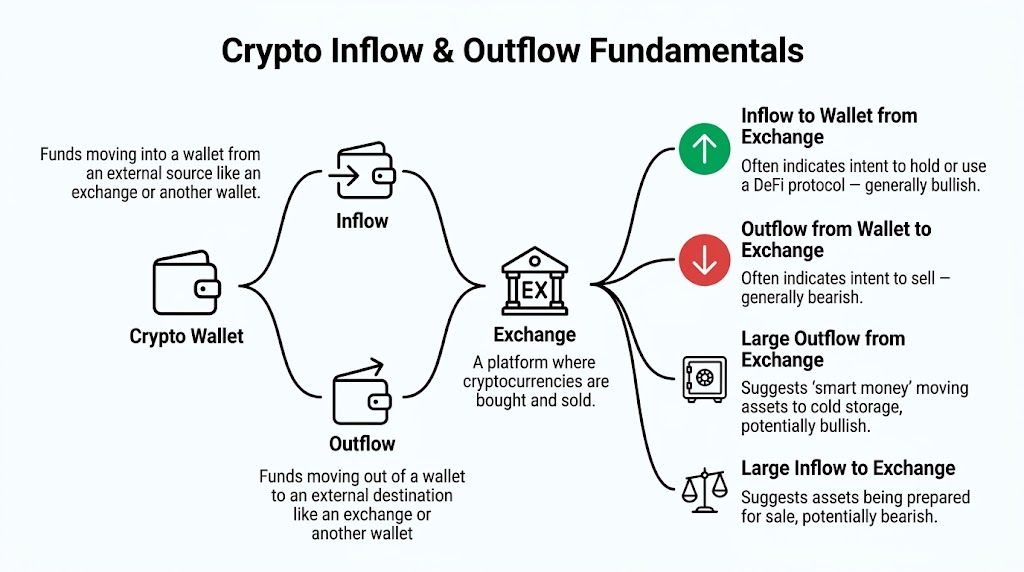
A wallet that keeps receiving fresh capital, then deploys it into liquid on-chain opportunities, tells you more than a token chart alone. An exchange that sees a wave of deposits tells you something else entirely. One points to positioning. The other often points to preparation for exit.
They stop the analysis too early.
They see “exchange outflow” and label it bullish. Sometimes that’s right. Sometimes it’s lazy. Outflow can mean cold storage. It can also mean a trader is about to rotate aggressively into a DEX, chase a narrative, or seed multiple wallets before entry.
That’s where most retail traders lose the thread.
Practical rule: The exchange event is the start of the investigation, not the conclusion.
If you’ve ever watched a coin rip and wondered how people got there early, start by reviewing capital routes instead of candle shapes. A good place to understand the setup is this breakdown of what tends to move a pump coin price.
Think less in terms of “bullish” and “bearish” labels, and more in terms of intent.
That shift in framing is where inflow and outflow stop being trivia and start becoming tradeable information.
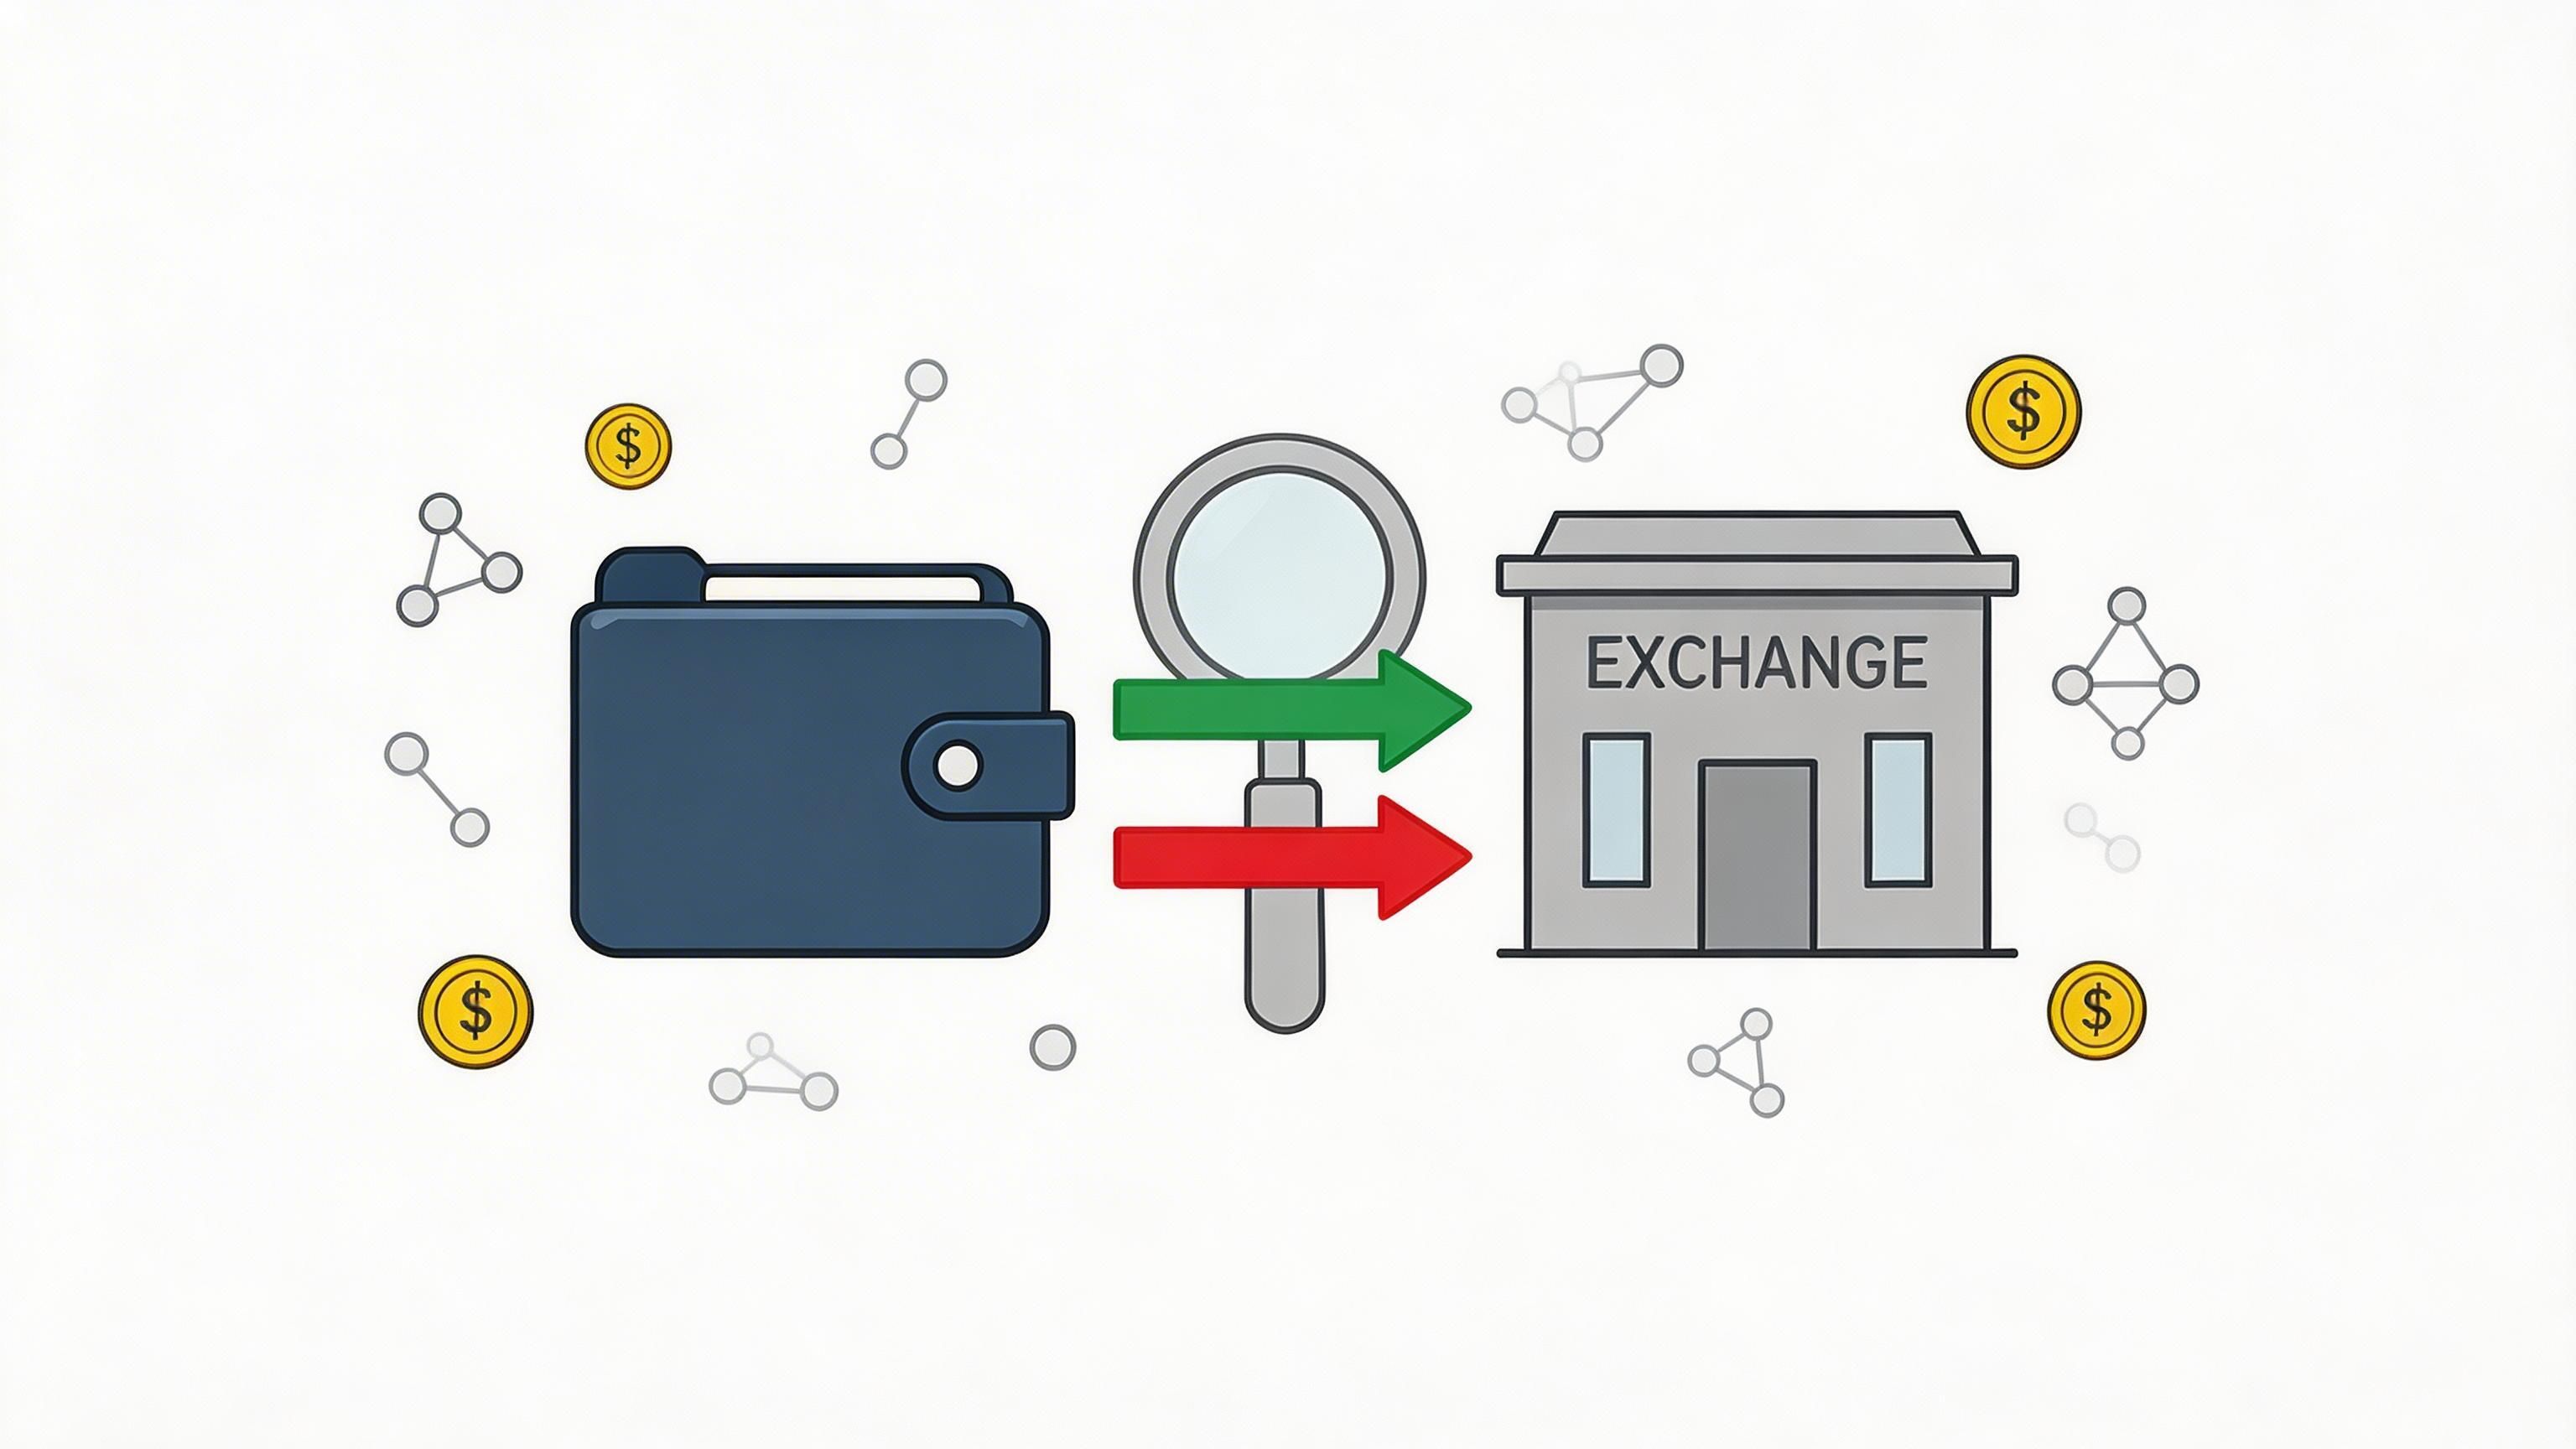
The cleanest way to think about crypto flows is to treat the market like connected reservoirs.
Exchanges, private wallets, bridges, and DeFi protocols all hold capital. Inflow and outflow are the pipes between them. The meaning changes based on which reservoir you’re measuring.
This is the broadest view.
An exchange inflow means coins are deposited from external wallets into exchange wallets. An exchange outflow means coins are withdrawn from exchanges to external wallets. CryptoQuant’s exchange flow guide notes that exchange inflows often signal bearish intent to sell, while outflows often reflect bullish confidence, and a surge in Bitcoin inflows on a 7-day moving average has historically marked local tops as holders move assets onto exchanges to sell according to CryptoQuant’s exchange in-outflow and netflow documentation.
That’s useful, but it’s still macro.
Exchange-level data answers questions like these:
It does not tell you whether the withdrawn funds are going inactive or getting deployed into a new trade.
Now narrow the lens.
At the token level, inflow and outflow tell you where a specific asset is going. If a token starts moving onto exchanges in size, traders should pay attention to potential sell pressure. If the token leaves exchanges and disperses into wallets that rarely sell quickly, that can support a stronger hold thesis.
Token-level flow works best when you pair it with context:
| Flow view | What it helps answer | What it misses |
|---|---|---|
| Exchange-wide | Market sentiment and broad supply pressure | Which token or wallet is driving the move |
| Token-specific | Asset-level demand and sell readiness | Whether the receiver is passive or active |
| Cross-venue | Whether capital is rotating between chains or venues | The exact strategy behind the move |
Real edge starts here.
Wallet-level analysis asks who is moving funds, where they came from, and what happens after receipt. A wallet receiving stablecoins from a major exchange means very little on its own. The same transfer means much more if that wallet has a documented pattern of entering narratives early, scaling in with discipline, and taking profit without round-tripping gains.
The same outflow can mean accumulation, market making, bridge preparation, or a fast DEX rotation. Context decides the trade.
Wallet-level work is less comfortable because it removes the shortcut. You can’t slap one label on the flow and move on. You have to inspect behavior.
When traders are overloaded, this hierarchy keeps analysis clean:
Start broad
Check exchange flow to understand whether supply is generally moving toward sell venues or away from them.
Narrow to the asset
Focus on the specific token or stablecoin involved. Capital rotating into stablecoins tells a different story from capital rotating into a volatile asset.
Finish with the actor
Identify the wallet. Review its recent history. Does it hold, farm, flip, or seed multiple addresses before acting?
That sequence prevents a common mistake. Traders often see a macro bullish signal, then buy without checking whether the actual receiving wallets have a history of dumping into strength.
Most raw flow dashboards are noisy. A professional read starts by simplifying the signal.
The first thing to isolate is whether the market is seeing net inflow or net outflow. Then you decide if the move is isolated, sustained, or distorted by one-time transfers.
Net flow is the simplest useful metric.
At a practical level, think of it as inflows minus outflows. If deposits onto exchanges exceed withdrawals, that usually means more immediate liquidity is available for selling. If withdrawals exceed deposits, supply becomes less available on exchange venues.
The market impact can be meaningful. Positive net flows, where inflows exceed outflows, have preceded 5-15% intraday price drops in over 70% of observed cases. Sustained negative net flows, where outflows exceed inflows, have historically pushed prices 10-25% higher over a 7-day period. One cited example showed 44.09k more BTC withdrawn than deposited in 24 hours, which signaled strong buying pressure according to VectorCrypto’s inflow and outflow indicator guide.
That doesn’t mean every negative net flow is a buy. It means a persistent shortage of sellable supply matters more than a single dramatic transfer.
A one-off outflow can be treasury movement, internal wallet management, or a whale changing custody.
A sustained outflow trend is different. It shows repeated withdrawal behavior. That usually tells you conviction is broad enough, or organized enough, to affect tradable supply.
This is why traders who react to one candle in the flow chart get trapped. They trade the print, not the pattern.
Raw inflow numbers without context can mislead. A big number during a high-volume session doesn’t mean the same thing as the same number in a dead market.
Use these filters:
Inflow ratio
This compares inflows against overall market activity. It helps separate meaningful deposits from routine movement.
Outflow ratio
This highlights whether withdrawals are dominant relative to traded volume.
MA7 or similar smoothing
A moving average strips out impulse spikes. It won’t catch the first second of a move, but it gives a cleaner signal for trend shifts.
If you’re checking wallet behavior manually, use a workflow that lets you compare flow with actual swaps and wallet history. This guide on how to check on-chain activity effectively is a useful companion to that process.
| Signal Scenario | Likely Interpretation | Potential Action |
|---|---|---|
| Rising exchange inflows over time | More assets are being positioned for sale. Selling pressure may build. | Tighten risk, avoid chasing late breakouts, watch for local top behavior. |
| One large exchange inflow with no follow-through | Could be internal movement or one-off positioning. Signal quality is weaker. | Wait for confirmation from repeated deposits or actual sell activity. |
| Sustained exchange outflows | Supply is leaving sell venues. Scarcity can support price. | Look for continuation setups rather than immediate fade trades. |
| Large outflow followed by inactivity | Possible cold storage or long-term holding. | Good for macro bias, weak for short-term copy trading. |
| Large outflow followed by rapid DEX swaps | Capital is being actively redeployed. | Track the receiving wallet and the first new positions. |
| Positive net flow with weak tape | Market may be vulnerable to quick downside. | Reduce aggressive longs and watch liquidity pockets. |
| Negative net flow with strong follow-through | Scarcity is aligning with demand. | Prefer pullback entries over breakout panic buys. |
Don’t ask whether a flow is bullish. Ask whether it changes available supply, and whether the receiving wallet has a repeatable edge.
What works:
What doesn’t:
That last mistake is common. Traders see motion and assume meaning. On-chain analysis pays when you force yourself to validate intent.
Most content about inflow and outflow stops at the exchange door.
That’s where the essential work starts. Once funds leave a centralized exchange, you need to know if they went dormant, got split into fresh wallets, bridged across ecosystems, or started swapping into new positions. The alpha is in that second leg.

A trader sees exchange outflow and assumes “bullish.”
That’s incomplete. In DeFi, withdrawn capital often goes straight to work. Mainstream analysis often misses this. In Q1 2026, Solana outflows surged 25% during a memecoin pump, but on-chain data showed 60% of those funds were deployed on Raydium within 48 hours, correlating with 15-30% PnL gains for the wallets involved according to Gate’s discussion of exchange inflows and outflows.
That changes how you should read an outflow.
If the receiving wallet historically parks assets, the signal is slow and structural. If the receiving wallet starts swapping quickly on Raydium, Uniswap, or Aerodrome, the signal is tactical. For active traders, tactical matters more.
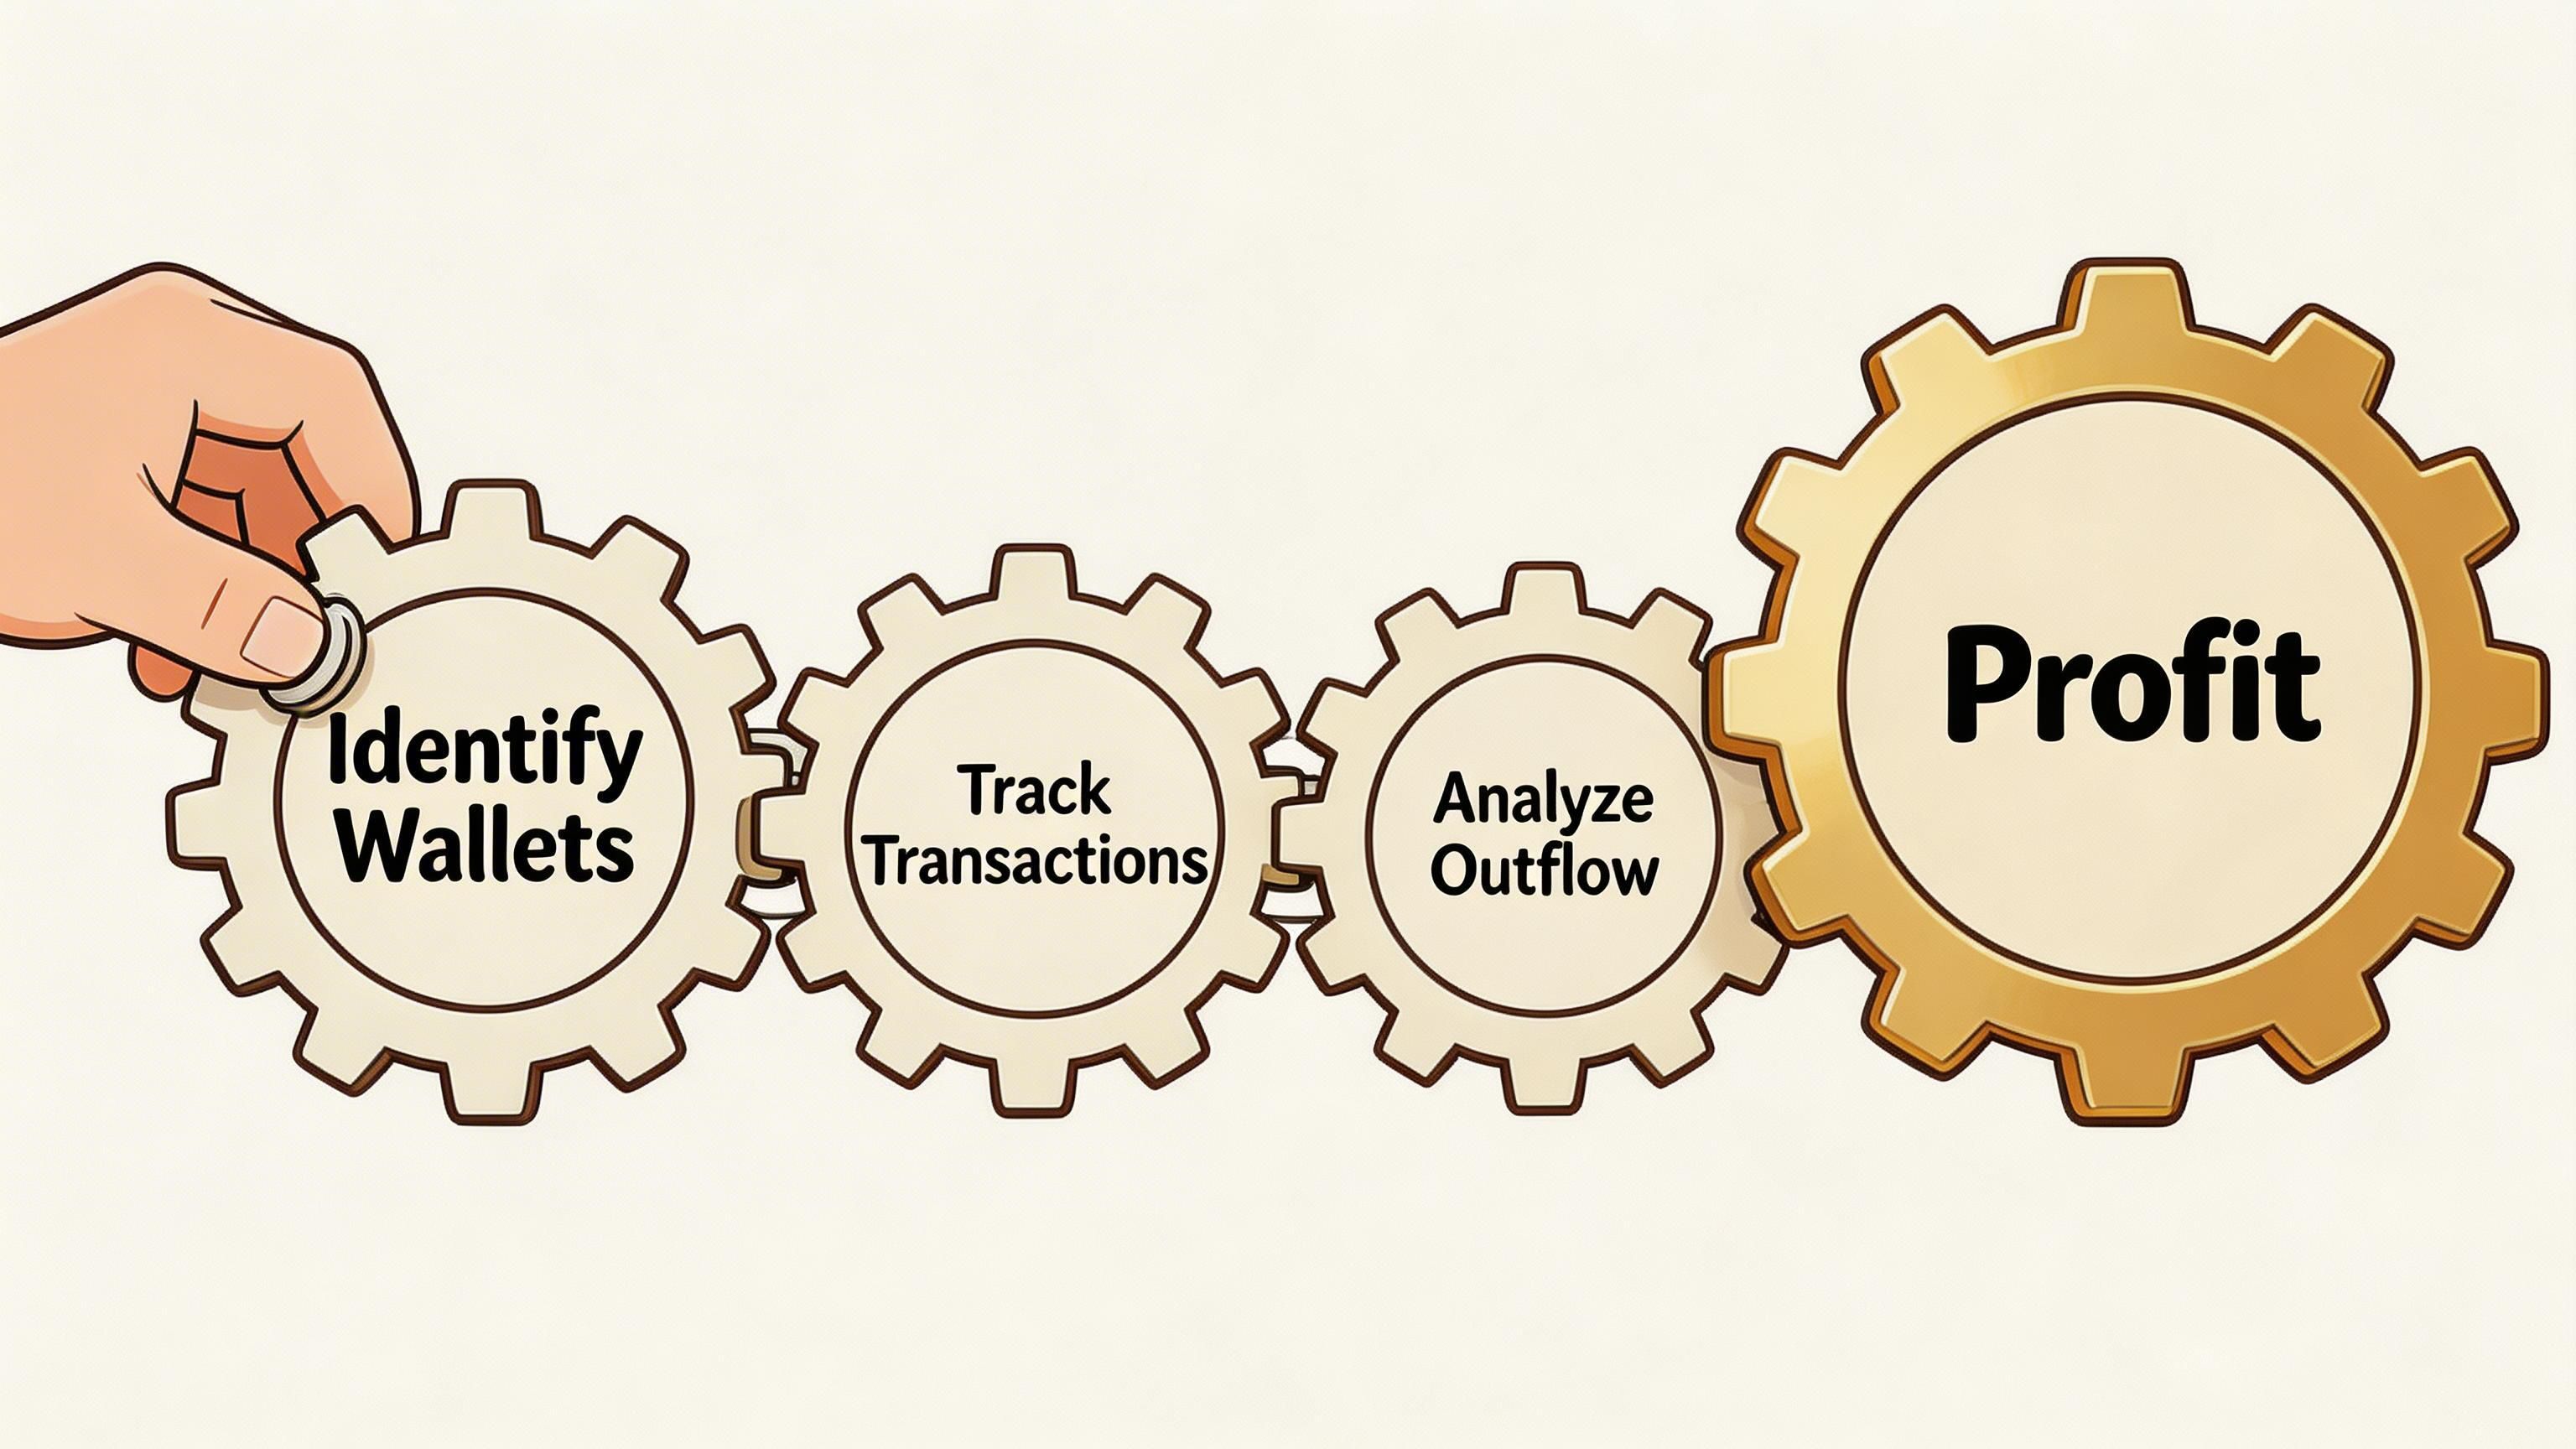
The sequence below is where smart money footprints become usable:
Identify the receiving wallet
Don’t stop at the exchange withdrawal. Find the first non-exchange address that receives the funds.
Check whether funds split
Some operators shard funds across several wallets before execution. That often hides intent from casual dashboards.
Watch the first interaction
The first bridge, swap, or LP action usually tells you the strategy type faster than the raw transfer does.
Compare against prior behavior
If the wallet repeatedly buys early, scales carefully, and avoids oversized chase entries, that’s actionable.
A proper wallet-tracking stack matters here. Wallet Finder.ai aggregates wallet histories across ecosystems like Ethereum, Solana, and Base, with views for wallets, trades, tokens, PnL, win streaks, and entry-exit timing. For this use case, the important part isn’t the headline stats. It’s the ability to inspect whether a wallet that just received fresh capital tends to hold, rotate, or farm. The platform’s smart money tracker guide is a practical reference for that workflow.
A passive holder and an active trader can both produce the same first transfer. Their next actions won’t look the same.
Use these distinctions:
Passive wallet behavior
Receives funds, sits still, maybe consolidates, little or no early swap activity.
Active wallet behavior
Receives funds, bridges or swaps quickly, enters multiple positions, often repeats known timing patterns.
Operational wallet behavior
Funds move through the address, but the wallet acts more like a relay than a trader.
The edge isn’t “outflow is bullish.”
The edge is: which outflows belong to wallets that convert fresh capital into profitable on-chain action quickly and repeatedly.
That’s how you move beyond generic sentiment reads. You stop trading the category and start trading the actor.
If an outflow ends in a wallet with no edge, you learned sentiment. If it ends in a wallet with a proven process, you found a lead.
This is especially useful in fast markets where narratives jump from chain to chain. Exchange flow gives you the first alert. Post-outflow wallet analysis tells you whether there’s a trade.
You don’t need more dashboards. You need a routine that filters noise and flags the few flows that matter.
Start with one chain you already trade well. Add one wallet cohort. Then build alerts around capital arrival and first deployment.
Most traders make the watchlist too broad. They track every whale-looking address and end up drowning in transfers.
A tighter list works better.
Focus on wallets that show a combination of these traits:
Recent capital arrival
A wallet that just received exchange funds is more interesting than a wallet that has been idle.
Clean trade history
You want wallets with understandable behavior. Random activity is hard to mirror.
Consistent execution style
Some wallets snipe. Some ladder. Some rotate narratives. Track the style you can follow.
Chain relevance
If you trade Solana memecoins, don’t fill your core watchlist with wallets whose edge is on Ethereum long-tail DeFi.
Most alerts fire too late because they’re based on token price or public attention.
You want alerts on behavior:
Those are decision points. They’re far more useful than generic “volume spike” alerts.
If every transfer pings your phone, you’ll stop trusting the system.
Use thresholds based on your market and timeframe. The point isn’t to catch everything. The point is to catch moves large enough, and deliberate enough, to be worth manual review.
Good threshold logic usually includes:
| Alert Type | Why it matters | Filter idea |
|---|---|---|
| Funding event | Signals a wallet is ready to act | Only flag fresh capital into watched wallets |
| First swap | Often reveals the immediate thesis | Alert when the wallet opens a new token position |
| Repeat buy | Indicates conviction, not just a probe | Flag second entries into the same asset |
| Exit or trim | Helps with timing and risk | Track partial sells from wallets with disciplined profit taking |
A lot of fake conviction signals disappear when you inspect the route.
Ask:
That route analysis tells you whether the trader is improvising or following a repeatable method.
A simple daily cadence looks like this:
Before session open
Review fresh funding events into tracked wallets.
During active market hours
Watch first swaps and repeat buys.
After big moves
Review exits, trims, and redeployments.
That loop gets more useful over time because you stop looking at isolated transactions and start seeing patterns.
Here’s a walkthrough that shows the mechanics in motion:
The best use of inflow and outflow tracking on names like $WIF isn’t trying to buy the first tick. It’s identifying when a wallet you trust gets funded, then seeing whether it starts building the position instead of probing and leaving.
That distinction matters.
A serious wallet often shows its hand in stages. First comes capital. Then a test buy. Then follow-through if the market confirms. Traders who wait for public excitement miss that sequence. Traders who monitor wallet funding and first deployment get a much earlier read.
The most expensive mistake in inflow and outflow analysis is believing every large flow means what it appears to mean.
That mistake gets worse when institutions are involved.
A headline says outflows are bearish. Traders react. Then the market does the opposite because the funds never left risk.
A good example came in March 2026, when US Bitcoin ETFs saw $1.32B in inflows after $6.3B in outflows, yet on-chain forensics suggested up to 40% of those apparent outflows were institutional repositioning via OTC desks into DEX pathways, and wallets linked to those moves averaged +22% PnL within 7 days according to AInvest’s bitcoin flow analysis.
If you only read the ETF headline, you got the signal wrong.
Treat institutional flow as a routing problem, not a sentiment label.
Look for these clues:
Whitelisted or clustered wallet behavior
If funds move through familiar routing patterns, don’t assume panic selling.
Short redeployment windows
Capital that reappears quickly in active on-chain venues often reflects repositioning, not exit.
OTC-style transfer structure
Some flows bypass obvious exchange footprints. That doesn’t make them neutral. It makes them harder to classify from one hop.
Big outflow headlines often describe custody changes. Traders make money when they identify strategy changes.
A durable workflow needs restraint. These are the habits worth keeping:
Verify the receiver before acting
A transfer only matters if the destination wallet has behavior you understand.
Respect position sizing
A wallet can be profitable and still run a style that doesn’t fit your liquidity, slippage tolerance, or time horizon.
Track first action after funding
Funding alone is incomplete. The first bridge, swap, or LP move usually reveals more than the transfer itself.
Don’t mirror wallets blindly
Some wallets can sit through volatility you can’t. Others trade illiquid names where your copy entry will be much worse.
Separate operators by strategy
Keep swing wallets, momentum wallets, and narrative snipers in different lists. Mixed cohorts create bad reads.
Use flow as a filter, not a religion
Inflow and outflow are powerful, but they work best when paired with wallet history and execution quality.
Experienced traders stop treating all size as smart money.
Big wallets can be wrong. Funds can be shuffled for administrative reasons. A profitable wallet can change style and lose edge. The discipline is to keep revalidating assumptions.
That’s why the strongest use of inflow and outflow data isn’t prediction in the abstract. It’s decision support around identifiable actors.
When you do that well, you stop reacting to noise and start following capital with context.
If you want to turn inflow and outflow data into a practical trading workflow, Wallet Finder.ai lets you inspect wallet histories, track trades across chains, build watchlists, and monitor when funded wallets deploy capital. That’s the useful step after a flow alert. Not just seeing money move, but seeing what the wallet does next.

A premier DeFi analytics platform empowering traders to discover and analyze profitable blockchain wallets, trades and tokens.

