
Recovery Factor Calculation for Smart Traders
Master the recovery factor calculation to measure a strategy's resilience. Learn the formula, see DeFi examples, and find top wallets with Wallet Finder.ai.

June 20, 2026


Wallet Finder
April 4, 2026
If you’ve spent any time in crypto, you’ve heard ‘IR’ mentioned with Ether. But what is it? The short answer? It’s not just one thing. Depending on who you ask, ‘IR’ can stand for three different metrics: Information Ratio, Interest Rate, and Internal Rate of Return.
Each of these gives you a unique, powerful lens to analyze your Ethereum strategies. Mastering them is key to making smarter, more profitable decisions.
Think about sizing up a pro athlete. You wouldn't just look at their scoring average; you’d also check their defensive stats and their consistency under pressure. It's the same with an ETH strategy. These three ‘IRs’ give you a full 360-degree view of performance, skill, and overall profitability.
Whether you're an active trader hunting for alpha, a HODLer chasing yield, or a long-term investor mapping out your journey, knowing which 'IR' to use is non-negotiable. Let’s break down exactly what each one tells you about your investments.
Before we dive deep, this table gives you a quick snapshot of the three 'IR' metrics and what they're used for. It’s a handy reference for keeping them straight.
Think of this table as your cheat sheet. Now, let’s unpack what these metrics mean in practice.
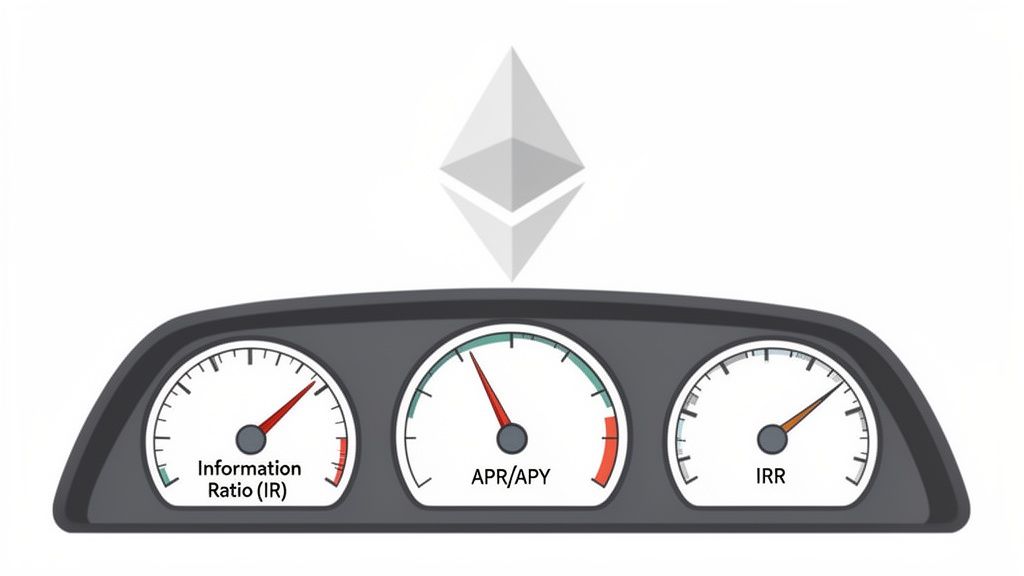
At a high level, each metric answers a very different question about your ETH strategy's performance.
The diagram below helps visualize how these three distinct metrics all fall under the umbrella of ‘IR for Ether’.
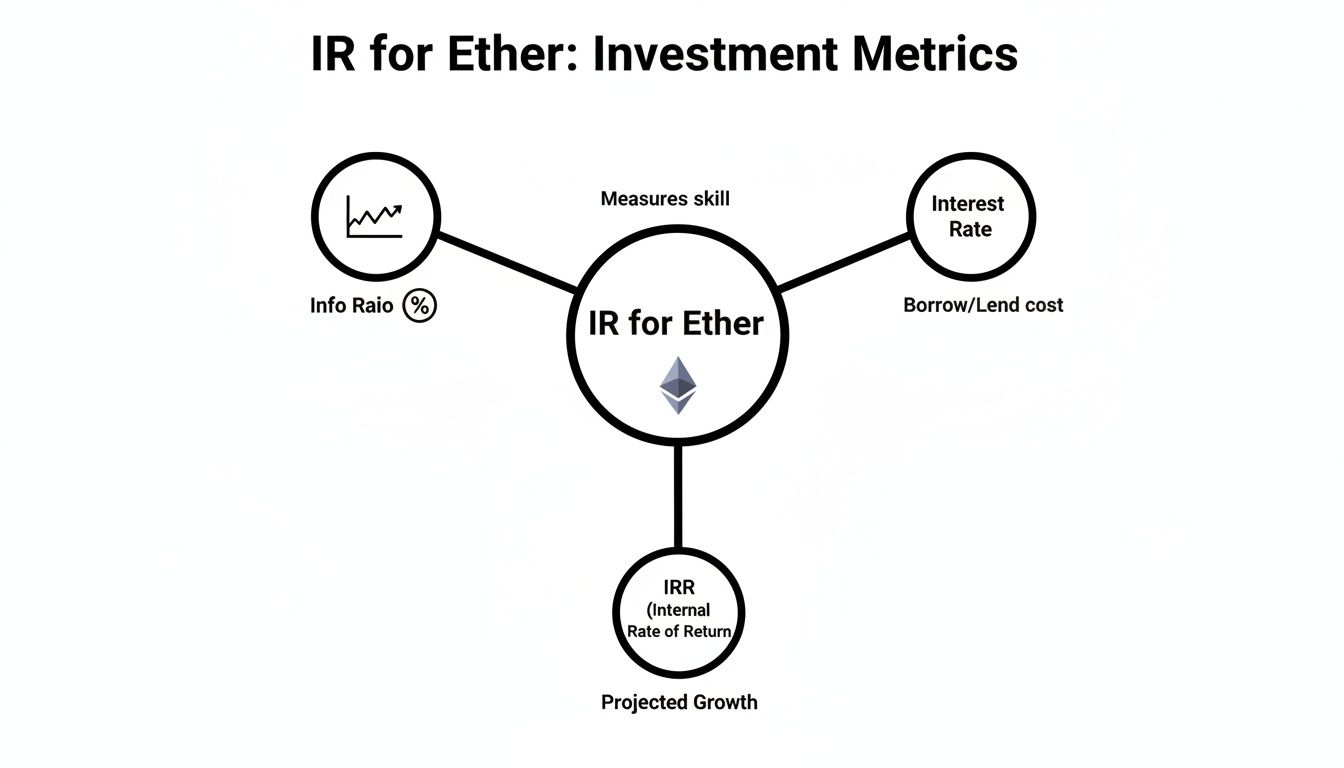
As you can see, while they share the 'IR' acronym, they serve very different purposes. In the sections ahead, we’ll show you how to calculate and apply these metrics using on-chain data and tools like Wallet Finder.ai to find wallets and trades with strong signals.
First up, let’s get into the weeds with the Information Ratio.
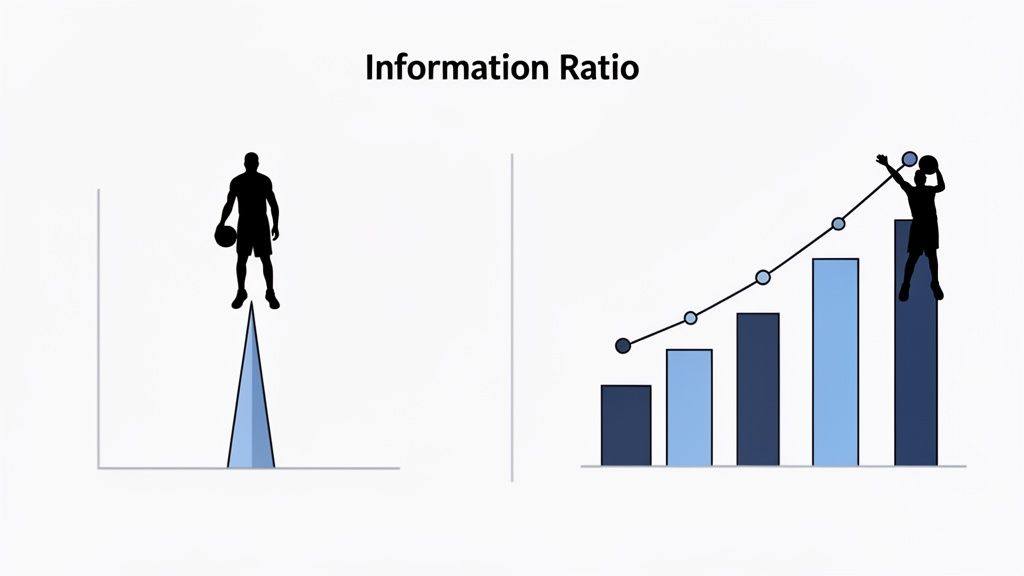
When you're sizing up an Ethereum trader, how do you separate real skill from just a lucky hot streak? The Information Ratio (IR) is the tool pros use to do exactly that. It goes way beyond simple PnL to measure how consistently a trader beats the market.
It’s like comparing two basketball players. Both might score 20 points, but their value is different. One player gets all 20 in an explosive quarter and goes cold. The other nails a steady 5 points every single quarter.
The Information Ratio helps you spot and value that second player—the one whose performance is consistent and reliable. In crypto, that consistency is what we call alpha. It's the proof that a trader has a repeatable edge, not just that they aped into a memecoin at the right time.
The formula might look technical, but it tells a simple story about performance. It puts a number on the "consistency" we're talking about.
Information Ratio = (Portfolio Return – Benchmark Return) / Tracking Error
A higher IR points to a better, more consistent trader. Here's a quick guide to interpreting the score:
Let's break down the parts:
By dividing the extra profit by its volatility, the IR answers a critical question: "For every unit of risk this trader took, how much extra return did they actually generate?"
So, how do you actually use this? When you're on a platform like Wallet Finder.ai hunting for top traders, you're essentially searching for wallets with a high Information Ratio.
Here's what to look for:
A wallet with a 75% win rate that steadily grows month-over-month has a much higher IR than a wallet that's down for 11 months but hits a 100x on one moonshot trade. The first trader has a process you can learn from; the second one just got lucky.
For anyone looking to find and mirror successful strategies, telling the difference is everything. For a deeper dive, check out our guide on the top metrics for analyzing trading profitability.
For most in decentralized finance (DeFi), "IR for Ether" immediately brings one thing to mind: Interest Rate. This is the most visible form of return, usually shown as an Annual Percentage Rate (APR) or Annual Percentage Yield (APY). These metrics are the engines that power yield across the Ethereum ecosystem.
Think of APR as the simple, sticker-price interest. If you stake 1 ETH at a 4% APR, you'll earn 0.04 ETH after one year, without compounding.
APY, on the other hand, includes the powerful effect of compounding—reinvesting your earnings to generate more earnings. This creates a snowball effect, making APY a better measure of potential growth. We have a detailed guide that breaks down the math behind APR vs. APY with a calculator.
Knowing the difference is one thing, but putting it to work is another. Your first step should always be to evaluate this "IR for Ether." Here are common ways to earn a yield:
An attractive APR is the core incentive that convinces users to provide the liquidity that makes DeFi work. It’s your compensation for locking up capital and enabling all the economic activity happening on-chain.
A high APR is tempting, but it never tells the whole story. The advertised rate ignores risk. A smart investor always digs deeper.
Just look at ETH's history. From an all-time low of $0.433 in October 2015 to a peak of $4,946.05, the asset has weathered wild bull and bear markets. This volatility is a macro risk, but protocol-specific risks are often more immediate. You can find more insights on Ethereum's market cycles and historical data on BitInfoCharts.
Whenever you see a juicy APR, ask: "What risks am I taking?" The biggest ones are never in the headline number.
Before you commit your Ether, always balance the advertised interest rate against these downsides. A sustainable 4% APR on a battle-tested protocol is almost always smarter than a flashy 400% APR on a new, unaudited platform.
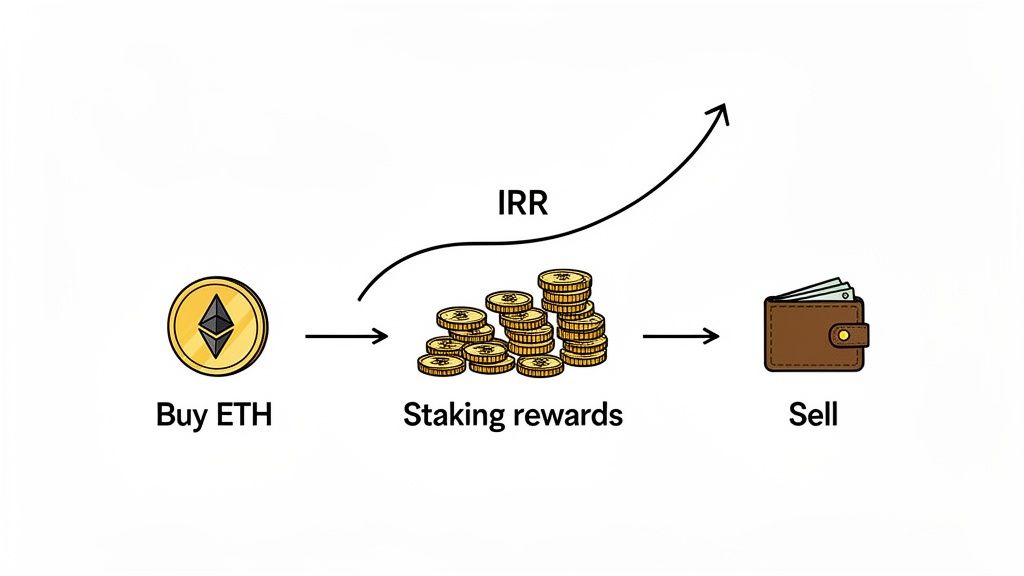
So far, we’ve looked at snapshots. Interest Rate (APR) shows current yield, and Information Ratio sizes up skill. But what about the entire story of your investment? For that, you need the Internal Rate of Return (IRR).
Think of it as the ultimate, all-in-one score for an investment's profitability. It’s the single most powerful metric for evaluating strategies with multiple cash flows over time, like buying ETH, staking it, and eventually selling.
Imagine you buy a rental property. You collect rent (inflows), pay for repairs (outflows), and then sell it. A simple ROI on the final sale ignores the journey. IRR, however, is the magic number—the single annualized growth rate—that accounts for every single transaction.
This concept is a game-changer for evaluating Ethereum strategies. A typical DeFi journey isn't a clean buy-and-sell; it's a series of moves that simple PnL metrics can't capture accurately.
Consider this common path:
IRR ties this whole story together. It answers: "After accounting for every dollar I put in and took out, what was my true, time-weighted annual return?"
This is crucial as Ethereum's ecosystem grows. As of early 2024, Ethereum's market cap hovers around $285 billion, with over 120 million ETH staked. This journey from a 2013 whitepaper to a global financial layer shows why you need robust, long-term metrics like IRR. You can see this growth with Statista's quarterly figures on Ethereum's market cap.
Interest Rate (IR) for Ether is often misunderstood as a simple percentage tied to lending or staking. In reality, it is a dynamic mechanism that reflects the cost of capital, demand for liquidity, and the overall health of the Ethereum ecosystem.
To understand IR properly, you need to stop thinking of it as a static yield and start viewing it as a signal that reveals how money is flowing across DeFi, staking protocols, and on-chain markets.
IR is not controlled by a single entity. Instead, it emerges from multiple layers of activity:
Each of these components influences how much users are willing to pay to borrow ETH or how much they earn by providing it.
When demand for ETH increases — for trading, leverage, or liquidity — interest rates rise. When demand drops, rates fall.
This makes IR a real-time indicator of market appetite for risk and opportunity.
Most users confuse staking yield with lending yield, but they serve completely different purposes.
Staking yield comes from securing the Ethereum network. Validators lock ETH and earn rewards based on network participation and block validation.
Lending yield, on the other hand, comes from lending ETH to borrowers who use it for trading, arbitrage, or liquidity provisioning.
The key difference:
Understanding this distinction is critical because it determines how predictable your returns are.
Interest rates in crypto move quickly because they are tied to liquidity demand, not central bank policy.
For example:
This responsiveness makes IR a powerful signal — but only if you know how to interpret it.
Most users see the number but fail to understand what it represents.
This is where advanced users separate themselves.
Instead of asking:
“How much yield can I earn?”
They ask:
“What is this interest rate telling me about the market?”
A rising IR often signals:
A falling IR can indicate:
This turns IR into a decision-making tool, not just a passive income metric.
Most beginners chase yield.
Advanced users use IR to position themselves before opportunities fully materialize.
For example:
If you can identify these shifts early, you can align your strategy accordingly.
The problem is that most users don’t have visibility into where this demand is coming from.
They see the rate — but not the underlying behavior driving it.
Looking at IR without context is like looking at price without volume.
It gives you partial information, but not enough to act confidently.
To make IR actionable, you need to combine it with:
This is where most strategies break down.
Users rely on isolated metrics instead of connecting the dots across the ecosystem.
There are two ways to approach IR:
Passive approach:
Active approach:
The second approach requires more effort — but it is also where the majority of opportunities exist.
Large wallets — often referred to as “smart money” — play a significant role in shaping IR.
When these wallets:
They create measurable changes in interest rates.
Tracking these movements provides insight into:
Without this visibility, you are reacting late.
The biggest limitation for most users is not knowledge — it is lack of access to real-time, actionable data.
They rely on:
By the time information reaches them, the opportunity is often gone.
This is why IR should never be analyzed in isolation.
It needs to be combined with real-time on-chain intelligence to become useful.
At a surface level, IR looks like a number.
At a deeper level, it reflects:
The shift happens when you stop treating IR as a yield and start treating it as a signal of underlying market dynamics.
Once you make that shift, your perspective on DeFi changes completely.
Don't worry, you won't need a financial calculator. Calculating IRR is best done with a spreadsheet, but the concept is what’s key.
The IRR is the discount rate that makes the Net Present Value (NPV) of all your cash flows—both in and out—equal to zero. In plain English, it’s the breakeven interest rate for your entire investment journey.
Let's make this real with an ETH staking example.
The table below breaks down every move and its associated cash flow.
To find the IRR, you would plug these cash flows into a spreadsheet's IRR function: IRR([-10000, 400, 12900]). Note that the two cash flows in Year 2 are combined ($400 + $12,500).
The result is an IRR of approximately 16.2%.
This single number tells you your entire strategy—the purchase, staking rewards, and final sale—was equivalent to an investment growing at a steady 16.2% year after year. It's the most honest way to measure your strategy's true, time-weighted performance.
Alright, enough theory. Knowing what the different "IRs" for Ether mean is one thing, but using them to find profitable trades is the real goal. This is where we turn concepts into an actionable strategy using on-chain analysis tools.
We'll walk through how to use a wallet tracking platform to pinpoint top-tier wallets based on these principles.
The first signal of a skilled trader—someone with a high Information Ratio—is strong and consistent profit and loss (PnL). You’re looking for a wallet that steadily grows its portfolio without suffering gut-wrenching drawdowns.
Here's how to spot them:
This first filter weeds out lucky one-hit wonders from genuinely skilled operators.
Next, find wallets successfully generating passive income. This is where the Interest Rate (APR/APY) version of "IR" comes in. The clues are in their transaction history.
A wallet's transaction log is a public record of its economic activity. Regular, recurring inflows of specific tokens from known DeFi protocols are a dead giveaway for active staking or yield farming.
Scan their on-chain activity for these patterns:
stETH from Lido.The dashboard below shows how you can track a wallet's holdings and historical performance to spot these income-generating patterns.
This helps you understand a wallet's ability to put its Ether to work for consistent, passive returns.
For the most complete picture, calculate its Internal Rate of Return (IRR). You need a full history of its cash flows. This is where exporting transaction data is a game-changer. Platforms like Wallet Finder.ai let you download a wallet's entire transaction history as a CSV file.
Here's a quick guide to the process:
IRR() function.The resulting percentage is the most accurate measure of that wallet's time-weighted performance. It’s the ultimate "IR for Ether" metric.
Once you've identified a few wallets that are crushing it—showing consistent PnL, regular yield, and a strong IRR—the final step is to act on their moves. Build a watchlist and set up real-time alerts.
This transforms your research from a history lesson into an active copy-trading strategy. By setting up Telegram or push notifications, you can get an instant ping whenever a wallet on your list:
This allows you to mirror their moves, effectively using their expertise to inform your own portfolio.
Now that we’ve broken down the different flavors of "IR for Ether," it's time to see them as a specialized toolkit. Each metric gives you a unique angle. Using them together gives you a real analytical edge.
Think of it like a pro photographer. They don't have one lens; they have a wide-angle for landscapes, a telephoto for distant subjects, and a macro for close-ups. You need to use the right "IR" for the right job.
By combining these metrics, you can build a complete, 3D model of any opportunity.
Each metric is powerful on its own, but the real magic happens when you combine them. A strategy with a high APR is great, but a high APR plus a high IRR, from a wallet with a proven track record (high Information Ratio), is a truly top-tier find.
This is the framework for professional-grade analysis. Now, let’s put this knowledge to work with Wallet Finder.ai—the perfect platform for discovering, tracking, and learning from the most skilled players in the Ethereum game.
It's natural to have questions when digging into the different meanings of "IR for Ether." Here are some clear, straightforward answers.
If you're just starting, your best friend is the Interest Rate (APR/APY). It's the most common and easiest metric to grasp.
You’ll see it everywhere on staking and lending platforms, making it perfect for comparing basic yield opportunities. Think of it as your starting point for understanding how ETH can generate passive income.
Absolutely. Don't get hung up on the formula. The main idea is simple: you’re trying to find wallets that consistently outperform the market (i.e., do better than just holding ETH).
Tools like Wallet Finder.ai do the heavy lifting. Its visual PnL charts and consistency scores act as great stand-ins for a high Information Ratio, helping you spot skilled traders without a calculator.
Wallet Finder is the key to calculating a true Internal Rate of Return because it gives you a complete, exportable transaction history for any public wallet.
Here's the process:
=IRR() function on that list of cash flows. The result is the wallet's true, time-weighted return.No, and this is a crucial point. Treat an incredibly high APR as a warning sign for higher risk. Those eye-popping yields often come with strings attached.
Be skeptical of APRs that seem too good to be true. They might be propped up by:
A steady, sustainable APR on a battle-tested protocol is almost always a smarter bet for your Ether. Always do your homework before you put your funds in.
IR for Ether represents the cost of borrowing ETH or the reward for supplying it within decentralized finance ecosystems. It is not fixed and changes dynamically based on supply and demand for liquidity across lending platforms and staking protocols. When demand for ETH increases, interest rates tend to rise, reflecting higher competition for capital. When demand decreases, rates fall as liquidity becomes more available. This makes IR a real-time indicator of market activity rather than just a passive yield number. Understanding IR helps you interpret how capital is moving within Ethereum.
No, IR for Ether and staking rewards are fundamentally different, even though both generate yield. Staking rewards come from validating transactions and securing the Ethereum network, making them relatively stable and protocol-driven. IR, on the other hand, is market-driven and influenced by borrowing demand, trading activity, and liquidity needs. This means IR can fluctuate significantly over short periods, while staking rewards tend to remain more consistent. Confusing the two can lead to incorrect expectations about returns. Each serves a different role in a broader crypto strategy.
IR changes frequently because it is directly tied to real-time market behavior rather than centralized policy decisions. When traders borrow ETH for leverage, liquidity provision, or arbitrage, demand increases and pushes rates higher. During periods of low activity or market uncertainty, borrowing demand drops, causing rates to decline. Events like token launches, memecoin cycles, or high volatility can trigger sudden spikes in IR. This responsiveness makes IR highly sensitive to market conditions. As a result, it acts as a live signal of how aggressively capital is being deployed.
IR can be used as an early indicator of market activity and potential opportunity zones. A rising IR often signals that traders are borrowing aggressively, which can precede volatility or new trends. By monitoring these shifts, you can position yourself before opportunities become widely recognized. However, IR alone is not enough — it must be combined with other signals like wallet activity and token flows. This allows you to distinguish between temporary spikes and meaningful trends. When used correctly, IR becomes a timing tool rather than just a yield metric.
A higher IR is not inherently better — it depends on your strategy. For lenders, a higher IR means increased returns, but it may also indicate higher risk or market overheating. For borrowers, a higher IR increases costs and reduces profitability. In some cases, extremely high IR levels signal excessive leverage, which can lead to sharp corrections. This makes it important to interpret IR within context rather than chasing high yields blindly. Sustainable strategies focus on consistency and timing rather than maximum rates.
The biggest mistake is treating IR as a standalone metric without understanding the context behind it. Many users chase high yields without analyzing why rates are elevated or whether the conditions are sustainable. Others ignore IR entirely and miss early signals of market shifts. Another common mistake is reacting too late, after the opportunity has already played out. IR should be used alongside other data points to build a complete picture of market behavior. Without this context, it becomes misleading rather than useful.
While you can view IR on most DeFi platforms, using it effectively requires deeper insight into what is driving those rates. Advanced users combine IR data with on-chain activity, wallet behavior, and liquidity movements to gain a clearer picture. Without this context, IR remains just a number without actionable meaning. Tools that surface real-time wallet activity and capital flows make it significantly easier to interpret IR signals. This allows you to move earlier and make more informed decisions. The difference is not access to data, but how that data is connected and used.
Ready to turn these insights into action? Wallet Finder.ai gives you the tools to discover, track, and mirror the strategies of top-performing Ethereum wallets. Find traders with high IR signals and start making data-driven decisions today at https://www.walletfinder.ai.

A premier DeFi analytics platform empowering traders to discover and analyze profitable blockchain wallets, trades and tokens.

