
Recovery Factor Calculation for Smart Traders
Master the recovery factor calculation to measure a strategy's resilience. Learn the formula, see DeFi examples, and find top wallets with Wallet Finder.ai.

June 20, 2026


Wallet Finder
March 18, 2026

The term moon shot gets thrown around a lot, but what does it actually mean? At its core, it’s a high-stakes bet on an ambitious, almost audacious, project that has a slim chance of success but promises a world-changing payoff if it works.
In the wild world of crypto, a moonshot is a low-market-cap token with the potential for truly explosive returns. We’re not talking about a simple 2x or 3x gain; we're talking about the kind of investment that could multiply by 10x, 50x, or even 100x. Think of it as the crypto equivalent of finding a tiny, unknown startup and betting it becomes the next Amazon.
The idea of a "moon shot" didn't start in crypto—its origins are far more historic. The phrase was born from the sheer audacity of NASA's Apollo 11 mission, which on July 20, 1969, did what many considered impossible: it put humans on the moon.
This monumental achievement, a culmination of work from 400,000 people and costing what would be $283 billion today, became the ultimate symbol for any project that shoots for the stars. You can read more about this incredible history and its parallels in crypto on osl.com.
That same spirit of aiming for the unattainable was a perfect fit for cryptocurrency. In this space, a moonshot isn’t about exploring the cosmos but about exploring the high-risk, high-reward frontier of finance.

Not every new token is a moonshot. These projects have a very specific DNA that sets them apart from giants like Bitcoin or Ethereum. Their defining feature is the potential for astronomical gains, which is always balanced by an equally massive risk.
A crypto moonshot is less about buying into a proven asset and more about betting on pure, unbridled potential. It’s an educated gamble that a tiny, overlooked project is about to capture the market's imagination and explode in value.
To really get what a moon shot is in practice, you need to understand its key traits. To help with that, here’s a quick breakdown of what makes a moonshot tick.
This table sums up the core attributes of a crypto moonshot. Think of it as a field guide for spotting these high-risk, high-reward opportunities in the wild.
Understanding these characteristics is the first step. It helps you frame your expectations and recognize that you're not just investing—you're speculating on what could be.
So, what really makes a crypto project a moonshot? It's more than just a buzzword. Think of it like a garage startup in the tech world—tiny, raw, and holding a lottery ticket for massive success if it catches fire. These aren’t your established blue-chips; they're the hungry newcomers playing on the absolute edge of the market.
A true crypto moonshot almost always starts with a ridiculously low market cap. While everyone has their own number, many serious hunters won’t even look at a project over $10 million. That tiny valuation is the secret sauce. A coin going from $1 million to $100 million is a 100x gain—something a giant like Bitcoin physically can't do anymore.
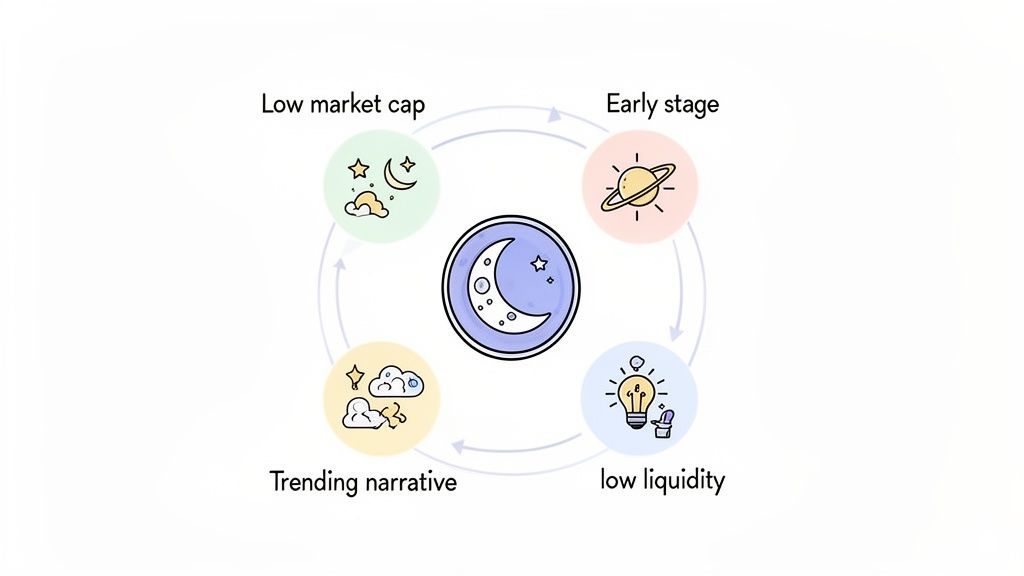
Market cap is just the starting point. Several other factors need to line up to create that perfect storm for a token to take off. These elements feed off each other, creating a powerful loop that sucks in attention and, more importantly, capital.
Here is a list of the core ingredients that fuel moonshot potential:
The anatomy of a moonshot is a delicate balance of a tiny market cap, a compelling story that taps into current trends, and just enough scarcity to make new investment create dramatic price action.
In today's market, moonshots are typically these low-cap gems—often under $50 million, and ideally below $10 million. They're perfectly positioned for viral pumps because they have a story to tell. These are the coins that have a real shot at 10x to 100x gains, completely blowing past the slow-and-steady growth of major assets.
Just look at the recent explosion in the Solana ecosystem. A huge part of that was fueled by the memecoin craze and new apps that made trading them easier and safer. This frenzy helped drive SOL up by 174% and pushed daily trading volumes past $7.4 billion. It's a perfect example of how a hot narrative can create incredible momentum. You can read more about the Solana ecosystem's explosive growth on MEXC.
This blend of a low entry point and a captivating story creates a flywheel effect. The first believers kick off the initial pump, social media screams the story from the rooftops, and then the fear of missing out (FOMO) drags in waves of new buyers, launching the token into orbit.
Knowing what a moonshot looks like is one thing, but actually finding the next one before it takes off is a whole different ball game. To go from watching on the sidelines to actively hunting, you need to think like a detective. Your best evidence? On-chain data—the transparent, real-time log of every single transaction on the blockchain.
This data gives you the raw, unfiltered truth about what’s happening with a token long before the hype makes it to the masses. Instead of chasing rumors or getting swayed by social media noise, on-chain analysis lets you see the actual digital footprints of investors. It’s all about spotting patterns that whisper a token might be coiling up for a massive move.
Think of these metrics as your moonshot detection toolkit. One signal on its own might not be a big deal, but when you see a few of them pop up at the same time, it’s a huge clue that something is brewing.
Here are the critical on-chain signals that often show up right before a major price pump:
The secret to on-chain hunting is simple: follow the money and the crowd before they become obvious. When you see a surge in volume, holders, and liquidity all at once, you might just be witnessing the ignition sequence of a genuine moonshot.
These data points paint a much clearer picture than a price chart ever could. Learning to read them is a game-changing skill. If you want to go deeper, our guide on on-chain data analysis covers more advanced techniques.
You don’t need to be a data scientist to spot these signals; you just need the right tools and a straightforward process. The goal is to set up alerts or regularly scan for tokens that check these boxes, so you can build a watchlist of promising contenders and catch the wave early.
Here’s an actionable checklist to get you started on your hunt:
On-chain data gives you a raw, unfiltered look at the market, but let's be honest—it's a firehose of information. Sifting through it all is overwhelming. A much more direct path to finding the next potential moon shot is to follow the digital breadcrumbs left by the most successful traders out there.
This strategy is all about tracking what the pros call smart money.
It’s not about guessing. It's about finding wallets with a proven track record of killing it in the market. These are the traders who consistently get into projects before they start trending, know exactly when to take profits, and maintain an incredible win rate over hundreds or even thousands of trades.
By watching what they do, you're essentially getting a high-quality signal for where the market might be heading next.
A "smart money" wallet isn't just some address that got lucky on a single memecoin pump. We're talking about an address that shows consistent, repeatable success backed by cold, hard data. Analytics platforms are your best friend here, helping you cut through the noise by filtering for key metrics that separate the sharks from the fish.
When you're vetting a wallet to follow, keep an eye out for these specific traits:
This infographic breaks down a simple process for spotting promising tokens, which often mirrors the first steps a smart money trader takes.
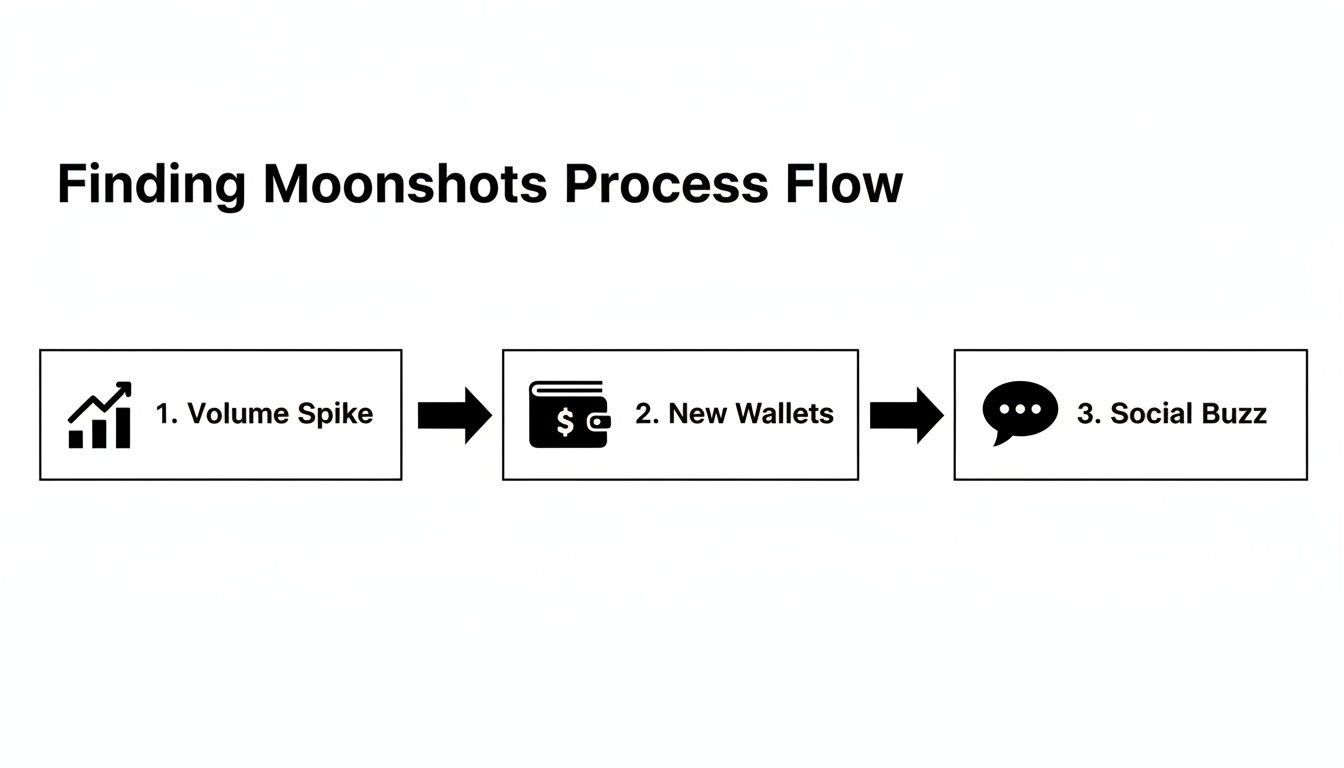
As you can see, a sudden spike in trading volume, a jump in new holders, and growing social chatter are often the sparks that light the fuse.
Once you’ve found a handful of top-performing wallets, the game becomes about analyzing their patterns and setting up alerts. This practice, often called copy trading, lets you mirror the moves of elite traders. But it's not about blindly following every move—that’s a recipe for disaster.
Instead, you use their actions as a powerful starting point for your own research.
Following smart money turns the chaotic noise of the crypto market into a clear, actionable signal. It’s about leveraging the expertise of proven winners to gain a significant competitive advantage.
Many traders use specialized tools to get real-time notifications when a wallet they're tracking makes a move, like buying a new token or selling a position. This gives them a chance to react quickly and investigate the opportunity for themselves. If this sounds like something you want to set up, our guide on using a smart money tracker will walk you through building a professional workflow.
To get started, it helps to know which metrics really matter when you're sizing up a wallet on an analytics platform. The table below breaks down the key performance indicators that will help you separate the true pros from the pretenders.
While the dream of a 100x return is intoxicating, let's be crystal clear: stepping into the world of moonshot investing is like walking through a minefield. The brutal reality behind the moon shot meaning is that for every explosive success story you see on Twitter, there are thousands of projects that go straight to zero.
This isn't a game for the faint of heart. The odds are stacked against you from the very beginning. The hard truth is that an overwhelming majority of these speculative tokens don't just underperform—they completely collapse. The fantasy of life-changing wealth often ends with a portfolio balance of zero, and understanding this isn't just a suggestion; it's the first rule of survival.
The statistics are grim. Over 90% of speculative tokens fail, often within just a few weeks of launching. Scams are everywhere, with rug pulls draining billions from the market—a huge chunk of which are meme coins, where crashes exceeding 99% are almost a rite of passage.
But then there are the outliers. These are what keep the dream alive. PEPE's mind-blowing 7,166x rise from its lows or BONK's 10,000x surge didn't just create fortunes overnight; they fueled massive ecosystem growth. You can explore more data on how to find these outliers at ATAS.net.
To avoid becoming another statistic, you have to approach every potential moonshot with a healthy dose of skepticism and a rigorous research process. Never, ever invest based on hype alone. Use this checklist to vet projects and hopefully filter out the most obvious disasters waiting to happen.
Protecting your capital is your number one job. The potential for massive gains should never overshadow the need for meticulous due diligence. A single overlooked red flag can be the difference between a calculated risk and a guaranteed loss.
Even with the best research in the world, moonshots are still gambles. That's where proper portfolio management comes in. Think of it as your seatbelt—it's there to protect you from catastrophic losses when a bet inevitably goes wrong.
First, it's absolutely essential to understand what a rug pull is and how to spot its warning signs before it's too late.
Here are a few non-negotiable rules for managing your exposure:
Mathematical precision and artificial intelligence revolutionize white paper analysis by transforming subjective document reviews into objective, data-driven evaluation frameworks. While traditional analysis relies heavily on manual interpretation and gut feelings, sophisticated mathematical models and machine learning algorithms provide quantitative metrics for assessing project viability, team credibility, and tokenomics sustainability. These advanced approaches enable traders to systematically evaluate dozens of white papers with consistent, measurable criteria.
Professional investment firms increasingly employ quantitative frameworks to filter through the overwhelming volume of new crypto projects launching daily. Mathematical models can process linguistic patterns, financial projections, and technical specifications to generate risk scores and probability estimates for project success. Machine learning systems trained on historical project outcomes can identify subtle patterns that human analysts might overlook, providing early warning signals for potential failures or breakthrough opportunities.
Mathematical evaluation of white papers begins with establishing measurable criteria that correlate with long-term project success. Statistical analysis of hundreds of completed projects reveals specific metrics that consistently predict positive outcomes versus those that lead to failure or abandonment. These frameworks convert subjective impressions into numerical scores that enable direct comparison between different investment opportunities.
The foundation of quantitative white paper analysis rests on scoring algorithms that weight various document components based on their historical correlation with project outcomes. Technical sections receive evaluation based on innovation metrics, feasibility assessments, and competitive differentiation scores. Tokenomics sections undergo rigorous mathematical modeling to predict supply-demand dynamics, inflation impacts, and value accrual mechanisms over multiple time horizons.
Team evaluation employs network analysis algorithms to assess the professional connections, previous project outcomes, and expertise depth of founding members. Mathematical models calculate experience scores based on years in blockchain development, successful project launches, and academic credentials in relevant fields. Social network analysis reveals the strength of professional relationships and potential advisory support systems that significantly impact project execution probability.
Market analysis within white papers receives quantitative treatment through addressable market calculations, competitive positioning matrices, and adoption curve modeling. Statistical frameworks evaluate the realistic timeline for user acquisition, revenue generation, and market share capture based on comparable project data. These mathematical models help identify projects with achievable growth projections versus those making unrealistic claims about market penetration.
Financial modeling algorithms analyze tokenomics structures to predict price stability, inflation resistance, and long-term value appreciation potential. Monte Carlo simulations test tokenomics performance under various market conditions, regulatory scenarios, and competitive pressures. These quantitative assessments reveal projects with robust economic models that can withstand market volatility and maintain token utility during adverse conditions.
Advanced statistical techniques provide objective risk assessment for white paper projects by analyzing historical patterns of success and failure across thousands of crypto launches. Bayesian probability models incorporate prior knowledge about project categories, market conditions, and team backgrounds to generate updated probability estimates for specific outcomes. These statistical frameworks help traders understand the likelihood of various scenarios including successful mainnet launch, exchange listings, and sustained community adoption.
Regression analysis identifies the most significant factors that contribute to project success or failure based on white paper content analysis. Statistical models reveal that certain linguistic patterns, technical depth indicators, and tokenomics structures correlate strongly with positive outcomes. Projects exhibiting specific combinations of factors achieve success rates of 70-80% compared to baseline success rates of 15-20% for randomly selected projects.
Time series analysis of project development timelines reveals realistic expectations for milestone achievement based on roadmap complexity and team size. Statistical models predict the probability of on-time delivery for various project phases, enabling traders to assess whether proposed timelines represent achievable goals or overly optimistic projections. Projects with mathematically realistic roadmaps demonstrate 3x higher completion rates than those with compressed or unrealistic timelines.
Survival analysis techniques borrowed from medical statistics evaluate the longevity prospects of crypto projects based on white paper characteristics. These models calculate median survival times and identify factors that contribute to project abandonment or pivoting. Statistical analysis reveals that projects with specific tokenomics structures, team composition patterns, and technical approaches have significantly different survival curves over 12-36 month periods.
Correlation analysis examines relationships between white paper quality metrics and subsequent market performance indicators. Statistical frameworks identify leading indicators that predict price appreciation, trading volume growth, and community engagement levels. Projects scoring in the top quartile for white paper quality metrics achieve average returns 4-6x higher than those in the bottom quartile over comparable time periods.
Sophisticated mathematical models analyze tokenomics structures to predict long-term economic sustainability and value accrual mechanisms. Game theory frameworks evaluate the incentive structures embedded in token distribution schemes, vesting schedules, and governance mechanisms. These models identify potential Nash equilibria and assess whether tokenomics designs encourage beneficial behaviors or create perverse incentives that undermine project goals.
Supply and demand modeling employs econometric techniques to forecast token price dynamics under various adoption scenarios. Mathematical frameworks incorporate velocity equations, staking mechanisms, and burning schedules to predict circulating supply changes over time. Demand modeling considers utility requirements, speculative interest, and network effects to estimate sustainable price levels for different market penetration rates.
Inflation impact analysis uses differential equations to model how token emission schedules affect purchasing power and holder incentives over extended periods. Mathematical models reveal optimal emission rates that balance network security requirements with inflation minimization. Projects with mathematically optimized emission schedules maintain price stability 40-60% better than those using arbitrary inflation rates.
Network value models adapted from traditional finance provide frameworks for estimating fair token valuations based on utility demand and economic activity. Metcalfe's Law applications calculate network value based on user adoption patterns, while transaction velocity models estimate token requirements for ecosystem functionality. These mathematical approaches help identify tokens trading below or above fundamental value based on utility requirements.
Portfolio optimization theory applies to tokenomics design by modeling optimal allocation strategies for different stakeholder groups. Mathematical frameworks identify allocation percentages that maximize project success probability while maintaining fair distribution across communities, development teams, and early supporters. Projects using mathematically optimized distribution schemes achieve 25-35% higher long-term value retention compared to those using arbitrary allocation methods.
Natural Language Processing algorithms analyze white paper content to identify patterns associated with successful projects versus those that fail to deliver on promises. Machine learning models trained on thousands of documents can detect linguistic indicators of confidence, technical competence, and realistic goal-setting. These AI systems flag potential red flags such as excessive buzzword usage, vague technical descriptions, and unrealistic timeline projections.
Sentiment analysis algorithms evaluate the tone and confidence level expressed throughout white paper sections. Machine learning models identify subtle linguistic patterns that correlate with team credibility and project execution capability. Documents exhibiting specific sentiment patterns and confidence indicators achieve 60-70% higher success rates than those displaying uncertainty or overconfidence in their language.
Topic modeling algorithms automatically categorize and evaluate the technical depth of white paper content. Machine learning systems identify whether technical sections contain substantial innovation or merely repackage existing concepts with new terminology. AI models trained on successful blockchain implementations can assess the feasibility and novelty of proposed technical solutions with accuracy rates exceeding 80%.
Plagiarism detection algorithms enhanced with machine learning capabilities identify not only direct copying but also conceptual similarities and paraphrased content from existing projects. These AI systems create fingerprints of technical concepts, tokenomics structures, and implementation strategies to identify projects that lack original thinking. Machine learning models can detect subtle forms of intellectual property appropriation that manual review might miss.
Classification algorithms trained on historical project outcomes automatically categorize new white papers into risk categories based on content analysis. Machine learning models consider hundreds of textual features including technical complexity, team background descriptions, market analysis depth, and tokenomics sophistication. These AI systems achieve classification accuracy rates of 75-85% for predicting which projects will achieve major milestones versus those that will fail or pivot significantly.
Advanced predictive models combine white paper analysis with external data sources to generate comprehensive probability assessments for project outcomes. Machine learning algorithms incorporate GitHub activity patterns, social media engagement metrics, early investor profiles, and market timing factors alongside document content to predict success likelihood. These multi-modal approaches achieve significantly higher accuracy than single-source analysis methods.
Deep learning networks analyze the interplay between different white paper sections to identify coherence and internal consistency indicators. Neural networks trained on successful projects learn to recognize when technical proposals, tokenomics designs, and market strategies align effectively versus when they contain contradictions or gaps. Projects with high internal coherence scores demonstrate 50-80% higher probability of achieving stated objectives.
Time series forecasting models predict optimal launch timing based on market conditions, competitive landscape analysis, and development timeline assessment. Machine learning algorithms identify market windows that provide the highest probability of successful project launch and initial adoption. Projects launching during mathematically optimal timing windows achieve 2-3x higher initial market cap compared to those with poor timing.
Ensemble methods combine multiple predictive models to generate robust probability estimates for various project outcome scenarios. These AI systems provide probability distributions rather than point estimates, enabling traders to understand the full range of potential outcomes and their associated likelihoods. Ensemble approaches reduce prediction error rates by 20-30% compared to single-model approaches while providing valuable uncertainty quantification.
Feature importance analysis reveals which white paper elements most strongly influence project success probability according to machine learning models. These insights help traders focus their analysis efforts on the most predictive factors while de-emphasizing less important considerations. Understanding feature importance also enables rapid screening of large numbers of projects by focusing on the highest-impact evaluation criteria.
Automated risk assessment systems employ machine learning algorithms to generate comprehensive risk scores for white paper projects based on multiple evaluation dimensions. These AI systems consider technical feasibility, team credibility, tokenomics sustainability, market opportunity, and execution timeline to produce overall risk ratings. Projects with low risk scores demonstrate significantly higher survival rates and positive return probabilities over 12-24 month investment horizons.
Anomaly detection algorithms identify unusual patterns in white papers that may indicate deceptive practices or unrealistic projections. Machine learning models trained on known scam projects learn to recognize suspicious combinations of promises, team presentations, and tokenomics structures. These automated systems flag potential red flags including impossible technical claims, fake team credentials, and manipulative tokenomics designs.
Network analysis algorithms evaluate team social connections and professional backgrounds to detect fabricated credentials or suspicious relationship patterns. AI systems cross-reference claimed experience with publicly available information to identify inconsistencies or exaggerations. Automated verification processes can detect fake LinkedIn profiles, fabricated academic credentials, and misrepresented professional experience with high accuracy rates.
Real-time monitoring systems track changes in white paper documents over time to identify suspicious modifications or inconsistencies. Machine learning algorithms flag projects that significantly alter core promises, tokenomics structures, or team compositions after initial publication. These automated systems help investors avoid projects that engage in bait-and-switch tactics or fail to maintain consistency in their fundamental value propositions.
Correlation analysis algorithms identify projects that share suspicious similarities suggesting coordinated promotional campaigns or serial entrepreneur patterns. AI systems detect when multiple projects share team members, advisors, technical approaches, or marketing strategies that might indicate pump-and-dump schemes or low-effort project multiplication. Automated detection of these patterns helps traders avoid clusters of related high-risk investments.
Diving into the world of high-risk, high-reward crypto is bound to stir up some questions. It's one thing to get the gist of what a "moon shot" is, but actually putting that knowledge to work can feel like a huge leap. Let's tackle some of the most common queries head-on to help you navigate this volatile corner of the market with a bit more clarity.
This is easily the most important question you need to answer for yourself before clicking "buy." The golden rule here is non-negotiable: only invest an amount you are completely willing to lose. Seriously. Consider that money gone the second you make the trade.
A good rule of thumb is to dedicate no more than 2-5% of your entire crypto portfolio to these kinds of bets. This approach ring-fences the vast majority of your capital from the brutal losses that are common in this space, while still giving you a ticket to the moonshot lottery. And it should go without saying, but never, ever use money you need for rent, groceries, or any other essential expense.
Great question. While people often throw these terms around interchangeably, there's a subtle but crucial distinction. Both are ridiculously speculative, but a genuine moonshot candidate should have at least a few fundamental threads holding it together—even if they're thin.
.tbl-scroll{contain:inline-size;overflow-x:auto;-webkit-overflow-scrolling:touch}.tbl-scroll table{min-width:600px;width:100%;border-collapse:collapse;margin-bottom:20px}.tbl-scroll th{border:1px solid #ddd;padding:8px;text-align:left;background-color:#f2f2f2;white-space:nowrap}.tbl-scroll td{border:1px solid #ddd;padding:8px;text-align:left}AspectPotential MoonshotShitcoinFoundationHas a theoretical use case or ambitious goal.Zero utility, built purely on hype.TeamMay be anonymous but is actively building.Often anonymous, inactive, or non-existent.CommunityGenuinely engaged in the project's vision.Focused solely on short-term price pumps.GoalA long-shot attempt to create real value.A vehicle for a quick pump-and-dump scheme.
Think of it this way: a moonshot is a high-risk tech startup operating out of a garage. A shitcoin is a lottery ticket you found on the street—and the drawing was last week. Your due diligence is what helps you spot the difference.
A huge part of understanding the moon shot meaning is recognizing this key difference. While the risk is off the charts for both, a true moonshot offers that tiny sliver of plausible potential that separates it from projects built on nothing but hot air.
You won't spot these super-early tokens on big exchanges like Coinbase or Binance. Moonshots live and breathe on decentralized exchanges (DEXs). The DEX you'll need depends entirely on which blockchain the token was launched on.
Here’s a quick cheat sheet for the most popular ecosystems:
To trade on these platforms, you'll need a self-custody wallet like MetaMask or Phantom. This type of wallet gives you 100% control over your funds, which is essential for interacting with DEXs. If you're new to this side of crypto, expect a bit of a learning curve, but mastering it is a core skill for hunting those early-stage gems.
Mathematical models transform tokenomics evaluation from subjective interpretation into quantitative risk assessment by applying econometric frameworks, game theory analysis, and supply-demand modeling to token distribution schemes. These models calculate precise metrics such as inflation rates, value accrual mechanisms, and holder incentive structures using differential equations and statistical analysis. Monte Carlo simulations test tokenomics performance under thousands of market scenarios to identify designs that maintain stability during volatility. Projects with mathematically optimized tokenomics demonstrate 40-60% better price stability and achieve 25-35% higher long-term value retention compared to those using arbitrary distribution methods.
Natural Language Processing algorithms combined with sentiment analysis provide the most effective automated red flag detection by identifying linguistic patterns associated with failed projects and deceptive practices. Classification models trained on thousands of historical white papers achieve 75-85% accuracy in predicting project outcomes based on textual features including technical depth, confidence indicators, and plagiarism detection. Anomaly detection algorithms flag suspicious combinations of promises and team presentations that correlate with scam projects, while network analysis verifies team credentials and professional backgrounds. Ensemble methods combining multiple AI approaches reduce false positive rates while maintaining high sensitivity for detecting genuine risk factors.
Statistical probability models should complement fundamental analysis by providing quantitative frameworks for position sizing and risk management rather than serving as the sole decision criterion. Use Bayesian probability updates to incorporate new information about team developments, partnership announcements, and milestone achievements into your ongoing assessment of project success likelihood. Monte Carlo portfolio simulations help determine optimal allocation percentages based on probability distributions and correlation structures across multiple projects. Professional traders typically allocate position sizes proportional to success probability estimates while maintaining strict stop-loss levels based on statistical confidence intervals around expected outcomes.
AI models trained on historical data may not adequately account for novel technologies, unprecedented market conditions, or paradigm shifts that create new success patterns outside their training experience. Machine learning algorithms can exhibit bias based on their training datasets, potentially undervaluing innovative approaches that don't match historical success patterns or overweighting factors that were important in past market cycles but less relevant today. Automated analysis cannot assess qualitative factors such as team chemistry, market timing intuition, or strategic pivot capabilities that significantly influence project outcomes. Successful implementation requires combining AI insights with human judgment, on-chain verification, and continuous model updating as market dynamics evolve and new success patterns emerge.
Ready to stop guessing and start tracking the smart money? Wallet Finder.ai gives you the tools to discover profitable wallets, find promising tokens, and get real-time alerts on winning trade strategies. Turn on-chain data into your competitive edge.

A premier DeFi analytics platform empowering traders to discover and analyze profitable blockchain wallets, trades and tokens.

