
Recovery Factor Calculation for Smart Traders
Master the recovery factor calculation to measure a strategy's resilience. Learn the formula, see DeFi examples, and find top wallets with Wallet Finder.ai.

June 20, 2026


Wallet Finder
May 11, 2026
You're up on a trade, price is still grinding higher, and your feed is full of people calling for one more leg. Then the chart stalls, volume shifts, a few large wallets start unloading, and what looked like a healthy pullback turns into a real trend change. By the time most traders accept the reversal, the easy exit is gone.
That's the problem with reversal signals. They're useful, but they're easy to misuse. Traders either react too early and get chopped up, or too late and give back a large part of the move.
The edge doesn't come from finding one perfect indicator. It comes from reading context, confirmation, and participation together. In crypto, that means combining classic chart work with what's happening on-chain.
Most traders don't miss reversals because they're lazy. They miss them because they over-trust a single signal.
A divergence appears, so they short too early. A support break happens, so they assume the trend is dead. RSI gets overbought, so they fade momentum that still has room to run. All of those setups can work. All of them can also fail badly when market conditions change.
The biggest mistake is treating reversal signals as universal. They aren't. A signal that works well in a directional market often falls apart in chop. A 2025 TradingView backtest discussed by LuxAlgo found that LuxAlgo signals posted a 42% win rate in ranging markets versus 61% in strong trends, with 2.1x higher drawdowns in the ranging regime. The same analysis notes that 68% of crypto sessions in that sample fell into the lower-ADX, rangebound bucket.
That lines up with what experienced traders see in practice. Reversals are hardest to trade when price has no real structure and everyone keeps forcing meaning onto noise.
Three failure modes show up again and again:
Practical rule: Don't trade a reversal signal just because it exists. Trade it when market structure, momentum, and order flow all tell the same story.
The traders who catch turns more consistently tend to ask better questions:
| Question | Weak setup | Stronger setup |
|---|---|---|
| Where is price? | Mid-range | At a major prior level |
| What is momentum doing? | No clear exhaustion | Divergence or momentum rollover |
| What is volume doing? | Flat or unclear | Expansion at the turn |
| What are wallets doing? | No shift in behavior | Distribution or accumulation showing up on-chain |
That's the working framework throughout this guide. Not prediction. Validation.
A reversal signal is evidence that the current trend is losing control and a move in the opposite direction may be starting.
The easiest way to think about it is a car. A pullback is the driver tapping the brakes. A reversal is the driver turning onto a different road. Traders lose money when they confuse the first with the second.

A pullback usually stays inside the existing structure. Higher highs and higher lows may remain intact in an uptrend. A reversal breaks that structure. Momentum weakens, key levels fail or flip, and the participants driving the move start changing behavior.
A quick checklist helps separate the two:
This distinction matters because the trade plan is different. In a pullback, you're usually looking to rejoin the trend. In a reversal, you're either exiting, hedging, or taking the other side.
Crypto traders now have two broad signal sets to work with. One comes from the chart. The other comes from the chain.
| Attribute | Technical Signals | On-Chain Signals |
|---|---|---|
| What they measure | Price, momentum, volume, structure | Wallet behavior, token flows, realized activity |
| Best use | Timing entries and exits on a chart | Detecting behavior shifts before they're obvious in price |
| Strengths | Clear visual setups, broad adoption, easy replay testing | Shows what larger participants are actually doing |
| Weaknesses | Can lag, can whipsaw in ranges | Can be noisy without context, requires filtering |
| Ideal trader | Chart-focused swing trader or day trader | DeFi trader, copy trader, token-specific researcher |
| Best result | Better when combined with confirmation | Better when anchored to technical structure |
Reversal signals work best when price action tells you where to care, and on-chain behavior tells you whether the move is real.
That's the core idea. Technical analysis gives you the map. On-chain analysis shows who's moving.
Technical reversal signals still matter because they reveal crowd behavior in real time. Buyers get exhausted, sellers step in, momentum fades, and structure starts to break. The chart records all of it.
One of the fastest ways to spot that shift is the candle itself.
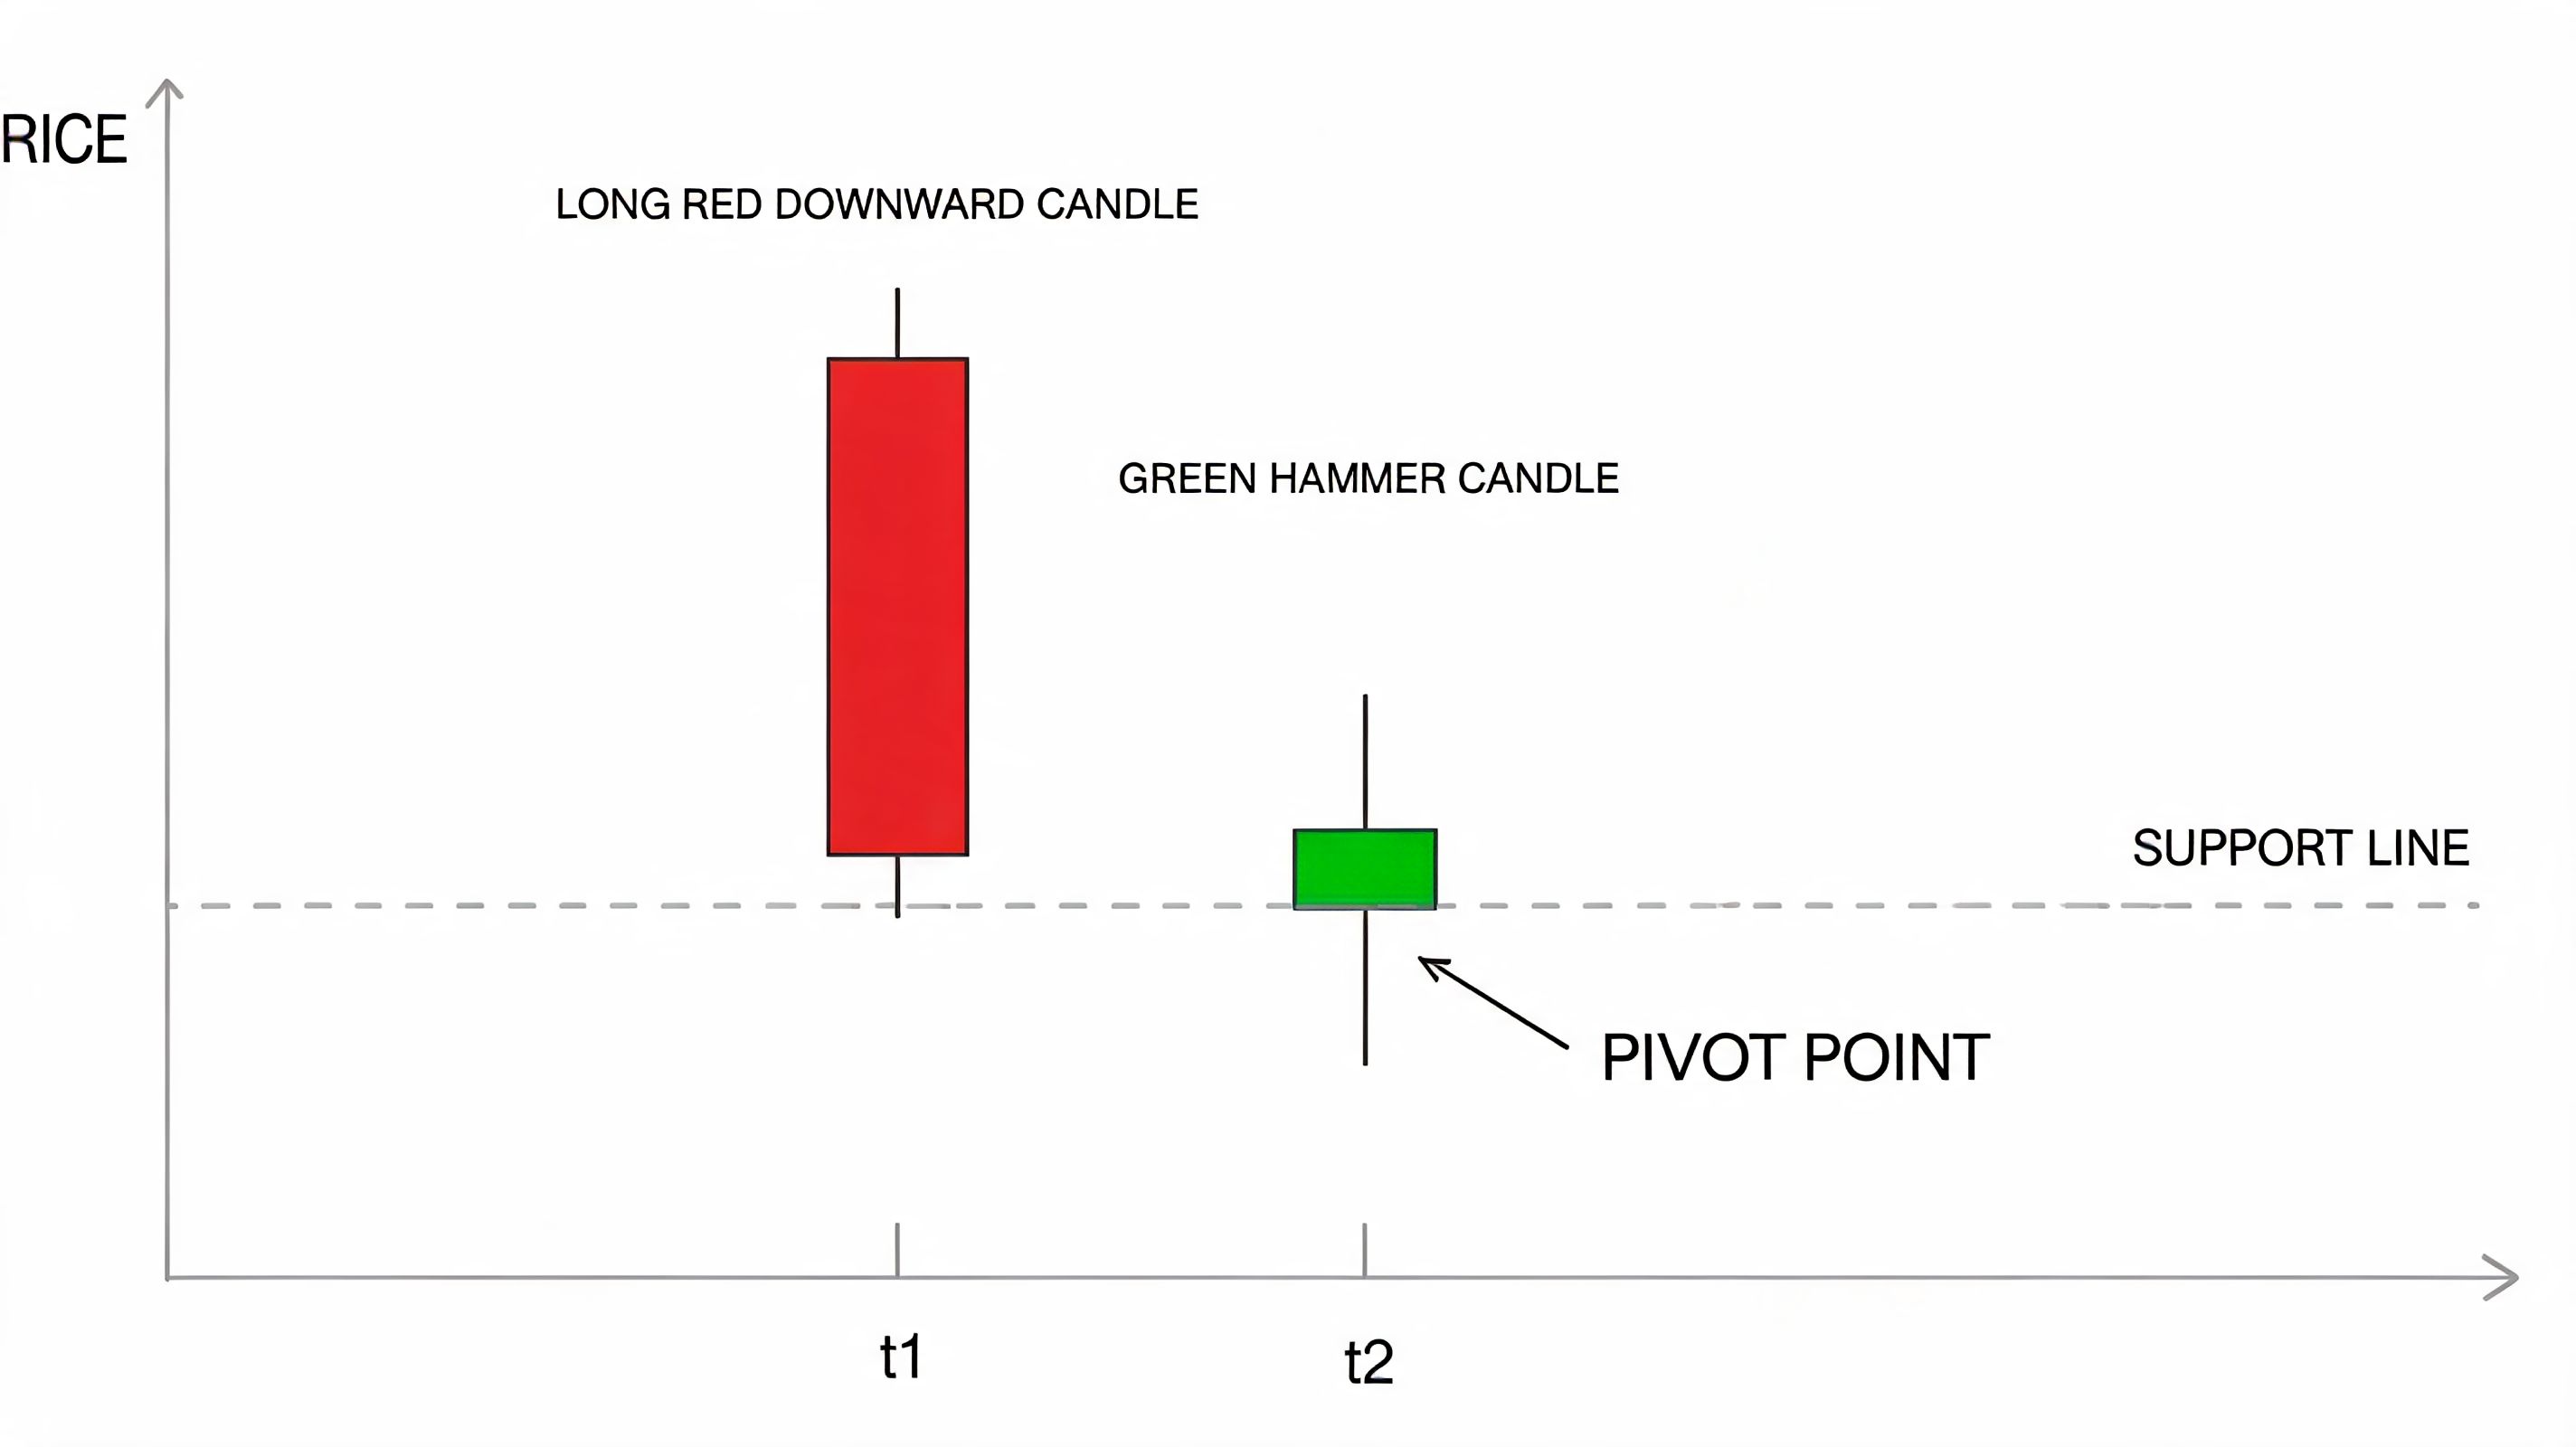
Candlestick reversals matter because they compress a short battle into one visible signal. A hammer shows sellers pushed hard and failed to keep price down. A bearish engulfing candle shows buyers lost control fast.
That doesn't mean every candle is tradable. It means the candle is your first alert to pay attention.
If you want a sharper read on how these patterns form and where they fail, this guide to candlestick charts for cryptocurrency is worth reviewing alongside live charts.
Useful candle-based reversal clues include:
A bearish divergence forms when price makes a higher high but momentum does not. That gap tells you the trend is still moving, but with less force behind it.
According to Pepperstone's guide to reversal trading, a bearish divergence on oscillators like RSI has preceded reversals in 68% of cases on major forex pairs. The same source notes that reliability rises to 75% when confirmed with a MACD histogram contraction.
That combination is practical because it answers two separate questions:
If price is still printing highs but momentum can't follow, treat the trend as vulnerable. Don't assume immediate reversal, but stop assuming continuation is safe.
A lot of traders misuse divergence by fading every overextended move. Better use is selective. Look for it after a long directional trend, near prior resistance, or into a blow-off push.
Here's a useful visual walkthrough before moving deeper into pattern reading:
Patterns work when they represent a clear change in market control.
A head and shoulders signals repeated failure to push higher. A double top shows a second attempt at resistance that doesn't attract fresh demand. An inverse head and shoulders often reflects a bottoming process where sellers lose force across repeated tests.
These patterns aren't magic shapes. They're visual evidence that one side is no longer getting the same response from the market.
Without volume, reversal setups are easier to fake. Price can move on thin participation and snap right back.
The strongest technical turns usually show one of two things:
| Signal type | What it suggests |
|---|---|
| Climactic volume at a key level | Forced exit, capitulation, or aggressive profit-taking |
| Diverging volume near fresh highs | Fewer participants are willing to keep pushing the trend |
When you combine structure, momentum divergence, and volume behavior, technical reversal signals become far more usable. On their own, each can mislead. Together, they start to tell a coherent story.
Charts tell you what price did. On-chain data helps you see who did it.
That difference matters most near turning points. In crypto, especially in smaller ecosystems and fast-moving DeFi markets, the wallets that drive the move often change behavior before the chart looks broken. You'll see distribution, liquidity rotation, or shrinking conviction from top performers while most traders are still drawing trendlines.

A strong token trend often has a recognizable on-chain footprint. Early accumulation comes from a cluster of capable wallets. Later, as attention broadens, those same wallets start scaling out while retail flow keeps chasing.
That's where on-chain reversal work gets valuable. You're not just reading candles. You're watching whether the participants who timed the move well are still pressing, holding, or exiting.
Useful things to monitor include:
For traders getting familiar with this workflow, it helps to understand the basics of checking on-chain activity before trying to interpret reversal behavior from wallet flows alone.
One of the clearest newer patterns in DeFi is the wallet exhaustion cascade. This isn't just a price stall. It's a coordinated-looking shift where top wallets begin unloading aggressively into peak attention.
According to Binance Square's discussion of recent on-chain reversal behavior, in the last 12 months, wallet exhaustion cascades have been identified when the top 1% of wallets dump over 70% of their holdings within four hours of a token's peak DEX volume. The same source says these signals appeared 2 to 3 hours before traditional indicators like RSI or MACD, with 78% accuracy on Base and Solana ecosystem tokens.
That matters because many meme and DeFi tops don't form cleanly. They often look strong right until they fail. If you wait for textbook confirmation on price alone, you may be reacting after the highest-quality exit window is gone.
The chart often shows exhaustion late. Wallet behavior can show intent earlier.
The sequence often unfolds like this:
That's why on-chain signals are best treated as an early warning layer, not a standalone entry trigger.
They're not perfect, and traders should be honest about where they fail:
The practical use isn't replacing technical analysis. It's front-running the moment when the chart starts to admit what wallets already signaled.
A single reversal signal isn't enough. It can alert you, but it shouldn't convince you.
Professionals build a trade around confluence. That means multiple independent signals point to the same conclusion. A bearish divergence is one piece. A failed retest is another. A shift in wallet behavior adds more weight. The more those pieces align, the less you're guessing.
The first thing to validate is location. Reversal signals in random parts of the chart are lower quality than signals at obvious decision points.
One of the cleanest validation tools is the support or resistance flip. A LuxAlgo article on support and resistance in reversal trading notes that when a broken support level is retested and holds as new resistance, the pattern has shown a 62% success rate on major indices. The same source says confirmation with a moving average crossover can improve filtering of false breaks.
That's useful because it gives you a practical sequence:
A lot of fake reversals die at step two.
Instead of asking whether one signal is valid, ask whether the whole setup is coherent.
| Confirmation layer | What to look for |
|---|---|
| Structure | Break of trend support, neckline, or prior swing level |
| Retest behavior | Failed reclaim, rejection wick, lower high |
| Momentum | RSI or MACD rollover instead of continued expansion |
| Participation | Volume expansion on the break or clear on-chain distribution |
| Market regime | Trend market or range-bound chop |
Checklist mindset: If your reversal thesis needs one perfect candle to work, it's too fragile.
The traps are familiar:
A better approach is to grade setups before acting.
Use three buckets:
That keeps you from trading every reversal signal you see. Most of them aren't worth your risk.
The cleanest way to use reversal signals in crypto is to run the same workflow every day. Not a loose idea. A repeatable scan.
For DeFi and memecoin trading, the chart alone often reacts after the key wallets have already acted. That's why a practical process starts with wallet behavior, then moves to the chart for execution.
Don't track random large holders. Track traders with evidence of skill.
A smart money tracker workflow should help you focus on wallets with strong realized trading behavior, consistent timing, and recent activity in the ecosystems you trade. The point isn't size alone. It's quality of decisions.
Look for wallets that show:
Once you've identified useful wallets, narrow the field. Too many traders follow too much data and end up reacting to noise.
A focused watchlist should include:
| Watchlist group | Why it matters |
|---|---|
| Top-performing wallets | Likely to show early accumulation or distribution |
| Token-specific clusters | Multiple smart wallets acting on the same asset matters more than one |
| Recent sellers into strength | Useful for spotting late-stage exhaustion |
| Wallets returning after a flush | Helpful for confirming whether a pullback is actually a reversal or just a reset |
Most of the edge sits in this dynamic. Price can still look healthy while the wallets that drove the move are already reducing exposure.
The practical trigger is a change in behavior:
That aligns well with the broader volume logic from traditional analysis. Forex Tester's write-up on reversal patterns notes that volume climaxes at key levels preceded reversals 82% of the time in a long backtest, and that in DeFi, declining volume during a memecoin pump flags a 78% probability of a bearish reversal.
On-chain, that translates into a simple question: are the strongest wallets still participating, or are they using retail demand as exit liquidity?
Don't short just because wallets sold. Use the chart to time the trade.
A practical execution checklist:
The best reversals don't need you to predict the exact top. They let you act once behavior and structure finally agree.
Most traders don't know which reversal signals work for them because they don't track the setup components.
Review each trade for:
That feedback loop matters more than adding another indicator.
Reversal trading is attractive because the reward can be large if you catch a trend change early. It's also dangerous because early often looks exactly like wrong.
That's why risk management matters more here than in trend-following. Even a strong setup can fail. A breakout can reclaim. A wallet cluster can distribute early while price squeezes higher first. If your sizing is reckless, the quality of the signal won't save you.
Good reversal traders aren't trying to be prophets. They're trying to lose small when the turn doesn't happen and press only when the evidence stacks up.
That changes your behavior fast. You stop taking every divergence. You stop shorting every overbought chart. You stop buying every flush because it “feels” exhausted.
You wait for the market to prove something.
Trade reversals with humility. They offer strong upside when you're right, but they punish certainty when you're early.
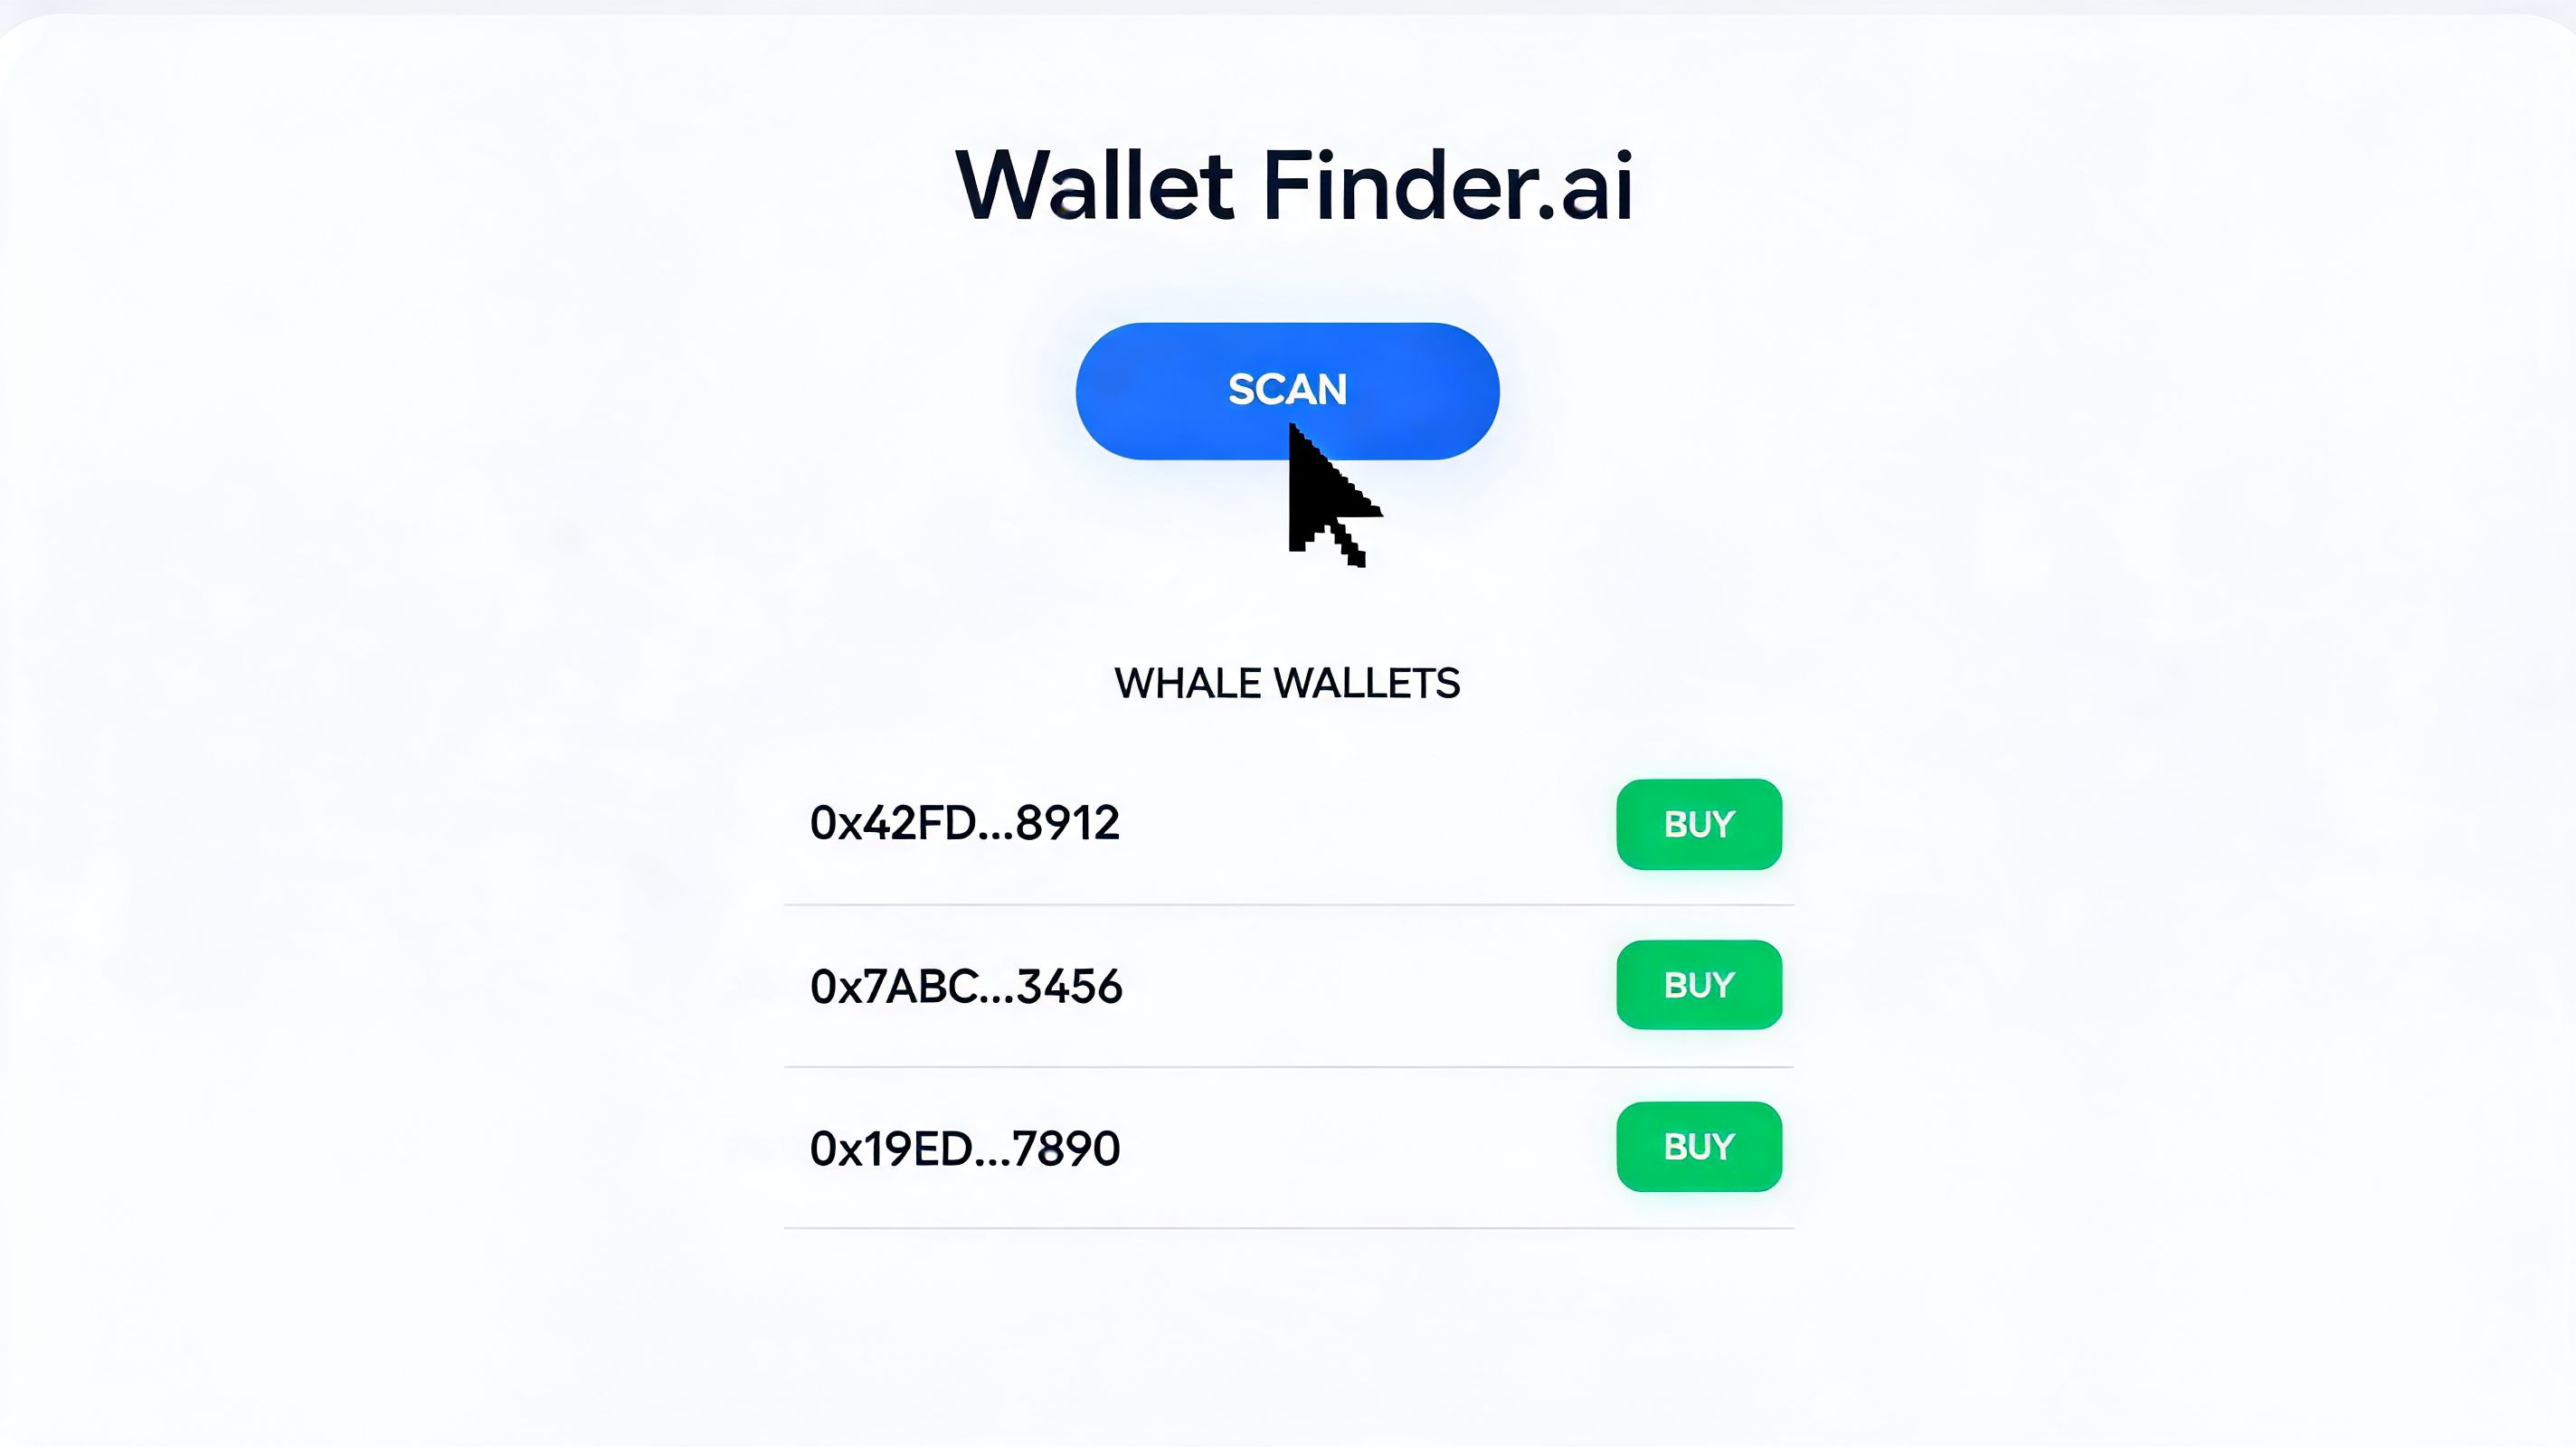
If you want to apply this process in real time, Wallet Finder.ai helps you track profitable wallets, monitor smart money behavior across chains, and catch the on-chain shifts that often appear before classic reversal signals show up on the chart.

A premier DeFi analytics platform empowering traders to discover and analyze profitable blockchain wallets, trades and tokens.

