
Recovery Factor Calculation for Smart Traders
Master the recovery factor calculation to measure a strategy's resilience. Learn the formula, see DeFi examples, and find top wallets with Wallet Finder.ai.

June 20, 2026


Wallet Finder
November 26, 2025

Tracking ROI (Return on Investment) in DeFi wallets can help you measure how well your investments are performing. DeFi ROI is trickier than traditional investments because of crypto's volatility, gas fees, and risks like impermanent loss. Here’s a simple breakdown of the key metrics you can use to evaluate DeFi wallet performance:
These metrics give you a clearer picture of your wallet's performance and help you make smarter investment choices. Tools like Wallet Finder.ai simplify tracking and analysis, saving you time and effort.

Wallet Finder.ai is a specialized analytics platform built specifically for data-focused DeFi traders. It tackles the tricky task of measuring ROI in decentralized finance by analyzing wallet behaviors, trade histories, and performance trends. This helps users make smarter, more informed investment decisions.
Wallet Finder.ai provides ranked wallet statistics, making it easy to sort wallets by net profit and spot the most successful trading strategies. Unlike basic portfolio trackers, it offers advanced filtering options and customizable dashboards. These dashboards give users a tailored view of wallet activity and performance. Additionally, users can set up custom alerts to track specific wallet movements and export their data in Excel or CSV formats for offline analysis. To better understand when a trade actually starts generating returns, our Break-Even Analysis for Crypto Trades guide walks through how to calculate true profitability after fees and slippage.
Wallet Finder.ai offers real-time ROI tracking by directly integrating with user wallets. This ensures accurate, up-to-the-minute data, allowing traders to monitor their own performance while also gaining insights from top-performing wallets. The platform also helps users dig into critical trading decisions, such as when to enter or exit a trade and how to size their positions. Traders can even create custom watchlists to keep an eye on high-performing wallets. These tools make it easier to analyze ROI and sharpen investment strategies effectively.
Net ROI percentage is a key metric that reveals how much profit or loss your DeFi wallet has generated. It offers a simple way to gauge whether your decentralized finance strategies are working or need adjustments. Let’s break down how to calculate this and why it matters.
The formula for net ROI percentage is:
ROI = [(Current value of investment – Initial cost of investment) ÷ Initial cost of investment] × 100.
Here’s an example: If you invested $1,000 in a DeFi protocol and your portfolio is now worth $1,300, the ROI is ($1,300 - $1,000) ÷ $1,000 = 0.30, or 30%. A positive ROI means you’ve made a profit, while a negative ROI signals a loss.
In DeFi, the calculation can get tricky. You need to include all costs - like gas fees, transaction fees, and protocol charges - to ensure your net ROI reflects the actual profit after expenses.
Net ROI percentage is a vital tool for making decisions in the DeFi world. It helps investors measure the success of their investments by comparing current performance to initial costs. By keeping track of this metric, you can figure out which protocols, tokens, or strategies are working best and decide how to reallocate your funds or time your market moves.
For instance, companies that have adopted blockchain technology report a 41% positive ROI, showing the potential for strong returns in this space. However, like any metric, it has its challenges.
While net ROI percentage is useful, it has some drawbacks. One major issue is that it doesn’t consider risk. A high ROI on a volatile asset might come with much more risk compared to a lower ROI from a stable protocol. Additionally, ROI calculations often ignore the time factor - a 20% return in one month is very different from the same return over two years. Ignoring costs like gas fees can also inflate results, making comparisons between investments less reliable.
There’s also the fact that ROI focuses only on immediate financial returns. It might overlook added perks like bonus tokens or governance rights. Plus, the calculation can vary depending on what costs investors choose to include or exclude. Lastly, ROI doesn’t account for opportunity costs, meaning even a positive ROI might not reflect the best use of your capital.
Understanding both the strengths and weaknesses of net ROI percentage can help you use it more effectively in your investment strategy.
Net ROI gives you a snapshot of overall gains, but if you're looking for a deeper understanding of how well your investment strategy is performing, the Time-Weighted Rate of Return (TWR) is the way to go. TWR measures the compound growth of your investments, completely ignoring the timing of deposits and withdrawals. This makes it especially useful for evaluating performance in volatile markets like DeFi, where cash flow timing can skew simpler ROI calculations.
TWR breaks down the investment period into smaller segments, calculates returns for each segment, and then links them together to give a cumulative result. The formula looks like this:
TWR = [(1 + HP₁) × (1 + HP₂) × … × (1 + HPₙ)] − 1
Here, HP (holding period return) is calculated as:
HP = (End Value − (Initial Value + Cash Flow)) / (Initial Value + Cash Flow)
For example, say you start with $5,000, which grows to $5,500. Then, you add $2,000, and your portfolio grows to $8,100. The holding period returns for the two months would be 10% and 8%, respectively, resulting in a two-month TWR of 18.8%.
TWR is a powerful tool when analyzing DeFi wallets or comparing strategies. It focuses purely on how well the investments themselves perform, without being affected by the timing of cash flows. Maxwell Guerra from J.P. Morgan Wealth Management explains:
"The time-weighted rate of return excludes the timing influence of the cash flows, so it's particularly useful when large additions or withdrawals are made".
This makes TWR ideal for evaluating fund managers or benchmarking your strategy against market indices, as it zeroes in on the actual returns generated by the investments.
While TWR provides valuable insights, it's not without its flaws. One major drawback is that it doesn't reflect your actual dollar returns. As Investopedia points out:
"While widely used, TWR does not reflect an investor's actual dollar-weighted return and may not be ideal for personal portfolios with frequent cash flows".
TWR can also be tricky to calculate if there are lots of transactions. It doesn’t differentiate between single or multiple investments, and its accuracy can be affected by stale pricing or incorrect valuations. Plus, it might feel counterintuitive when large deposits or withdrawals occur, as it focuses solely on performance without factoring in the impact of cash flow timing.
Despite these challenges, TWR remains a valuable metric for isolating the performance of your investment strategy, especially in environments where consistency and strategy evaluation are key.
Annualized ROI takes the concept of returns a step further by factoring in time, making it easier to compare investments with different durations. For instance, it allows you to fairly evaluate a three-month yield farming strategy alongside a two-year staking position.
The formula for annualized ROI is:
Annualized ROI = ((1 + ROI)^(1/n) – 1) × 100%
Here, n represents the investment's duration in years. Unlike standard ROI, this formula adjusts for the time period, offering a more balanced view of performance.
Let’s look at some examples:
Another example: If a $100 investment grows to $150 over ten years, the annualized ROI is just 4.14%. But if that same growth happens in one year, the ROI jumps to 50%. This calculation highlights how time impacts the perception of returns.
Annualized ROI gives a clearer picture of how investments perform over time. By converting returns into an annual rate, you can easily compare different strategies. For example, it helps you weigh a six-month yield farming plan against a three-year DeFi index fund. It also incorporates the time value of money, giving a more accurate measure of investment performance.
To put this into perspective, the historical average annual ROI for the S&P 500 is about 10% per year. If you invested $1,000 and it grew to $1,500 over three years, the annualized ROI would be approximately 14.47% per year.
While annualized ROI is incredibly useful, it’s not without its flaws. It often focuses on short-term results and may overlook long-term factors like inflation. Additionally, comparing investments with vastly different time frames can still be tricky since inflation and other variables aren’t fully accounted for.
Recognizing these limitations helps refine how we evaluate performance metrics, especially in the fast-evolving world of DeFi.
When evaluating the performance of your DeFi wallet, it's essential to go beyond basic ROI figures. Understanding realized and unrealized gains can give you a clearer picture of your investments. These metrics not only show how well your portfolio is performing but also play a role in tax planning and managing your assets.
Realized gains are the profits you lock in when you sell an asset, while unrealized gains are the "on-paper" profits from assets you're still holding.
The math behind these metrics is simple:
For example, if you bought Bitcoin for $10,000 and its value climbed to $60,000 but you sold it at $58,000, you'd see both unrealized and realized gains. After accounting for fees, the realized gain reflects the actual profit you made, while the unrealized gain shows the potential profit before selling.
These calculations help separate profits you've secured from those that are still dependent on market conditions.
Tracking both realized and unrealized gains gives you a well-rounded view of your wallet's performance.
By comparing these two metrics, you can evaluate the timing and effectiveness of your investment strategy. For instance, if you frequently see unrealized gains disappear before you sell, it might be time to rethink your exit strategy.
Tracking these gains in the DeFi space comes with its own set of hurdles.
DeFi's notorious volatility can turn unrealized profits into losses in the blink of an eye. Additionally, tax rules in the U.S. add another layer of complexity. Realized gains are taxable events, while unrealized gains generally aren't. Long-term capital gains (assets held for more than a year) are taxed at rates of 0%, 15%, or 20%, depending on your income. Short-term gains, on the other hand, are taxed as regular income.
DeFi transactions, such as swaps, deposits, yield farming, and liquidity provision, make tracking gains even trickier. Each transaction - often spread across multiple blockchains - requires meticulous documentation. Mismanaging these records can lead to inaccurate calculations of gains and losses. Crypto's rapid price swings also demand frequent updates to ensure fair value accounting.
As Gordon Law aptly puts it:
"DeFi tax accounting is some of the most complicated accounting on earth. Professional help is highly recommended to avoid IRS penalties."
Transaction and gas fees might seem small, but they can quietly chip away at your DeFi returns. Understanding how they work and their impact is key to making smart investment decisions.
Gas fees are the costs of executing transactions on blockchain networks. Every swap, liquidity provision, or reward claim comes with a gas fee. In fact, the DeFi sector alone accounts for about 60% of all gas usage on Ethereum. For serious DeFi investors, managing these fees is not optional - it's essential.
"Gas fees are the tolls on your DeFi journey. In busy lanes like on Ethereum, these fees can quickly escalate from minor charges to significant sums, directly affecting your investment returns." - Exponential DeFi
Gas fees are calculated using this formula: Gas Fee = Gas Units Used × (Base Fee + Priority Fee). Over time, these fees add up and can significantly affect your total returns.
Here’s a real-world example: In March 2024, about 99,000 Ethereum users collectively spent $7.3 million on gas fees. That averages out to $74 per user for transactions on the Ethereum mainnet. For active DeFi users, the costs can be even higher.
Take Alice and Bob, for instance. Both started with $10,000. Alice used traditional on-chain strategies with monthly auto-compounding and ended up paying $1,300 in gas fees over the year. Bob, on the other hand, optimized his transactions and paid just $24. By the end of the year, Alice’s portfolio was over $1,200 smaller than Bob’s - all because of the extra fees. This shows how gas fees directly influence your ROI.
Gas fees can make or break your DeFi strategy, especially if you have a smaller portfolio or trade frequently. High fees don’t just reduce your returns in the short term - they compound over time, dragging down your overall performance.
The problem gets worse during network congestion. When activity spikes, gas fees can skyrocket, making small transactions too expensive and forcing you to hold positions longer than planned. This can disrupt your strategy, especially if you need to rebalance or act quickly.
For yield farmers, the impact is even clearer. Let’s say you’re earning 10% APY, but you’re spending 5% of your portfolio on gas fees each year. Suddenly, your net return is cut in half to just 5%.
While understanding gas fees is important, managing them comes with its own set of challenges.
One major issue is the unpredictable nature of blockchain congestion. Gas prices can swing wildly depending on network demand, making it tough to budget for transaction costs or time your trades effectively.
Different blockchains also have vastly different fee structures. For example:
This variation adds complexity when comparing strategies across multiple chains.
During major market events, you might face a tough choice: pay high fees to act quickly or risk missing opportunities. Plus, tracking fees across various protocols and chains can be tricky. Every interaction - whether swapping, staking, or claiming rewards - has its own gas cost, and these can add up faster than you might expect.
To get a clearer picture of your returns, it’s important to plan strategically. Tools like Wallet Finder.ai can help you optimize transaction timing and costs, ensuring you’re not leaving money on the table. By managing fees effectively, you can protect your portfolio and maximize your DeFi gains.
When it comes to DeFi (Decentralized Finance), staking and liquidity provision are two major ways investors can earn returns. To truly understand their performance, it’s important to measure these yields accurately. These activities provide a consistent income stream, and keeping track of them is key to getting the most out of your crypto wallet.
To calculate yields from staking and liquidity provision, two main metrics are used: Annual Percentage Rate (APR) and Annual Percentage Yield (APY). APR shows the yearly return without factoring in compounding, while APY includes the effect of compounding. If you regularly reinvest your rewards, APY gives a clearer picture of your potential earnings.
Rewards can come from a mix of sources, like trading fees, governance token payouts, and protocol incentives. These rewards depend on several factors, such as the size of the liquidity pool, how long you participate, and the overall activity within the protocol. Many platforms also use strategies like "longer pays better" or "bigger pays better" to encourage longer or larger contributions of liquidity.
For instance, Uniswap V3 allows liquidity providers to focus their funds on specific price ranges. This approach improves capital efficiency and boosts potential rewards. Additionally, higher trading activity in a pool generates more fees for providers, and some platforms sweeten the deal by distributing governance tokens alongside trading fees. Understanding these calculations is essential for assessing how these strategies impact your overall returns.
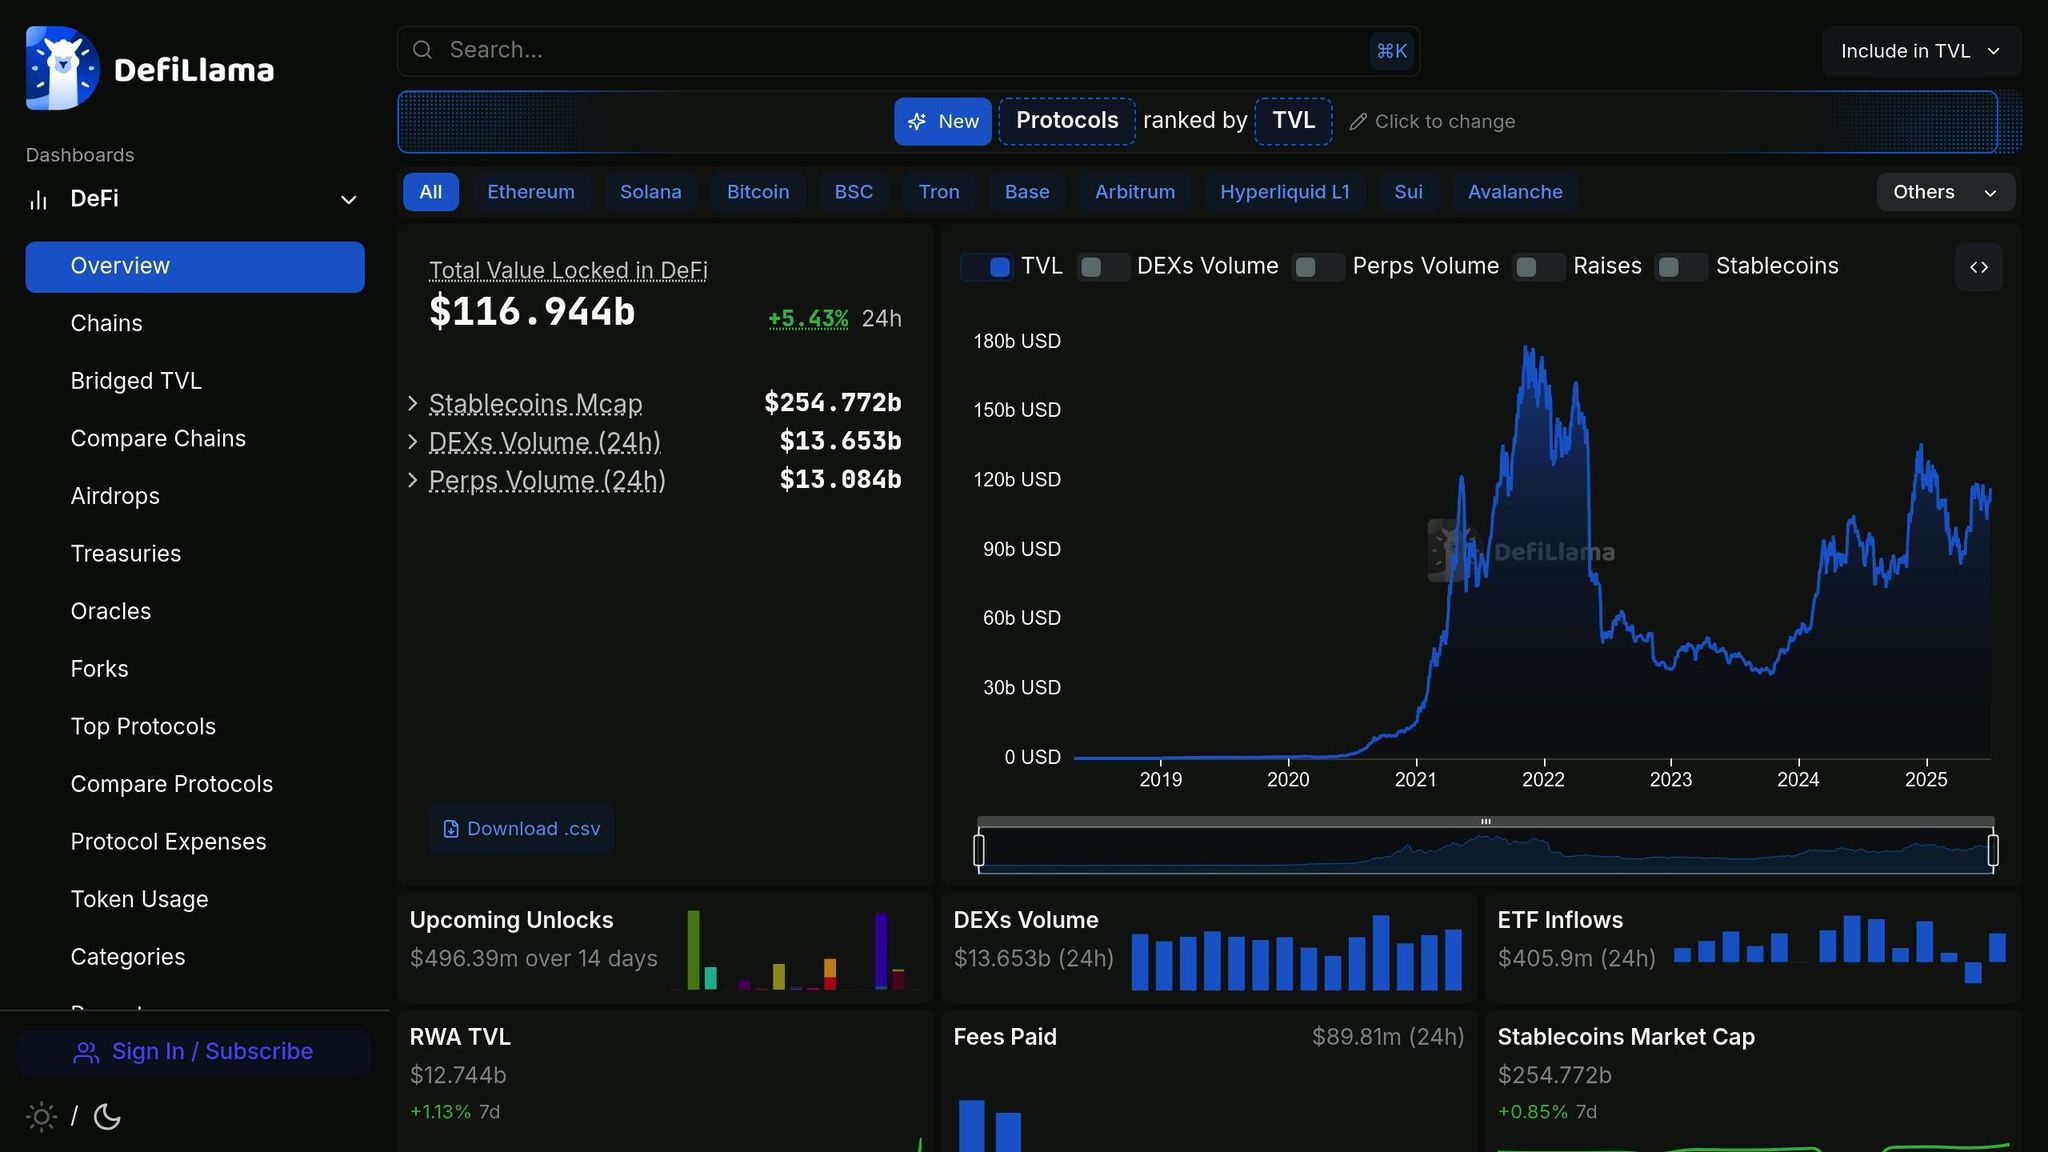
Tracking yields from staking and liquidity provision is crucial because they allow you to earn rewards and interest on your crypto assets. By January 2025, DeFi’s total value locked (TVL) reached a whopping US$129 billion, highlighting the growing opportunities for earning yields.
The returns can vary widely depending on the strategy. Staking typically offers annual yields between 5% and 15%, while yield farming in liquidity pools can sometimes go over 100%. For example, in 2024, 77% of DeFi yields - totaling over US$6 billion - came from actual fee revenue.
"Yield farming is the practice of maximizing returns on crypto holdings through a variety of DeFi liquidity mining methods." - Cryptopedia Staff
These yields not only benefit individual investors but also improve the liquidity of DeFi projects, making funds more accessible. By keeping an eye on these yields, you can make smarter decisions to get the best staking rewards. Staking rewards usually come from participating in blockchain consensus, while liquidity provision yields are earned by supplying capital to trading platforms.
While the potential rewards can be tempting, staking and liquidity provision come with risks. One major risk is impermanent loss, which happens when the value of staked assets changes significantly. Additionally, staked assets are often locked, meaning you might miss out on profits if prices suddenly rise . There’s also the risk of smart contract vulnerabilities, which could lead to losing your funds. As of now, staking contracts hold over US$10 billion, making them attractive targets for hackers.
Liquidity issues can also make it hard to exit your position, leaving you stuck in underperforming strategies. Liquid staking offers more flexibility by providing derivative tokens you can use elsewhere, but it often comes with lower rewards and added complexity.
To manage these risks, it’s smart to diversify your investments across multiple pools and platforms. Always research a platform’s security measures, audits, and reputation before committing your funds. Tools like Wallet Finder.ai can help you track your yields across different protocols and fine-tune your staking strategies, giving you the best chance to maximize returns while keeping risks under control.
When evaluating long-term performance, wallet activity and retention metrics add an extra layer of insight beyond just financial returns. These metrics focus on how engaged users are with a wallet and how likely they are to stick around, which directly impacts transaction volume and profitability over time.
To measure user engagement, metrics like Daily Active Wallets (DAW), Weekly Active Wallets (WAW), and Monthly Active Wallets (MAW) are commonly used. These metrics track how often wallets are actively interacting within specific timeframes. The Customer Engagement Score (CES) goes a step further by assigning values to actions, helping highlight what drives user engagement the most.
Retention rate is another critical measure - it shows the percentage of wallets that keep interacting with a dApp over time, signaling successful long-term engagement. On the acquisition side, Cost Per Wallet (CPW) measures how effectively different channels bring in new users, while the conversion rate tracks how many users connect their wallets or complete meaningful actions after onboarding.
Other key metrics include:
These numbers create a clear picture of how well a wallet is performing and its potential for long-term success.
Retention metrics are a strong indicator of earning potential and ongoing profitability. For example, studies show that about 65% of new users stop using a dApp after their first interaction, and retention beyond seven days drops below 20% for most platforms. Within 30 days, only 5–10% of users become repeat dApp users, and fewer than 10% interact with more than one dApp regularly.
However, wallets with better retention metrics often show stronger ROI potential. For instance, dApps offering token incentives report 2–3x higher retention rates. Additionally, retention improves by 25% when onboarding includes wallet education. It's also worth noting that the top five dApps account for over 50% of daily wallet connections, proving that successful platforms can achieve high user concentration.
For investors, these metrics help identify protocols with sustainable user bases that can generate consistent transaction volume and fee revenue. Together with financial data, activity and retention metrics provide a well-rounded view of a wallet's performance.
Analyzing wallet engagement in the DeFi space isn’t without its hurdles. For one, retention is a major issue - over 70% of DeFi users abandon dApps after just one transaction, and the average wallet connects to only 1.4 dApps each month. Even worse, only 15% of new wallet connections lead to actual on-chain transactions, showing that many users face friction in the onboarding process.
High gas fees also discourage users, especially in Ethereum-based dApps, where retention rates drop as fees rise. Wealth concentration further skews metrics, with less than 1% of wallets holding over 90% of on-chain value. Additionally, 40% of wallets connect just once and never return, making it hard to tell whether these users had genuine interest or were simply exploring.
Tools like Wallet Finder.ai aim to tackle some of these issues by offering advanced analytics that track wallet activity across multiple protocols. Its filtering features help identify wallets with consistent engagement patterns, making it easier to spot long-term users versus temporary spikes in activity.
When evaluating wallet performance, it's not enough to just look at raw returns - those numbers don’t account for the risks involved. This is where the Sharpe Ratio comes in. It measures risk-adjusted returns, helping investors decide if the performance of their DeFi wallet is worth the level of volatility they’re taking on. This is especially important in the crypto world, where big gains often come with equally big risks.
The formula for the Sharpe Ratio is:
Sharpe Ratio = (Rx – Rf) / StdDev(Rx)
Here’s what those terms mean:
To calculate it for a DeFi wallet, you’d take the average return over a specific period, subtract the risk-free rate, and divide by the volatility of those returns. It’s a straightforward way to evaluate performance compared to other strategies.
Here’s a quick breakdown of what the numbers mean:
For comparison, as of September 28, 2024, the S&P 500 Portfolio had a Sharpe Ratio of 2.91.
The Sharpe Ratio simplifies comparing different portfolios or strategies by balancing risk and reward. For instance, one wallet might boast sky-high annual returns, but if it’s wildly volatile, it could be riskier than a wallet with steadier, more modest gains. The Sharpe Ratio helps cut through the noise to show which option is more reliable when adjusted for risk.
As Nick Theodorakos, Managing Director of Financial Risk Management at Charles Schwab, puts it:
"The Sharpe ratio is a tool to balance risk and return. It's a relatively simple calculation anyone can use to compare two investment choices."
By focusing on risk-adjusted returns, you can see whether the volatility is justified. Wallet Finder.ai incorporates Sharpe Ratio analytics to help users compare wallets with these metrics in mind.
While the Sharpe Ratio is helpful, it’s not perfect. There are a few limitations to be aware of:
Harry Kat, a professor of risk management at Cass Business School, sums it up well:
"Risk is one word, but it is not one number."
A historical example drives this point home: Long-Term Capital Management had a Sharpe Ratio of 4.35 before its collapse in 1998. Despite the impressive metric, it failed to account for critical vulnerabilities.
To make sense of the metrics discussed earlier, here's a table that breaks down key ROI calculations for DeFi wallets. It highlights how each metric works, its advantages, limitations, and the ideal scenarios for using them:
(Current Value - Initial Investment) / Initial Investment × 100
Easy to calculate, gives a quick performance snapshot
Ignores risk, time, and additional costs; may mislead in volatile markets
Quick checks on wallet performance
Geometric linking of sub-period returns, removing cash flow timing effects
Removes deposit/withdrawal timing bias, ideal for comparing performance
Requires complex calculations and detailed transaction history
Comparing wallet managers or strategies
[(1 + ROI)^(1/n) - 1] × 100%
Accounts for time, making comparisons across periods easier
Doesn't factor in risk or market volatility
Comparing investments over different time spans
Realized: Profits from closed positions; Unrealized: Paper gains from open positions
Differentiates actual cash flow from potential gains, helpful for tax planning
Needs detailed tracking of all transactions
Tax reporting and cash flow analysis
Total fees as a percentage of returns, net ROI after fees
Shows true profitability after accounting for all costs
Requires precise tracking of fees across multiple chains
High-frequency trading strategies
Annual rewards divided by the staked amount, including compound interest
Evaluates passive income while considering compounding effects
Doesn't account for impermanent loss or slashing risks
Staking and liquidity provision strategies
Transaction frequency, average holding periods, diversification ratios
Offers insight into performance patterns and behaviors
Doesn't directly measure profitability
Assessing trading habits and strategy effectiveness
(Portfolio Return - Risk-Free Rate) / Standard Deviation of Returns
Provides a risk-adjusted view of returns
Assumes returns follow a normal distribution; doesn't separate upward from downward volatility
Comparing risk-adjusted performance across strategies
Each metric serves a specific purpose. For example, Net ROI is great for quick performance checks, while the Sharpe Ratio digs deeper into risk-adjusted returns. A 50% ROI might seem impressive, but in DeFi's unpredictable landscape, it’s crucial to also consider factors like volatility and risk. Metrics like TWR and Annualized ROI can help you make fair comparisons between strategies.
Tools like Wallet Finder.ai simplify these calculations, bringing everything together for a clear view of your wallet's performance. By using the right metric for the right question, you can better understand how effective your DeFi investments really are.
Understanding ROI metrics in DeFi can help you make smarter investment choices, even in unpredictable markets. These metrics are key to figuring out if your DeFi strategies are actually paying off.
Each metric we've discussed plays a unique role in your analysis toolbox. For instance, Net ROI gives you a quick view of performance, while Time-Weighted Returns allow for fair comparisons between strategies. Annualized ROI helps you assess results over different timeframes, and looking at realized versus unrealized gains is crucial for smart tax planning. Don’t forget about transaction fees - like Ethereum’s high gas costs - which can eat into your profits. Together, these metrics give you a clearer picture of performance and help in assessing risk-adjusted returns.
Speaking of risk, metrics like the Sharpe Ratio are indispensable. While professional traders typically aim for 3%–10% monthly returns, promises of 50% or more per month often come with excessive risk.
Tracking these metrics across multiple blockchains can be overwhelming without automation. With fluctuating conversion rates and asset values, manual tracking just isn’t practical.
That’s where tools like Wallet Finder.ai come in. By combining blockchain data with user-friendly analytics, it simplifies tracking wallet performance. Instead of spending hours manually analyzing data, you can quickly identify top-performing wallets across major blockchains. Plus, its advanced filters make it easy to dive deep into the details.
The ups and downs of the crypto market can heavily affect how accurate ROI metrics are in DeFi wallets. With prices changing quickly and asset values shifting unexpectedly, returns can easily be overstated or understated, especially when looking at short-term performance.
On top of that, market changes can influence things like collateralization levels in DeFi lending, making ROI calculations even trickier. To get a better sense of how a wallet is truly performing, it’s important to track metrics over longer periods and rely on tools that take these market swings into account.
Calculating the Time-Weighted Rate of Return (TWR) for DeFi wallets can be a bit of a challenge. The irregular and frequent cash flows in these wallets make it tough to measure performance accurately. On top of that, DeFi assets often deal with valuation issues due to illiquidity and sporadic transactions, which only adds to the complexity.
To tackle these hurdles, you can try using methods like the modified Dietz formula or breaking the TWR calculation into shorter time periods and linking the results together. These strategies help minimize errors caused by uneven cash flows or timing issues. It's also essential to keep detailed records of every deposit, withdrawal, and transaction - especially in the fast-moving and unpredictable world of DeFi.
Tracking your realized and unrealized gains is key to understanding how well your DeFi wallet is performing. Realized gains are the profits you’ve already secured from trades you’ve completed. On the other hand, unrealized gains reflect the potential profits - or losses - of the assets you’re still holding, based on their current market value.
By keeping an eye on both, you get a clearer picture of your wallet’s profitability and the risks involved. This knowledge can guide you in deciding whether to hold onto your assets for future growth or sell them to secure profits or reduce potential losses.
{"@context":"https://schema.org","@type":"FAQPage","mainEntity":[{"@type":"Question","name":"How does crypto market volatility affect ROI metrics in DeFi wallets?","acceptedAnswer":{"@type":"Answer","text":"<p>The <strong>ups and downs</strong> of the crypto market can heavily affect how accurate ROI metrics are in DeFi wallets. With prices changing quickly and asset values shifting unexpectedly, returns can easily be <strong>overstated or understated</strong>, especially when looking at short-term performance.</p> <p>On top of that, market changes can influence things like <strong>collateralization levels</strong> in DeFi lending, making ROI calculations even trickier. To get a better sense of how a wallet is truly performing, it’s important to track metrics over longer periods and rely on tools that take these market swings into account.</p>"}},{"@type":"Question","name":"What challenges arise when calculating the Time-Weighted Rate of Return (TWR) for DeFi wallets, and how can they be solved?","acceptedAnswer":{"@type":"Answer","text":"<p>Calculating the <strong>Time-Weighted Rate of Return (TWR)</strong> for DeFi wallets can be a bit of a challenge. The irregular and frequent cash flows in these wallets make it tough to measure performance accurately. On top of that, DeFi assets often deal with valuation issues due to illiquidity and sporadic transactions, which only adds to the complexity.</p> <p>To tackle these hurdles, you can try using methods like the <strong>modified Dietz formula</strong> or breaking the TWR calculation into shorter time periods and linking the results together. These strategies help minimize errors caused by uneven cash flows or timing issues. It's also essential to keep detailed records of every deposit, withdrawal, and transaction - especially in the fast-moving and unpredictable world of DeFi.</p>"}},{"@type":"Question","name":"Why should you track both realized and unrealized gains when evaluating a DeFi wallet's performance?","acceptedAnswer":{"@type":"Answer","text":"<p>Tracking your <strong>realized</strong> and <strong>unrealized gains</strong> is key to understanding how well your DeFi wallet is performing. Realized gains are the profits you’ve already secured from trades you’ve completed. On the other hand, unrealized gains reflect the potential profits - or losses - of the assets you’re still holding, based on their current market value.</p> <p>By keeping an eye on both, you get a clearer picture of your wallet’s profitability and the risks involved. This knowledge can guide you in deciding whether to hold onto your assets for future growth or sell them to secure profits or reduce potential losses.</p>"}}]}

A premier DeFi analytics platform empowering traders to discover and analyze profitable blockchain wallets, trades and tokens.

