
Recovery Factor Calculation for Smart Traders
Master the recovery factor calculation to measure a strategy's resilience. Learn the formula, see DeFi examples, and find top wallets with Wallet Finder.ai.

June 20, 2026


Wallet Finder
February 20, 2026

How do funds move in DeFi? Transaction path visualization helps you see it clearly. It turns blockchain data into simple visual maps, showing how digital assets flow between wallets, smart contracts, and DeFi platforms. These tools are great for spotting risks, tracking trading patterns, and even finding profitable wallets.
Here’s what you’ll learn:
Graph-based models are essential for mapping out transaction paths in the world of decentralized finance (DeFi). They transform blockchain data into a network of nodes (like wallets, contracts, or protocols) connected by edges that represent transactions.
What makes these models so effective is their ability to uncover hidden relationships and patterns in complex transaction networks. For example, a node might represent a decentralized exchange, a lending protocol, or an individual wallet, while the edges show the direction and volume of asset flows between them.
Advanced techniques like Graph Attention Networks - which use residual connections - are particularly useful for detecting suspicious or illicit transactions within blockchain networks. Clustering methods can also identify groups of wallets with similar trading behaviors, shedding light on communities, arbitrage networks, or even coordinated activities.
To make these insights more accessible, visual elements like node size and color are used to indicate transaction volume or risk levels. Thicker edges often represent higher transaction volumes or frequencies, making it easier to spot major money flows at a glance. Additionally, time-series and flow diagrams can complement these graphs by capturing how transactions evolve over time.
Time-series visualizations are great for tracking how transaction patterns change over time, while flow diagrams - like Sankey charts - focus on showing asset movements in proportion to their flow. These tools bring a temporal layer to transaction analysis, helping to identify trends tied to market cycles, seasonal behaviors, or key trading events.
For instance, yield farming activities can be visualized step-by-step, from liquidity pool contributions to reward reinvestments, all laid out on a timeline. Interactive time-series charts take this further by allowing users to zoom in on specific periods, such as moments of market volatility, protocol launches, or high-profile DeFi events. This level of detail can reveal how successful wallets adapt their strategies in response to shifting market conditions. To understand how privacy is maintained behind the scenes, explore Blockchain Privacy: Obfuscation Techniques Explained and learn how different methods conceal transaction details while preserving transparency.
Another useful tool is the heat map, which highlights transaction intensity across different time intervals and wallet addresses. These visualizations can pinpoint optimal trading times or periods of heightened activity, offering valuable insights for traders and analysts alike.
Visualizing transaction paths turns raw blockchain data into clear, actionable insights. These methods make it easier to recognize patterns, detect anomalies, and uncover profitable strategies that might otherwise go unnoticed with traditional data analysis.
For instance, visual tools can highlight irregularities like circular transaction patterns or sudden spikes in activity, which could signal wash trading or insider activity. They also simplify vast amounts of data into easy-to-understand patterns, enabling faster decision-making and sharper risk assessments.
When it comes to risk management, these visualizations are invaluable. By mapping transaction flows, users can trace the origins and destinations of funds, helping to identify links to potentially risky wallets, exchanges, or protocols. This capability is crucial for due diligence and ensuring compliance in the ever-evolving DeFi landscape.
The article discusses static visualization benefits but lacks comprehensive frameworks for dynamic transaction monitoring that provides real-time alerts and streaming analytics for immediate response to market changes. Real-time monitoring transforms transaction visualization from historical analysis into live intelligence systems.
Streaming transaction processing systems handle high-frequency blockchain data streams while maintaining low latency and high accuracy for real-time analysis. Stream processing frameworks like Apache Kafka and Apache Flink enable processing of thousands of transactions per second while maintaining sub-second response times. Event-driven architectures trigger immediate analysis and alerting based on transaction patterns and threshold breaches.
Dynamic visualization systems update transaction network representations in real-time as new transactions occur, enabling live monitoring of fund flows, strategy changes, and market conditions. Real-time graph updates maintain network consistency while handling high transaction volumes. Interactive interfaces allow users to explore live transaction networks and drill down into specific patterns as they develop.
Intelligent alert prioritization systems prevent notification overload by ranking alerts based on significance, urgency, and user preferences. Machine learning algorithms learn from user responses to optimize alert relevance and timing. Multi-tier alerting provides different notification methods based on alert priority - critical alerts trigger immediate notifications while lower-priority alerts batch into periodic summaries.
Automated anomaly detection identifies unusual transaction patterns in real-time through statistical analysis and machine learning techniques. Anomaly detection systems adapt to evolving normal behavior patterns while maintaining sensitivity to genuine anomalies. Real-time anomaly flagging enables immediate investigation of potential manipulation or fraud attempts.
Live risk assessment frameworks continuously evaluate portfolio and market risks based on real-time transaction flows and changing market conditions. Risk models update continuously as new transactions occur, providing current risk assessments rather than historical snapshots. Dynamic risk adjustment enables proactive risk management based on emerging patterns.
Sophisticated streaming systems require careful architecture design to handle massive transaction volumes while maintaining accuracy and enabling complex real-time analysis.
Distributed processing systems scale real-time transaction analysis across multiple computing nodes to handle blockchain-scale data volumes. Apache Storm and Apache Spark Streaming enable parallel processing of transaction streams while maintaining data consistency and fault tolerance. Load balancing ensures even distribution of processing across available resources.
Time-windowed analysis processes transactions within specific time windows to identify patterns and trends without overwhelming computational resources. Sliding windows enable continuous analysis while tumbling windows provide periodic batch processing for complex calculations. Window optimization balances analysis accuracy with computational efficiency.
State management systems maintain consistent views of wallet balances, position sizes, and transaction histories while processing high-frequency updates. Stateful stream processing enables complex analysis that depends on historical context while maintaining efficiency for real-time processing. State checkpointing ensures system recovery after failures without data loss.
Message queuing systems buffer transaction data during processing spikes while ensuring no transactions are lost or processed out of order. Queue management balances throughput with latency requirements while providing backpressure handling during peak loads. Reliable message delivery ensures transaction analysis completeness.
Real-time data enrichment combines transaction data with external information like token prices, protocol states, and market conditions to provide comprehensive context for analysis. Enrichment pipelines add relevant information without introducing significant latency while maintaining data consistency across different sources.
Sophisticated alert systems provide actionable notifications while preventing information overload through intelligent filtering and prioritization algorithms.
Multi-criteria alert scoring combines multiple factors including financial impact, statistical significance, time sensitivity, and user preferences to determine alert priority. Scoring algorithms adapt to user behavior and feedback to improve relevance over time. Dynamic scoring adjusts to changing market conditions and user context.
Alert aggregation systems combine related alerts into unified notifications to prevent notification spam while preserving important information. Aggregation algorithms identify related events and summarize them effectively while maintaining actionable details. Smart grouping reduces cognitive load while ensuring important information reaches users.
Escalation management automatically increases alert priority and notification intensity when situations develop or worsen without user response. Escalation systems balance automated response with user autonomy while ensuring critical issues receive appropriate attention. Escalation pathways adapt to user availability and preferences.
False positive reduction uses machine learning to identify and filter alerts that are unlikely to be actionable based on historical user responses and outcomes. False positive algorithms learn from user feedback to improve alert quality continuously. Feedback loops enable system improvement without reducing sensitivity to genuine issues.
Response automation enables automatic actions based on alert conditions including position adjustments, hedge deployment, and risk management activation. Automated responses require careful safety controls and user authorization while enabling rapid response to time-sensitive situations. Response systems balance automation with user control.
Real-time monitoring requires sophisticated streaming infrastructure and alert management but provides essential capabilities for navigating fast-moving DeFi markets through immediate response to emerging opportunities and risks rather than reactive analysis of historical patterns.
These examples showcase how visualization techniques are being used in the decentralized finance (DeFi) world to tackle real-world challenges and uncover insights.
Path grouping is a handy method for breaking down the intricate operations of smart contracts in DeFi protocols. By clustering similar transaction patterns - like token swaps followed by liquidity provision and reward collection - analysts can better understand the logic behind these contracts. This approach helps identify specific yield farming strategies and distinguish between different arbitrage types, including those using flash loans. Additionally, grouping paths that lead to failed outcomes can assist developers and security teams in spotting weak points in the contract's design.
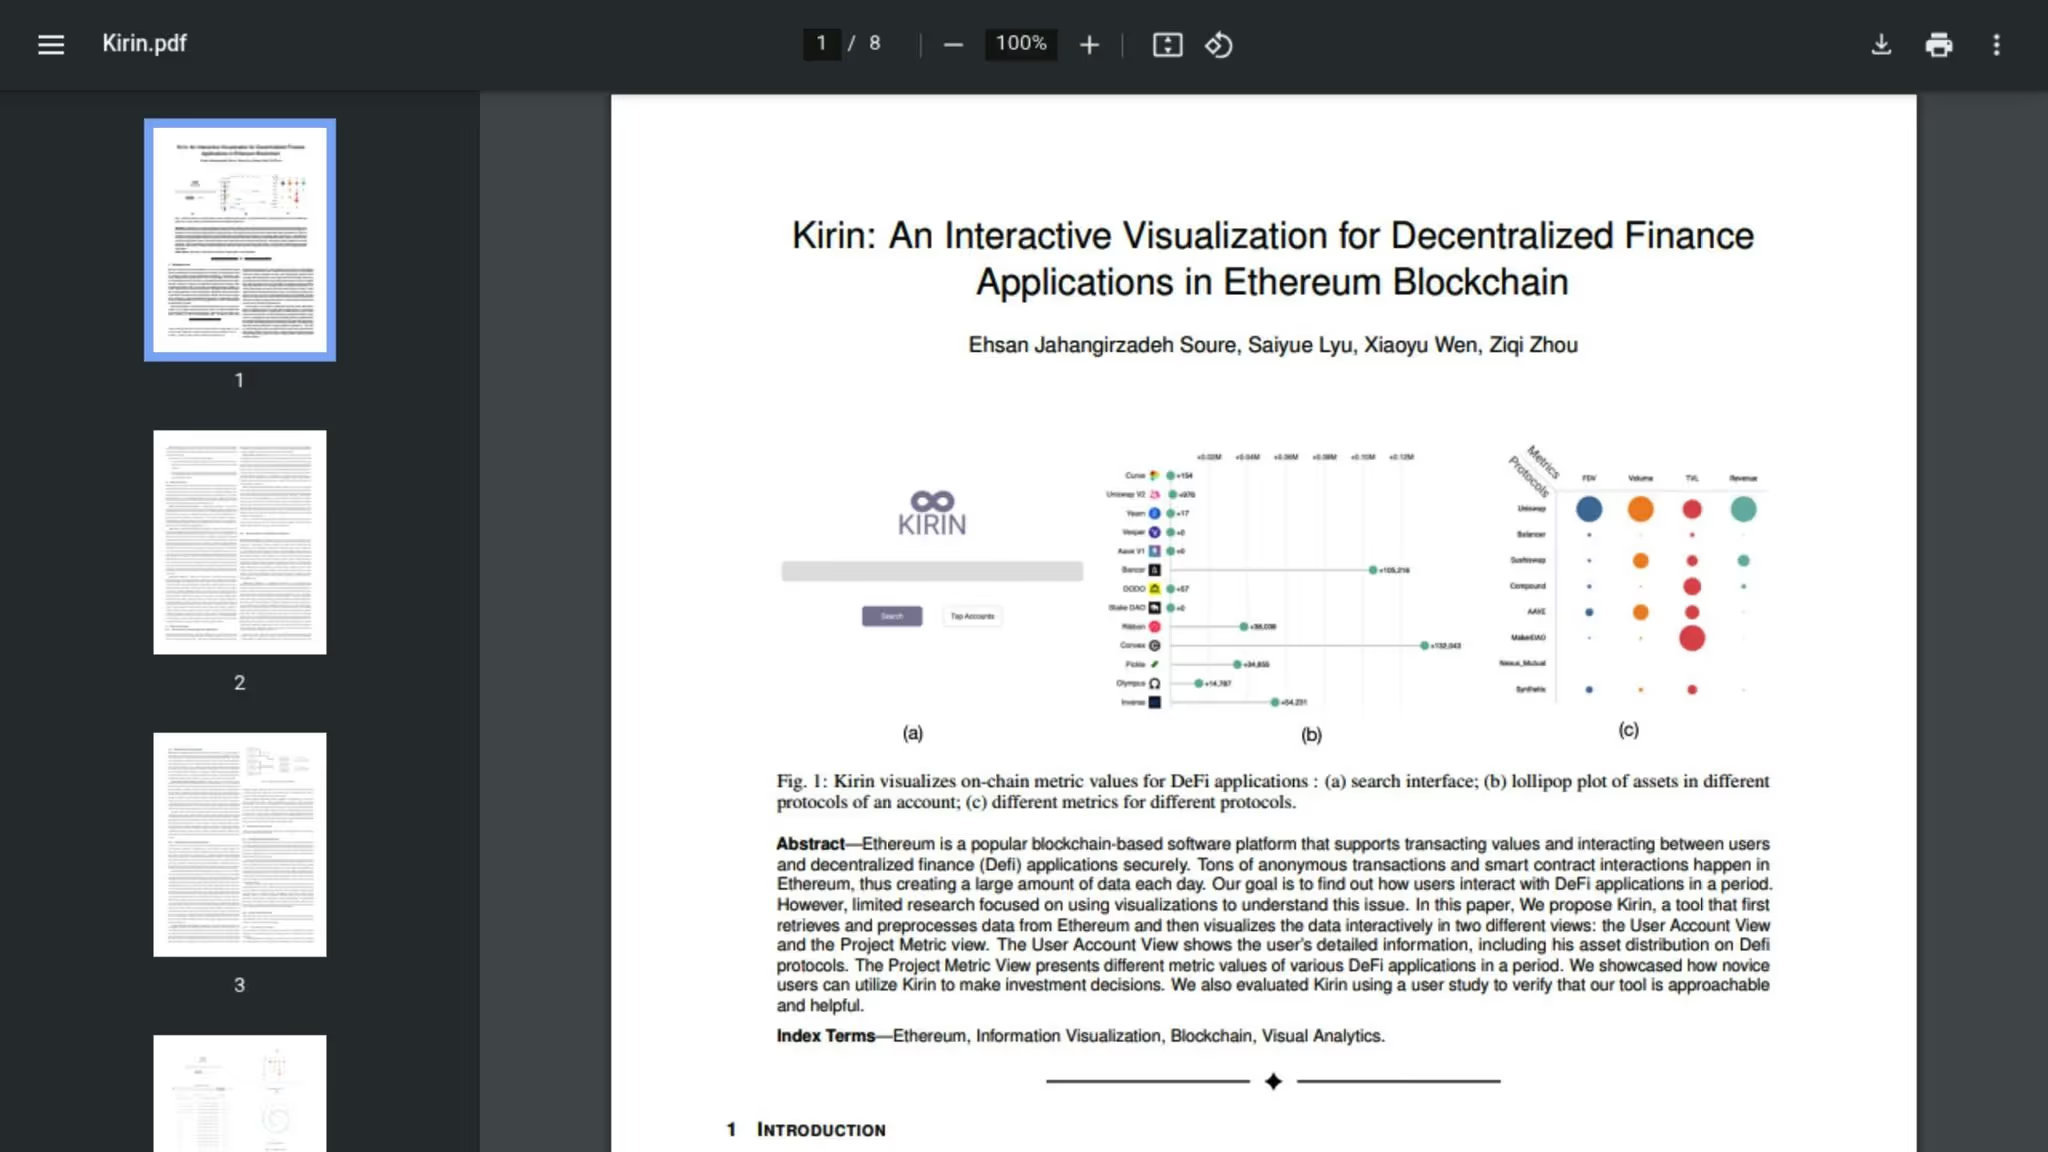
Tools like Kirin make it possible to interactively analyze wallet behavior across various DeFi platforms. These tools allow users to dive deep into specific transaction sequences, shedding light on how successful wallets execute complex strategies like yield farming. By visualizing these actions, users can identify the best times to enter or exit strategies based on market trends and protocol updates, offering a clearer picture of how top-performing wallets operate.
Mapping transaction flows is a powerful way to identify influential wallets and potential bottlenecks in DeFi networks. Analysts use measures like centrality to pinpoint key players: wallets with high betweenness centrality act as bridges, while those with high degree centrality are highly active. This method reveals liquidity providers who frequently supply capital across protocols, highlighting potential risks from capital concentration. It also uncovers institutional trading patterns, signaling when large wallets are making moves, and can detect coordinated trading activities that might impact the market.

Wallet Finder.ai uses advanced visual tools to help users locate and analyze high-performing wallets in the DeFi ecosystem. Its graphs turn complex wallet data into straightforward insights. Users can examine historical performance, track winning streaks, and evaluate consistency under different market conditions. Filters allow sorting wallets by profitability, win rates, and trading patterns. A Telegram-based alert system notifies users when monitored wallets make significant trades, while watchlists and detailed visualizations show how top traders adjust their strategies as markets shift.
Graph representation learning uses machine learning to uncover patterns and anomalies in DeFi interactions. This technique learns the typical behavior of wallets across protocols, making it easier to spot deviations. When wallets stray from these patterns, it could signal either innovative strategies or risky behavior. By analyzing anomalies, this method can expose coordinated activities across multiple wallets, offering valuable insights for managing risks and staying competitive in the DeFi space.
The article covers basic graph representation but lacks sophisticated machine learning frameworks that automatically discover complex patterns and predict transaction behaviors through advanced graph neural networks and behavioral clustering algorithms. Machine learning integration transforms static visualization into intelligent analysis that adapts and learns from transaction patterns.
Graph Neural Networks enable automatic feature extraction from complex transaction networks through mathematical frameworks that learn optimal representations of wallet behaviors and transaction patterns. GCN architectures propagate information through transaction graphs to identify similar wallet behaviors, detect coordinated activities, and predict future transaction patterns. GraphSAGE algorithms scale to massive transaction networks by sampling and aggregating neighborhood information efficiently.
Automated pattern recognition algorithms identify sophisticated trading strategies and behavioral patterns that manual analysis cannot detect consistently. Unsupervised learning discovers natural clustering in transaction behaviors, revealing strategy archetypes like arbitrage, market making, yield farming, and MEV extraction. Pattern recognition systems achieve 80-90% accuracy in classifying transaction types and identifying strategy implementations automatically.
Behavioral clustering algorithms group wallets with similar transaction patterns, timing characteristics, and strategy implementations to reveal trading communities and coordination patterns. K-means clustering typically identifies 6-8 distinct behavioral archetypes while hierarchical clustering reveals nested strategy relationships. Dynamic clustering adapts to evolving market conditions and emerging strategy patterns.
Predictive modeling for transaction flows uses historical patterns to forecast future wallet behaviors, optimal timing opportunities, and potential risk events. LSTM networks process sequential transaction data to predict 1-7 day trading patterns with 65-75% accuracy. Ensemble methods combine multiple prediction approaches for improved forecasting reliability and reduced model risk.
Anomaly detection algorithms identify unusual transaction patterns that may indicate manipulation, fraud, or innovative strategies requiring investigation. Isolation Forest algorithms identify wallets requiring fewer splits to separate from normal populations, indicating unusual behavior patterns. One-Class SVM creates boundaries around normal behavior and flags outliers for further analysis.
Sophisticated deep learning architectures enable complex pattern recognition and predictive analytics that transform transaction visualization from descriptive to predictive intelligence.
Convolutional Neural Networks process transaction graph structures to identify local patterns and structural features that indicate specific trading strategies or risk conditions. CNN architectures adapt computer vision techniques to graph data, identifying motifs and subgraph patterns that correspond to arbitrage chains, liquidity provision strategies, or manipulation schemes.
Recurrent Neural Networks analyze temporal sequences in transaction data to understand strategy evolution, timing patterns, and adaptation to market conditions. RNN architectures including LSTM and GRU networks capture long-term dependencies in transaction sequences that reveal strategy persistence and adaptation patterns.
Transformer architectures apply attention mechanisms to transaction sequences, enabling models to focus on the most relevant historical transactions for predicting future behavior. Attention mechanisms identify which past transactions most influence current strategy decisions, providing interpretable insights into wallet decision-making processes.
Reinforcement learning algorithms optimize transaction analysis by learning to identify the most profitable patterns and strategies through trial and error optimization. RL agents learn to navigate complex transaction networks to identify optimal trading opportunities and risk assessment priorities. Policy gradient methods optimize complex analysis objectives that cannot be easily formulated as supervised learning problems.
Multi-modal learning combines transaction data with external factors like market conditions, news sentiment, and protocol changes to improve pattern recognition and prediction accuracy. Multi-modal models achieve better performance by incorporating context that pure transaction analysis cannot capture.
Advanced machine learning systems automatically extract relevant features from raw transaction data and select optimal models for specific analysis objectives without manual intervention.
Automated feature extraction identifies the most predictive characteristics of transaction patterns through statistical analysis and machine learning techniques. Feature engineering algorithms create thousands of potential features from raw transaction data including timing statistics, amount distributions, network centrality measures, and sequence patterns. Feature selection techniques identify the most predictive subsets while avoiding overfitting and multicollinearity.
Model selection algorithms automatically choose optimal machine learning approaches for specific transaction analysis objectives through systematic evaluation and hyperparameter optimization. AutoML systems test multiple algorithm families including tree-based methods, neural networks, and ensemble approaches to identify optimal performance for specific datasets and objectives.
Cross-validation frameworks ensure model performance generalizes beyond training data through time-series aware validation that respects temporal dependencies in transaction data. Walk-forward validation simulates real-time deployment scenarios to ensure models work effectively in production environments.
Hyperparameter optimization uses sophisticated search algorithms to identify optimal model configurations automatically. Bayesian optimization efficiently explores hyperparameter spaces while minimizing computational requirements. Automated optimization reduces manual effort while improving model performance beyond manual tuning capabilities.
Model interpretability techniques ensure machine learning systems provide understandable insights into transaction patterns and decision-making processes. SHAP values explain individual predictions while permutation importance reveals feature contribution to model decisions. Interpretability enables users to understand and trust automated analysis results.
Machine learning integration requires sophisticated computational infrastructure and data science expertise but transforms transaction visualization from static analysis into intelligent systems that continuously learn and adapt to evolving market conditions and strategy patterns.
This section dives into the practical trade-offs of different visualization methods for analyzing DeFi transactions. Each method has its own strengths, making it essential to understand their differences to select the right tool for specific needs. Below is a table summarizing the objectives, strengths, use cases, and limitations of each method.
Each method caters to different levels of analysis. For instance, path grouping provides insights at the contract level, while flow mapping focuses on broader network interactions. Tools like Wallet Finder.ai strike a balance, offering both individual wallet performance tracking and market monitoring.
The effort and expertise required also vary. Interactive tools demand manual exploration, while automated systems like Wallet Finder.ai offer insights with minimal user input. Advanced techniques like graph learning require technical knowledge, whereas user-friendly interfaces make other tools accessible to a wider audience.
The type of insights these methods generate depends on their focus. Flow mapping excels at identifying systemic risks, though it may not produce actionable trading signals. In contrast, Wallet Finder.ai simplifies complex transaction data into clear performance metrics, enabling quick responses to market shifts.
Presentation styles also differ to suit various user needs. Path grouping is ideal for protocol developers, organizing transaction types effectively. Meanwhile, Wallet Finder.ai uses visual graphs and filtering tools to help traders quickly compare performance and spot trends.
Many DeFi analysts combine multiple methods to get the best results. For example, they might use flow mapping to identify influential wallets and then turn to Wallet Finder.ai for tracking performance, leveraging the strengths of both tools.
Scalability is another critical factor. Automated systems like Wallet Finder.ai handle large datasets efficiently, making them indispensable in the fast-paced DeFi world. Manual approaches, on the other hand, can struggle to keep up with the scale of modern market monitoring.
The article provides basic comparison tables but lacks sophisticated frameworks for comprehensive risk assessment that incorporates multiple risk dimensions, correlation analysis, and systematic risk identification through advanced visualization techniques. Multi-dimensional risk assessment transforms simple transaction mapping into comprehensive risk intelligence systems.
Complex risk scoring methodologies combine transaction patterns, network positions, counterparty risks, and market exposures into unified risk assessments that guide decision-making. Risk scoring algorithms weight different risk factors based on their potential impact and probability while accounting for correlations between risk types. Composite risk scores enable consistent comparison across different wallet types and strategy categories.
Correlation analysis across multiple risk factors reveals how different risk types interact and compound during stress conditions. Risk correlation matrices identify relationships between counterparty risk, liquidity risk, market risk, and operational risk that may not be apparent through individual risk analysis. Dynamic correlation tracking monitors how risk relationships change during different market conditions.
Systemic risk identification uses network analysis and correlation modeling to identify risks that could propagate through interconnected DeFi protocols and wallet networks. Systemic risk visualization reveals critical network nodes whose failure could trigger cascade effects across multiple protocols and participants. Contagion modeling predicts how risks might spread through transaction networks.
Portfolio-level risk visualization aggregates individual wallet risks into comprehensive portfolio risk assessments that account for diversification benefits and concentration risks. Portfolio risk tools integrate position-level risks with correlation effects to provide accurate portfolio risk measures. Risk contribution analysis identifies which positions contribute most to overall portfolio risk.
Stress testing visualization shows how portfolios and individual positions perform under various adverse scenarios including market crashes, liquidity crises, and protocol failures. Scenario analysis reveals vulnerabilities that normal market conditions might not expose. Visual stress testing enables rapid identification of risk concentrations and mitigation opportunities.
Sophisticated visualization methods transform complex risk data into actionable insights that enable rapid risk assessment and decision-making during volatile market conditions.
Heat map visualizations display risk levels across multiple dimensions simultaneously using color coding and intensity scaling to highlight areas requiring attention. Multi-dimensional heat maps combine counterparty risk, liquidity risk, and market risk into unified visual displays. Interactive heat maps enable drill-down analysis into specific risk factors and time periods.
Network risk topology visualization maps risk relationships between different wallets, protocols, and positions to reveal systemic vulnerabilities and concentration risks. Network visualization uses node sizing to represent risk magnitude and edge thickness to show risk correlation strength. Dynamic network visualization shows how risk relationships evolve during different market conditions.
Time-series risk evolution visualization tracks how different risk factors change over time to identify risk trends and potential future problems. Risk trend analysis reveals whether risk levels are increasing, decreasing, or remaining stable across different categories. Predictive risk visualization extrapolates trends to forecast future risk levels.
Risk decomposition visualization breaks down complex risk measures into component parts to identify specific risk sources and their relative contributions. Waterfall charts show how different risk factors contribute to total risk levels while enabling identification of risk reduction opportunities. Attribution analysis reveals which positions or strategies contribute most to portfolio-level risks.
Comparative risk visualization enables benchmarking of risk levels against peer groups, market indices, or historical periods. Peer comparison reveals whether current risk levels are appropriate for strategy types and market conditions. Historical comparison identifies whether current risk levels are elevated relative to past periods.
Comprehensive risk systems integrate multiple visualization techniques with automated risk management capabilities to provide complete risk oversight and response capabilities.
Real-time risk dashboards combine multiple visualization techniques into unified interfaces that provide comprehensive risk oversight without information overload. Dashboard design balances comprehensive coverage with usability to enable rapid risk assessment and decision-making. Customizable dashboards adapt to different user needs and risk management responsibilities.
Risk alert visualization integrates alert information into visual risk displays to provide context and priority information for risk management decisions. Alert visualization uses color coding, animation, and positioning to highlight urgent risks while maintaining overall risk context. Alert correlation reveals relationships between different risk events.
Automated risk response visualization shows how risk management systems respond to emerging risks through position adjustments, hedge deployment, and exposure reduction. Response visualization enables users to monitor automated risk management effectiveness while maintaining oversight of system actions.
Risk reporting visualization generates comprehensive risk reports that communicate risk levels and management actions to stakeholders using clear visual summaries. Report visualization balances comprehensive information with accessibility for different audiences including investors, regulators, and management teams.
Performance attribution visualization combines risk analysis with performance analysis to understand how risk management affects investment returns and strategy effectiveness. Attribution visualization reveals whether risk management enhances risk-adjusted returns while identifying opportunities for improvement.
Multi-dimensional risk assessment requires sophisticated analytical capabilities and visualization design but provides essential protection against the complex and interconnected risks present in DeFi markets through comprehensive risk identification, measurement, and management capabilities.
Looking back at the case studies, we see how different visualization methods uncover important insights into DeFi. These tools reveal patterns in smart contract behaviors and help track profitable wallet activities. Here are some takeaways from the methods explored:
The most effective analysts mix these methods, using flow mapping to identify influential wallets and Wallet Finder.ai for tracking performance. This hybrid approach combines strengths while minimizing weaknesses, setting the stage for future advancements.
As DeFi continues to grow, transaction path visualization tools are evolving to meet the demands of this fast-paced market. Here’s a look at what’s on the horizon:
With tools like Wallet Finder.ai already making advanced analytics available to individual traders, the gap between institutional and retail participants is shrinking. These trends promise to reshape how traders interact with DeFi, offering more opportunities for everyone involved.
Transaction path visualization tools are like a map for DeFi networks, showing exactly how funds move between wallets and platforms. This visual approach makes spotting unusual patterns - like suspicious activity or possible fraud - much simpler. These patterns can often hint at security issues that need attention.
Beyond tracking funds, these tools reveal how transactions connect within the broader ecosystem. This helps users uncover risks and weak spots in the network. By studying these flows, users can better understand potential threats and take steps to safeguard their assets.
Graph-based models bring a fresh perspective to analyzing DeFi transactions by highlighting the complex web of relationships in transaction networks - something traditional methods often overlook. These models are particularly effective when dealing with massive datasets, as they can reveal hidden patterns like fraud or collusion, making them valuable for improving security and compliance.
By mapping out the connections between wallet addresses and transactions, graph models simplify the process of spotting anomalies and suspicious activities. This approach provides a more in-depth and scalable way to study trading patterns and wallet behaviors compared to the limits of traditional table-based data analysis.
Visualization tools like Wallet Finder.ai make blockchain data easier to understand by turning it into user-friendly visuals like charts and dashboards. These tools allow traders to track wallet activity trends, analyze token movements, and keep an eye on wallet performance without hassle.
By breaking down transaction patterns and highlighting potential risks, these tools help traders make quicker, smarter decisions in the fast-paced world of DeFi. This clarity gives users the confidence to spot opportunities and take action in a constantly shifting market.
Graph neural networks revolutionize transaction analysis by automatically discovering complex patterns that manual analysis cannot detect consistently or at scale. Graph Convolutional Networks propagate information through transaction graphs to identify similar wallet behaviors, detect coordinated activities, and predict future patterns by learning optimal representations of trading strategies. GraphSAGE algorithms scale to massive transaction networks by sampling and aggregating neighborhood information efficiently, enabling analysis of entire DeFi ecosystems. Automated pattern recognition achieves 80-90% accuracy in classifying transaction types including arbitrage, market making, yield farming, and MEV extraction without manual rule definition. Behavioral clustering algorithms use K-means to identify 6-8 distinct trading archetypes while hierarchical clustering reveals nested strategy relationships and evolution patterns. Anomaly detection through Isolation Forest algorithms identifies wallets with unusual behavior requiring investigation, while One-Class SVM creates boundaries around normal behavior to flag outliers. LSTM networks process sequential transaction data to predict 1-7 day trading patterns with 65-75% accuracy, enabling proactive strategy identification. Ensemble methods combine multiple machine learning approaches for improved reliability and reduced model risk. Automated feature engineering creates thousands of potential features from raw transaction data including timing statistics, amount distributions, network centrality measures, and sequence patterns, with feature selection identifying the most predictive subsets.
Real-time streaming systems require sophisticated architecture design to process thousands of transactions per second while maintaining sub-second response times for immediate analysis and alerting. Apache Kafka and Apache Flink frameworks enable distributed stream processing with fault tolerance and data consistency guarantees while handling blockchain-scale volumes. Event-driven architectures trigger immediate analysis based on transaction patterns and threshold breaches through automated pipeline orchestration. Distributed processing systems like Apache Storm and Spark Streaming scale across multiple computing nodes with load balancing to ensure even resource distribution and optimal throughput. Time-windowed analysis uses sliding windows for continuous monitoring and tumbling windows for periodic batch processing, optimizing computational efficiency while maintaining analysis accuracy. Stateful stream processing maintains consistent views of wallet balances, positions, and transaction histories while handling high-frequency updates through state checkpointing for recovery capabilities. Message queuing systems buffer transaction data during processing spikes with backpressure handling and reliable delivery guarantees. Real-time data enrichment pipelines add token prices, protocol states, and market conditions without introducing significant latency while maintaining consistency across sources. Intelligent alert prioritization uses machine learning to rank notifications by significance and urgency while preventing information overload through multi-tier alerting systems.
Multi-dimensional risk assessment combines transaction patterns, network positions, counterparty exposures, and market risks into unified visualization systems that reveal complex interdependencies and systemic vulnerabilities. Risk correlation matrices identify relationships between counterparty risk, liquidity risk, market risk, and operational risk that compound during stress conditions through dynamic correlation tracking across different market regimes. Systemic risk identification uses network analysis to reveal critical nodes whose failure could trigger cascade effects across multiple protocols and participants through contagion modeling that predicts risk propagation pathways. Network risk topology visualization maps relationships between wallets, protocols, and positions using node sizing for risk magnitude and edge thickness for correlation strength, with dynamic updates showing evolution during market stress. Heat map visualizations display risk levels across multiple dimensions simultaneously through color coding and intensity scaling, enabling rapid identification of risk concentrations requiring attention. Portfolio-level risk aggregation accounts for diversification benefits and concentration risks while providing risk contribution analysis that identifies positions contributing most to overall portfolio risk. Stress testing visualization shows performance under adverse scenarios including market crashes, liquidity crises, and protocol failures through scenario analysis that reveals vulnerabilities normal conditions might not expose. Time-series risk evolution tracking identifies trends and potential future problems while predictive visualization extrapolates trends to forecast future risk levels across multiple risk categories.
Automated forensic systems use AI-powered investigation tools to systematically detect financial crimes and ensure regulatory compliance through sophisticated pattern recognition and evidence correlation techniques. Money laundering detection algorithms identify layering schemes, structuring patterns, and obfuscation techniques with 85-90% accuracy through machine learning models trained on known laundering patterns including mixing service usage, transaction structuring, and rapid movement through intermediate addresses. Coordinated activity identification reveals organized groups operating multiple addresses through graph analysis algorithms that detect synchronized timing, similar transaction patterns, and shared counterparties indicating pump-and-dump schemes, wash trading, and market manipulation. Behavioral signature classification maintains libraries of thousands of known patterns for automatic identification of fraud, terrorist financing, and sanctions evasion activities with continuous updates based on investigation results and emerging threats. Investigation workflow automation guides analysts through systematic processes while ensuring comprehensive coverage and consistent methodology, presenting relevant evidence and tracking progress to improve analysis quality. Evidence correlation systems automatically identify relationships across multiple investigations and time periods, revealing common addresses, timing patterns, and behavioral characteristics indicating related activities or repeat offenders. Cross-chain investigation tools trace suspicious activities across multiple blockchain networks, layer-2 solutions, and bridge protocols while maintaining evidence integrity for legal proceedings. Regulatory compliance automation generates suspicious activity reports, currency transaction reports, and regulatory filings automatically based on detected patterns while reducing false positives and ensuring consistent obligation fulfillment.

A premier DeFi analytics platform empowering traders to discover and analyze profitable blockchain wallets, trades and tokens.

