
Recovery Factor Calculation for Smart Traders
Master the recovery factor calculation to measure a strategy's resilience. Learn the formula, see DeFi examples, and find top wallets with Wallet Finder.ai.

June 20, 2026


Wallet Finder
June 15, 2026
CC is trading at $0.163634 with $13,055,438 in 24-hour volume. That puts the CC coin price in the actively traded range, but it's also a volatile asset, so the useful question isn't just what it costs right now. It's how to track, interpret, and trade the move before you're reacting late.
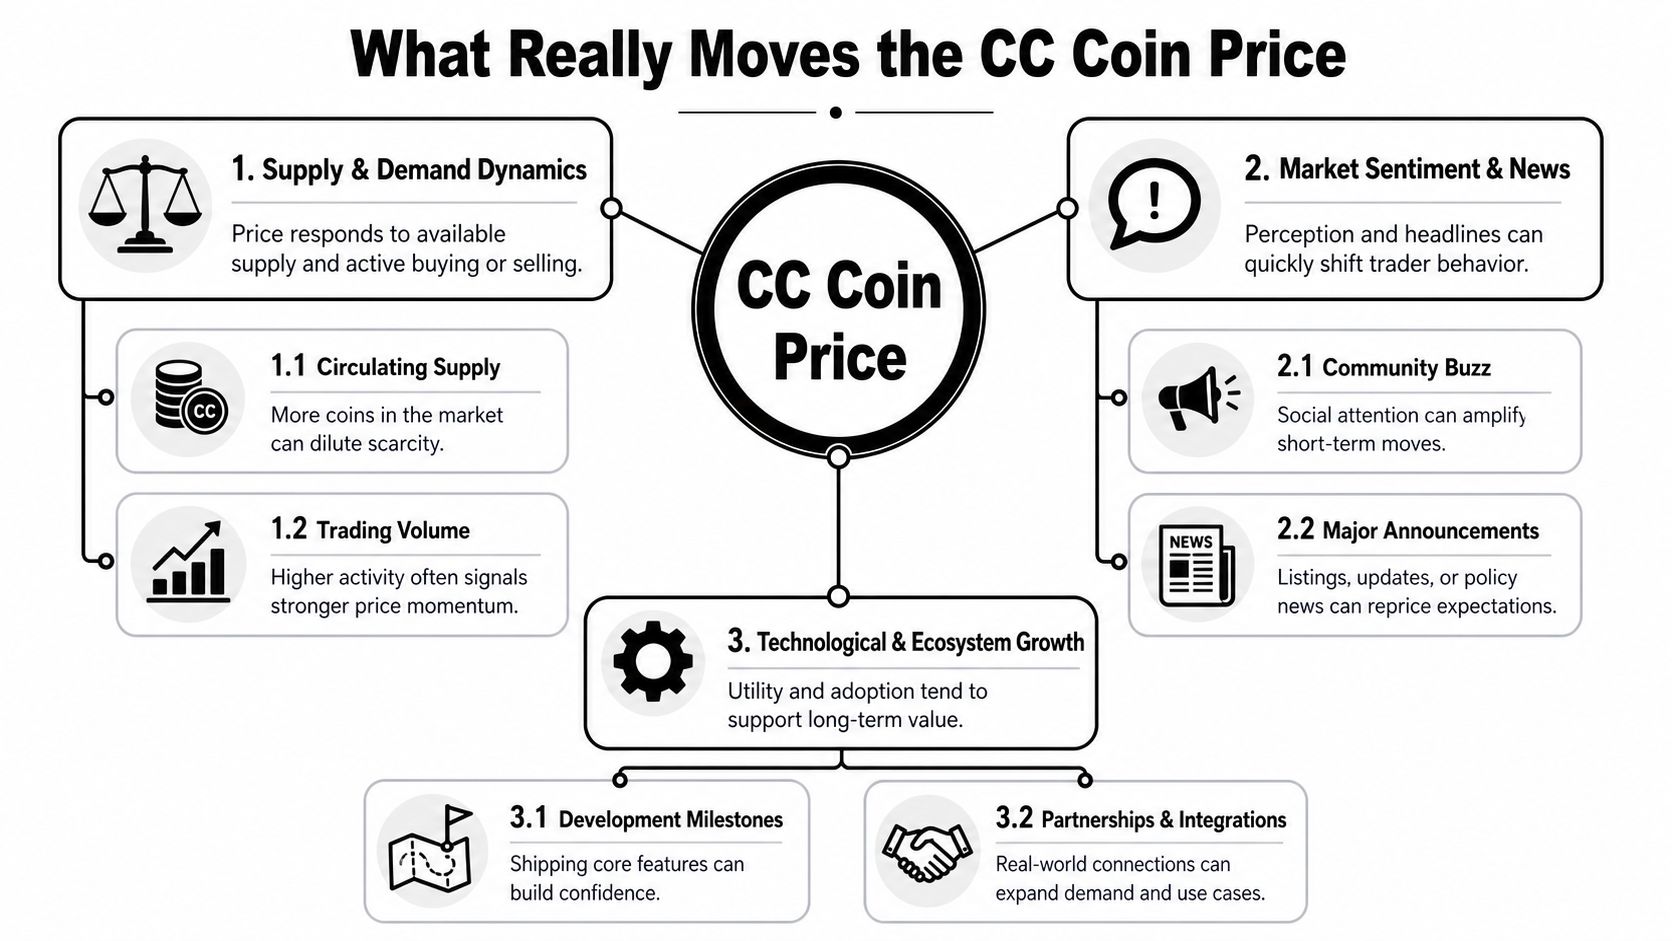
A lot of traders get stuck at the same point. They see CC push higher, fade, or snap back and all they have is a chart plus a few headlines. That's not enough. If you want an edge, you need to bridge raw price data with the behavior behind it: supply mechanics, market structure, technical levels, and the wallets that often move before the crowd notices.
Most traders first encounter CC the same way. You open a price app, see a sharp move, and start asking the wrong question. Not “what is CC trading at,” but “why did it move, who moved it, and is the move still live?”
That distinction matters. A ticker gives you the last trade. It doesn't tell you whether the move came from broad exchange demand, a catalyst tied to the network, or a flow pattern that may reverse just as fast. For CC, that gap matters more than usual because its structure isn't as simple as a fixed-supply retail token.
A trader who only watches spot price usually ends up late. They buy after momentum is visible and sell after weakness is obvious. The better workflow is to separate signals into layers:
That's how you turn a quote into a trade thesis.
Practical rule: A live price is not an edge. An edge comes from knowing whether that price is being accepted, rejected, or manufactured by short-term flow.
For CC, useful analysis starts with the quote, then moves quickly into context. You want to know whether volume is meaningful, whether historical moves have been fast enough to punish slow execution, and whether current price sits near a technically important zone.
You also want to stop treating all buyers as equal. Retail exchange demand and institutional access pathways don't affect price discovery in the same way. If you're trying to trade CC seriously, you need a framework that asks who is active, where they're active, and whether their activity tends to lead or lag the market.
That's where traders start getting real alpha. Not from staring harder at the candle, but from reading what sits behind it.
You spot CC pushing higher on your watchlist, open the chart, and see momentum. That still is not enough to act. The useful question at that moment is whether the move is broad participation, one venue pushing price, or a small group of wallets stepping in before everyone else notices.
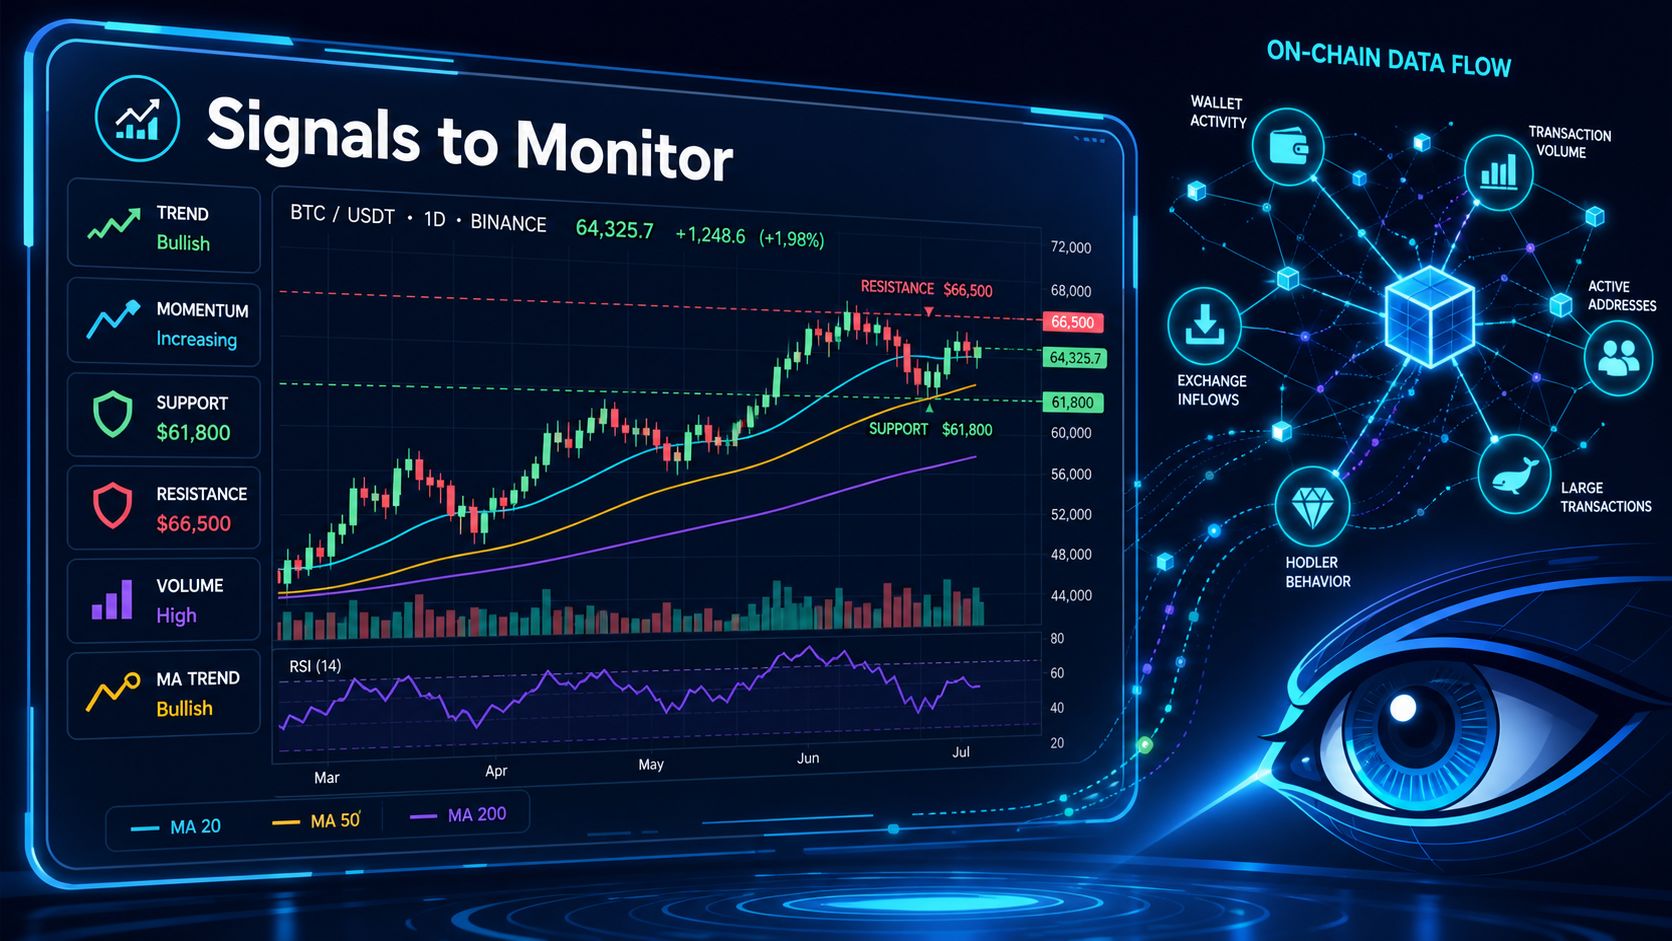
For that reason, price tracking needs two layers. First, get the live quote, volume, and chart structure. Then check wallet activity and venue behavior to see who is behind the move. That second layer is where raw price data starts turning into tradable signals.
Start with the basics, but treat them as context rather than a trigger.
Those metrics help frame the trade. They do not explain who is accumulating, who is distributing, or whether the move is likely to continue.
| Platform | Best For | Key Feature |
|---|---|---|
| CoinGecko | Range checking | Historical high and low reference points |
| CoinCarp | Historical tape review | Date-based price history |
| eToro | Cross-platform quote comparison | Alternate live quote view |
| TradingView | Chart execution | Short-term and medium-term chart tracking |
| On-chain analytics tools | Wallet behavior analysis | Identifying who may be driving moves |
Aggregators answer the pricing question quickly. TradingView helps with execution and level mapping. On-chain tools add the missing part: wallet intent.
That distinction matters in fast markets. A breakout with strong wallet accumulation usually trades differently from a breakout driven by short-lived retail chasing.
Use a workflow that gets you from quote to conviction in a few minutes:
I track CC this way because the chart usually shows the result after the better wallets have already acted. Tools like Wallet Finder.ai help close that gap. You can monitor which wallets are entering, whether they are scaling in or taking profit, and whether their behavior matches the price move you are seeing on screen.
A live quote gives you the market state. Wallet flow gives you the reason, and sometimes the early signal.
You see CC break higher on the chart, volume picks up, and the first instinct is to treat it like a standard momentum trade. That approach misses the core advantage. Price is the output. The better question is who is creating that move, through what channel, and whether the flow is strong enough to hold after the first reaction.
CC trades on a more conditional framework than many retail coins. Canton's discussion of how to think about FDV makes that clear. The network describes a model with no hard cap on issuance, while burn activity can reduce supply as usage grows. For traders, that means the ticker alone is not enough. You need to read token mechanics and wallet behavior together.
A static supply model leads to lazy valuation work. CC requires more care because issuance and burn can both matter at the same time. That changes how traders should interpret market cap, dilution risk, and upside assumptions.
A low token price does not automatically mean value. A higher valuation does not automatically mean excess. The trade depends on whether network use, participant incentives, and token flow are supporting the move.
Here is the practical read:
Traders who want cleaner entries should pair this with a short list of technical indicators that actually matter in crypto trading, then confirm whether wallet activity supports the chart signal.
CC can move because exchange traders are chasing momentum. It can also move because validators, strategic holders, or better-informed wallets are positioning around network activity that the wider market has not priced yet. Those are very different signals.
That distinction is where on-chain work starts to produce alpha. A breakout driven by scattered small wallets usually behaves differently from one backed by concentrated accumulation. If a few smart-money wallets build size before price expands, the move often has better follow-through. If price runs first and strong wallets are absent, the rally is easier to fade.
| Driver | Surface read | Better trading read |
|---|---|---|
| Exchange buying | Buyers are active | Check whether large wallets are also adding |
| Supply changes | Circulating number moved | Ask whether usage is offsetting issuance |
| Sharp price spike | Momentum is back | Identify whether informed wallets led the move |
| Valuation debate | Market cap looks low or high | Compare token mechanics, wallet flow, and actual demand |
This is the gap many traders never close. They watch the chart update in real time, but they do not track the wallets that often move before the chart becomes obvious. Wallet Finder.ai helps close that gap by showing which wallets are buying, how they scale into positions, and whether they are distributing into strength.
That matters with CC because price discovery can be shaped by participants outside the usual retail crowd. If wallet clusters tied to strong past performance start accumulating while price is still sitting near resistance, that is actionable information. You are no longer reacting to the move. You are reading the intent behind it.
Useful signals tend to line up across a few layers:
The mistake is forcing a simple meme-coin framework onto a coin with more complex mechanics. CC is easier to trade when you stop asking only where the price is and start asking who is behind it.
CC's history matters because it tells you the kind of market you're dealing with. This is not a slow, sleepy chart. It's a coin that has already shown it can reprice quickly, which means timing matters and hesitation gets punished.
CoinCarp's historical Canton Network data shows an all-time low of $0.05895 on Dec. 6, 2025 and an all-time high of $0.1941 on Feb. 3, 2026. That was a roughly 229% move in just under two months.
First, CC can transition from neglect to attention fast. When a coin has already made that kind of move over a short window, you shouldn't expect clean, patient pullbacks every time. These assets often move in bursts.
Second, volatility cuts both ways. Traders love the upside when price expands, but many underestimate the mental pressure of holding through violent repricing. If your plan depends on “seeing how it feels,” you won't execute well.
Historical price performance is useful for framing behavior:
There's another practical detail in the recent tape. Earlier market snapshots placed CC around the mid-$0.15 range over several late-May 2026 dates, while more recent live quotes have been closer to the low-$0.16 area in quoted snapshots from market platforms. I don't use that as a prediction. I use it as a reminder that CC has been trading in a zone where a relatively small nominal move still matters for trade timing.
Historical volatility doesn't predict the next move. It tells you the kind of discipline the next move will require.
The biggest takeaway isn't that CC went from low to high quickly. It's that the market was willing to completely revalue the coin in a short period. That's the signature of an asset where catalysts, positioning, and flow can matter as much as static fundamentals in the near term.
For traders, that means one thing. Build plans for volatility before volatility arrives.
For near-term trading, CC has one job: hold the levels that keep the bullish structure alive. The technical reference that matters most comes from a market analysis cited in a YouTube discussion of the setup, which identifies critical support near the 0.618 Fibonacci retracement around $0.14, a primary institutional entry zone between $0.118 and $0.120, and a bullish breakout path toward $0.17 resistance if support holds.
That gives you an actionable map. It does not give you permission to trade blindly.
Think in scenarios, not predictions.
| Level or zone | Why it matters | What to watch |
|---|---|---|
| ~$0.14 | Key support at the 0.618 retracement | Does price hold and reclaim strength, or lose structure? |
| $0.118 to $0.120 | Reported institutional entry zone | Signs of accumulation versus weak bounces |
| $0.17 | Nearby resistance and breakout test | Whether buyers can sustain acceptance above it |
The simplest read is this: if CC defends the support area, bullish continuation stays on the table. If it loses that structure, the market may seek lower liquidity and better value before trying again.
A lot of traders stop at support and resistance. That's useful, but it's not enough. The better question is whether wallet behavior confirms the chart.
Look for alignment between the level and the flow:
If you're building your own process, it helps to study a framework of the best indicators for crypto, then adapt those indicators to CC's market structure instead of using them mechanically.
Signal to respect: The best setup is when technical levels and wallet behavior say the same thing. When they disagree, reduce confidence.
Smart money isn't a magic label. It usually means wallets with a history of better timing, cleaner exits, or more consistent positioning. For CC, the useful on-chain question is whether stronger wallets are stepping in near support, scaling around the cited accumulation band, or unloading into visible strength.
That matters because price often advertises the move after informed participants have already acted. Your job is to catch the behavior early enough that the chart confirmation still offers a trade, not just a headline.
Most traders lose time in the same way. They identify a token after the move becomes obvious, then scramble to guess whether stronger wallets are still in it. A better process is to start with the token, identify the wallets that trade it well, and build alerts around those wallets before the next burst of activity.
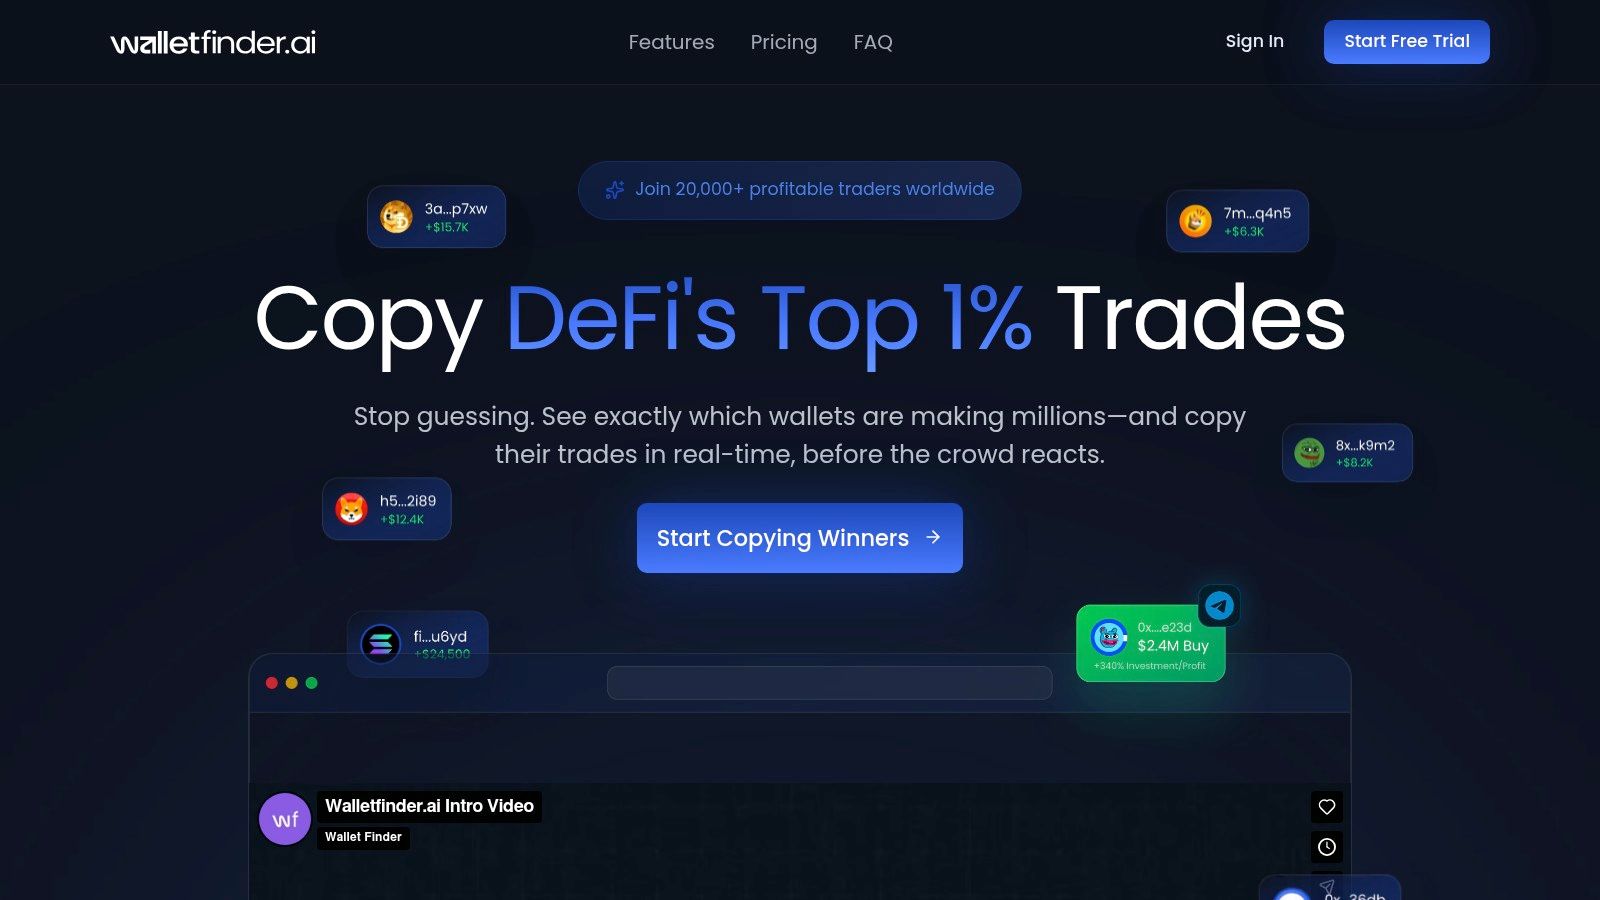
A tool like Wallet Finder.ai is useful for that workflow because it turns scattered on-chain activity into something you can screen, compare, and monitor.
Start with token discovery. Search for CC in the token view, then look for wallets that are actively touching the asset instead of wallets that only traded it once. The point isn't to find the loudest trader. It's to find repeatable behavior.
Use this filter logic:
Not every profitable wallet is copyable. Some are too early, some are too fast, and some operate in ways that don't fit your own execution speed.
What I'd check before following any CC wallet:
A good copy-trading process depends less on finding a genius wallet and more on finding one whose behavior you can execute. For deeper playbooks, review these copy trading strategies.
Once you've identified wallets that trade CC intelligently, the next step is to stop checking manually. Build a watchlist and push those signals into alerts so you know when tracked wallets buy, sell, or rotate.
That gives you a practical edge:
Later in your workflow, video walkthroughs can help tighten execution.
What works is using wallet data as confirmation. If CC is holding a key level and stronger wallets keep adding, that's useful. If price looks strong but your tracked wallets are discreetly reducing exposure, that's useful too.
What fails is blind copying. Never assume another wallet's entry is automatically your entry. You don't know their full thesis, risk tolerance, or hedge. The edge comes from seeing informed behavior early and fitting it into your own plan.
CC has already shown that it can reprice fast. That means risk management isn't optional. It's part of the trade, not an afterthought after the market turns against you.
Keep the rules simple and strict:
Good traders don't avoid losses. They prevent one bad CC trade from doing portfolio-level damage.
If you want to trade CC with more than a price ticker and a guess, Wallet Finder.ai helps you track profitable wallets, monitor token activity, and turn smart-money flow into real-time trading signals before the broader market catches up.

A premier DeFi analytics platform empowering traders to discover and analyze profitable blockchain wallets, trades and tokens.

