
Recovery Factor Calculation for Smart Traders
Master the recovery factor calculation to measure a strategy's resilience. Learn the formula, see DeFi examples, and find top wallets with Wallet Finder.ai.

June 20, 2026


Wallet Finder
February 15, 2026

Feeling like you're trading blind, basing decisions on hype instead of hard numbers? Let's fix that. Forget guesswork. This guide provides a systematic way to calculate potential crypto profits, turning abstract market swings into tangible figures you can act on. This isn't about finding a magic tool; it's about mastering the method behind any good crypto future profit calculator.

This structured approach is crucial in a market defined by both extreme volatility and massive opportunity. To give you some perspective, the crypto market's transaction value shot up from $910.3 million in 2021 and is projected to hit a mind-boggling $6.16 trillion by 2026. Some analysts even see it reaching $20.01 trillion by 2031. With that much capital in play, the trading possibilities are endless.
Plugging numbers into a random online calculator is easy, but most miss the most critical component: realistic data. An effective profit calculation hinges on the quality of your inputs. To make your calculations actionable, you must define these key variables:
This guide will show you how to source these variables intelligently. By analyzing what successful traders are actually doing, you can fill your calculations with data grounded in reality, not just wishful thinking. For a deeper dive into the basics, our guide on how to calculate crypto profit is a great place to start.
Key Takeaway: A "crypto future profit calculator" isn't a piece of software—it's a strategic process. Your success ultimately comes down to the quality of your inputs. This is precisely why basing your numbers on the proven strategies of top wallets, a core feature of platforms like Wallet Finder.ai, is such a game-changer.
Before you can realistically forecast a trade's outcome, you must master the basic math. Forget the complex jargon; Profit and Loss (PnL) calculations are simple. They are the engine behind any crypto future profit calculator, whether you're using a spreadsheet or a sophisticated platform.
The goal isn't just to memorize a formula but to build an intuition for how it works. That gut feeling for a trade's potential is what separates consistently profitable traders from those who are just getting lucky. Let's break down the two main formulas you'll live by.
When you buy and hold a coin on the spot market, the math is straightforward. You're calculating how much the price changed and multiplying it by the amount of the asset you own.
Formula: PnL = (Exit Price - Entry Price) * Position Size
Actionable Example:
($3,300 - $3,000) * 1 = $300 profit (gross profit before fees).This visual gives you a quick side-by-side of how spot and futures PnL compare.
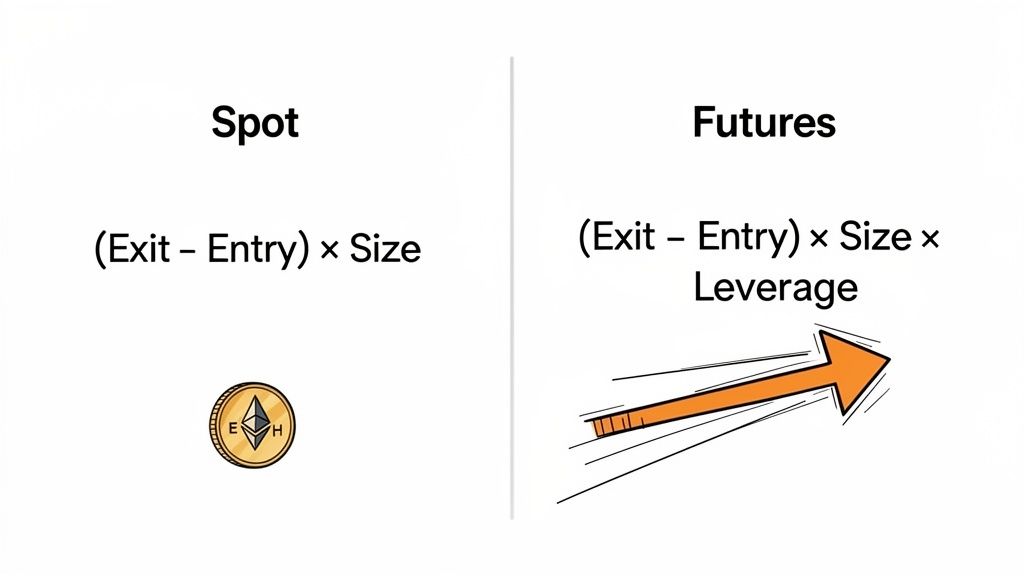
You can see right away how adding leverage completely changes the game, which is exactly what we'll get into next.
Futures introduce leverage, a powerful way to gain more market exposure without putting up the full capital. Because of this, the PnL formula gets one critical addition.
Formula: PnL = (Exit Price - Entry Price) * Position Size * Leverage
Actionable Example:
Let's use the same ETH trade, but with leverage. Instead of buying 1 ETH for $3,000 on spot, you open a futures position.
When the price moves from $3,000 to $3,300 (a $300 jump), the PnL calculation becomes:
($3,300 - $3,000) * 1 * 10 = $3,000 profitThe Power of Leverage: The difference is staggering. The spot trade netted a 10% return on your $3,000 capital. The 10x leveraged trade, on the other hand, delivered a 1,000% return on your tiny $300 margin. This amplification is what makes futures so appealing, but remember—it cuts both ways and magnifies losses just as easily.
Getting these two formulas locked in is the absolute first step. If you want to dive deeper into tracking your portfolio's overall health, our guide on profit and loss analysis has more detail. Once these concepts click, you'll have a solid foundation for forecasting what your trades could actually look like.
The gross profit you see after a winning trade is exciting, but it’s not what hits your account balance. The real measure of success is your net profit. To calculate it, you must account for the small, relentless costs that quietly erode your gains. Ignoring these is like filling a leaky bucket; you'll lose more than you realize. These details can be the difference between a profitable strategy and a losing one.
The most obvious costs are trading fees. Every exchange charges these for each transaction.
Slippage is another critical cost, especially in volatile markets. It's the difference between the price you expected and the price your trade actually executed at. During a sudden pump, your buy order might fill at a higher price than you clicked, digging into your potential profit.
If you trade perpetual futures, funding rates are a constant you can't ignore. These are small payments made between long and short positions to keep the futures price anchored to the spot price. If you're long and the funding rate is positive, you pay a fee to shorts, typically every eight hours. A single payment might seem tiny, but these add up significantly if you hold a position for days. I’ve seen trades that were profitable on paper turn into losers because of high funding rates. To get a deeper understanding, check out our complete guide on crypto funding rates.
A savvy trader knows their break-even point isn't just their entry price—it's their entry price plus all associated costs. Always calculate these expenses beforehand to set realistic profit targets.
Cost FactorDescriptionExample Impact on ProfitTrading FeesFees charged by the exchange for executing your trade (e.g., 0.06% taker fee).-$0.60SlippageThe price difference between order placement and execution due to volatility (e.g., 0.1% slippage).-$1.00Funding RatePeriodic payments for holding a futures position (e.g., one 0.01% payment).-$0.10Total CostsThe sum of all hidden expenses that reduce your gross profit.-$1.70
As you can see, even on a small trade, these costs add up. Imagine this effect scaled over hundreds of trades with larger position sizes. It becomes clear why accounting for every cent is non-negotiable.
The formulas are the easy part. A crypto profit calculator is only as good as the numbers you feed it, and this is where most traders fail. Pulling entry and exit targets out of thin air is a surefire way to get wrecked. Instead of guessing, ground your forecasts in the real-world performance of proven traders.
Here is a step-by-step actionable plan:
First, you need to find a "smart money" wallet that's consistently profitable on the asset you're watching. This is exactly what platforms like Wallet Finder.ai were built for. You can filter traders by total profit, win rate, or the specific tokens they trade.
Actionable Example: Say you're bullish on a Solana memecoin, $WIF. Instead of just aping in, you use Wallet Finder to find wallets with a high PnL and a solid track record trading $WIF.
Once you have a promising wallet, go deep. The real gold is in the individual trades. Your mission is to understand their strategy. Pull up their last 5-10 winning trades on that token and look for patterns:
By gathering this data, you're building a realistic trading model based on demonstrated success.
Pro Tip: Look for consistency above all else. A wallet with one lucky, massive win and a sea of small losses isn't a great model. What you want is a wallet showing a steady stream of repeatable, moderately-sized wins. That signals a replicable strategy, not a lottery ticket.
Now you have high-quality, data-driven inputs for your calculator. Let's say your deep dive on the top $WIF trader revealed a clear pattern:
Armed with this intel, you can run a calculation that actually means something.
Let's plug these data-backed numbers into the PnL formulas we covered earlier.
ScenarioEntry PriceExit PricePosition SizeLeverageGross Profit CalculationEstimated PnLSpot Trade$2.50$3.252,000 $WIF ($5,000)1x($3.25 - $2.50) * 2000$1,500Futures Trade$2.50$3.252,000 $WIF ($5,000)10x($3.25 - $2.50) * 2000 * 10$15,000
This process turns your calculator from a math tool into a potent trade-planning system. You're no longer asking, "What if the price goes up?" Instead, you're asking, "What would my PnL look like if I could execute with the precision of a top trader?" This is the shift from gambling to strategic, data-backed trading.
Here's a brutal truth most traders learn the expensive way: your calculator can perfectly project a $5,000 profit, but if you can't actually execute the exit at your target, the calculation meant nothing. The gap between theoretical profit and realized profit isn't about math—it's about psychology. And psychology follows predictable patterns you can account for.
The two most common profit-killing mistakes are:
Both destroy your edge, and both can be planned for mathematically before you ever enter the trade.
Let's say your calculation shows a realistic target of $3.25 for that $WIF trade we modeled earlier (entry at $2.50). Your projected profit: $1,500.
But when the price hits $3.00 (giving you a $1,000 profit), something changes. Your brain starts screaming: "Lock it in! What if it crashes?" You exit at $3.00, leaving $500 on the table.
Do this ten times, and you've bled $5,000 in unrealized profit. Your calculator was right—your discipline wasn't.
The mathematical solution: Tiered profit-taking
Instead of a single exit target, calculate multiple exit levels based on probability-weighted outcomes.
Example calculation:
Starting position: 2,000 $WIF at $2.50 (total cost: $5,000)
Exit tiers:
$WIF × ($2.90 - $2.50) = $266 locked in$WIF × ($3.15 - $2.50) = $433 locked in$WIF × ($3.40 - $2.50) = $600 locked inTotal realized profit: $1,299
Is this less than the perfect $1,500 you'd get if you held everything to $3.25? Yes. But it's way more than the $1,000 you'd get by panic-exiting everything at $3.00.
Why this works psychologically:
By taking that first 33% at $2.90, you've already banked $266. Now the remaining position is "playing with the house's money." This removes the anxiety that causes early exits. Your calculator now becomes a behavioral planning tool, not just a math exercise.
The flip side: you enter that same $WIF trade at $2.50, but instead of pumping, it dumps to $2.20. Your calculator shows a -$600 loss at your stop-loss of $2.30.
But when price hits $2.30, you freeze. "Maybe it'll bounce here. I'll just wait a bit." It keeps falling to $2.10. Now you're down $800. You still don't sell. "It's already down so much, might as well wait for a bounce."
This is the sunk cost fallacy in action. Your original calculation was correct (stop at $2.30, lose $400). By hoping instead of executing, you turned a $400 planned loss into an $800+ disaster.
The mathematical solution: Pre-define the maximum loss multiple
Before entering any trade, calculate not just your stop-loss level, but the maximum acceptable loss as a multiple of your planned stop.
Rule: If price blows through your stop by more than 1.5x your intended loss, you automatically exit at market, no questions asked.
Example:
At $2.20, you don't think, you don't hope—you exit. Your calculator defined the line in advance.
Here's where most traders' projections fall apart: they calculate potential profit on individual trades but never calculate the aggregate win rate required to be profitable over many trades.
Your futures calculator shows you could make $3,000 on a winning trade. Great. But what if you lose $1,000 on three losing trades before that winner? You're break-even, not profitable.
The break-even win rate formula:
Break-even Win Rate = Risk ÷ (Risk + Reward)
Example:
Break-even Win Rate = $500 ÷ ($500 + $1,500) = 25%
This means you only need to win 25% of your trades to break even. Win more than 25%, and you're profitable. This is huge. Your calculator can show you a $5,000 winner, but if your win rate is below your break-even threshold, you'll still lose money over time.
Action step:
After modeling your next trade's profit potential:
If your required win rate is 60%+ but you've historically won 40% of trades, your calculator is lying to you. Adjust your profit targets or stop-loss levels until the math aligns with reality.
A crypto profit calculator showing massive potential gain is only looking at one side of the coin. Without a plan for when things go wrong, you're not trading—you're gambling. This is where you build a robust plan to protect your capital from emotional decisions.
The cornerstone of this professional approach is disciplined risk management. A golden rule many traders live by is the 1% rule: never risk more than 1% of your total trading capital on a single trade. If you have a $10,000 portfolio, your maximum loss on any position is just $100. This is the secret to staying in the game.
This simple process flow is a great mental model for how to use on-chain data to find, analyze, and map out your trades before risking real capital.
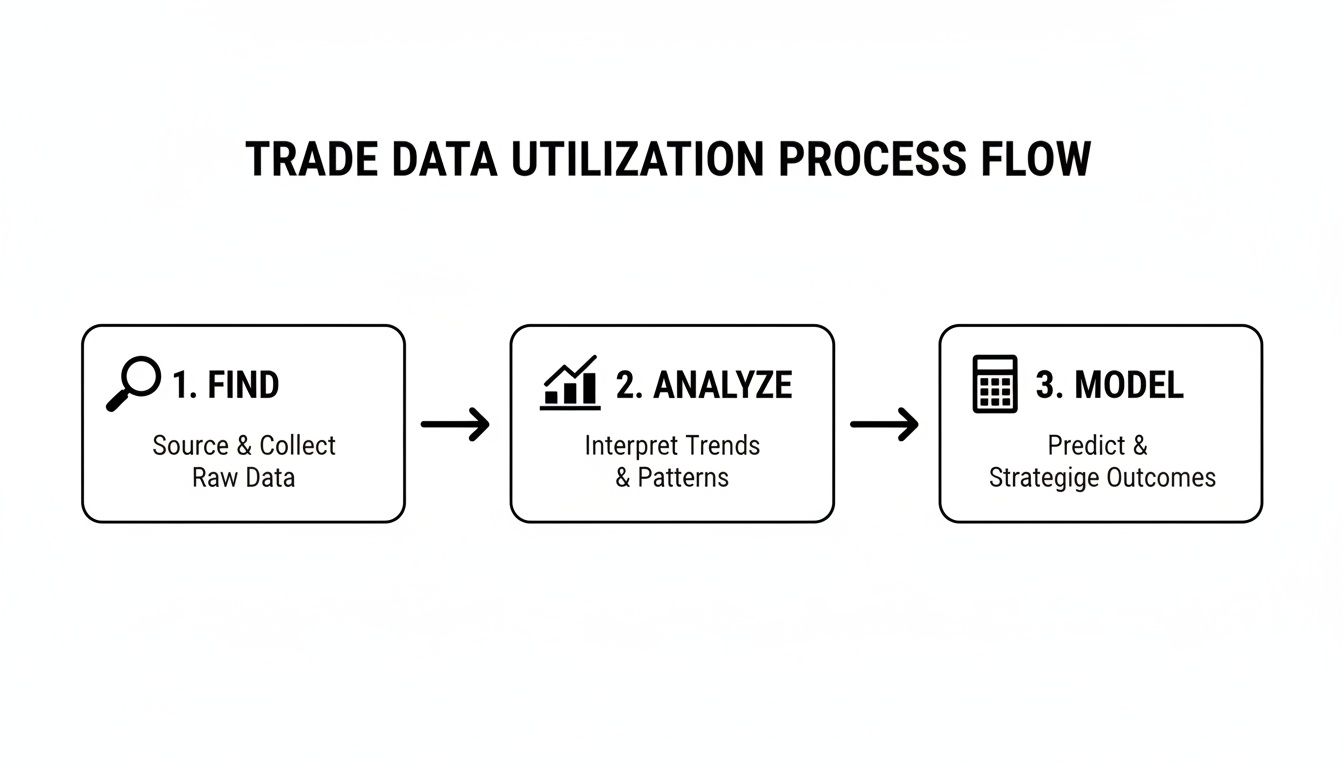
This highlights the structured approach: first, find smart money wallets, then analyze their strategies, and finally, model potential outcomes with a calculator.
Once you've defined your maximum acceptable dollar loss ($100 in our case), you can determine your perfect position size. The trick is to work backward from your stop-loss—the price where you'll automatically exit to cut your losses.
Let's imagine you want to go long on ETH at $3,500 and set your stop-loss at $3,450. The distance to your stop is $50 per ETH. To calculate your position size, you divide your max risk by that distance:
$100 / $50 = 2 ETH
Just like that, your position size is perfectly aligned with your risk tolerance. This forces you to think defensively first.
Your futures profit calculator is probably focused on price movements. Buy low, sell high. But there's an entirely separate profit source in perpetual futures that most calculators ignore: funding rates.
Every 8 hours, longs pay shorts (or vice versa) to keep the perpetual futures price anchored to the spot price. When funding is positive, longs pay. When it's negative, shorts pay. These payments can be tiny—or they can be massive opportunities.
During extreme market conditions, funding rates spike. I've seen rates hit 0.1% per 8-hour period (that's 1.095% per day when annualized).
Here's how to calculate if a funding rate arbitrage is profitable:
Scenario:
Strategy:
Profit calculation:
Position size: 100 SOL × $115 = $11,500
Funding payment per period: $11,500 × 0.08% = $9.20 every 8 hours
Daily funding income: $9.20 × 3 = $27.60/day
Monthly projection: $27.60 × 30 = $828/month
Annual yield: ($828 × 12) / $11,500 = 86% APY
The catch:
You're exposed to:
When this works:
Funding rate arbitrage is profitable when:
Calculator formula:
Break-even holding period = (Spot-Futures Spread) / (Funding Rate × 3 per day)
If the futures are trading at a $2 premium and funding is 0.08%:
Break-even = $2 / ($11,500 × 0.08% × 3) = $2 / $27.60 = 0.07 days
You break even in under 2 hours. After that, it's pure profit.
Sometimes funding goes negative. This means shorts pay longs. The arbitrage flips:
Same math, reversed positions. During bear markets, negative funding can be just as extreme as positive funding in bull markets.
Real-world example:
During the May 2021 crash, SOL funding went as negative as -0.15% per 8 hours on some exchanges. Traders who went long futures + short spot were collecting 1.35% per day in pure funding income while remaining market-neutral.
Over a week: 9.45% return with zero directional risk.
With your position size locked in, you can now use your calculator for scenario planning.
You need to ask specific questions and calculate the answers for each scenario:
($3,700 - $3,500) * 2 ETH = $400 profit.($3,450 - $3,500) * 2 ETH = -$100 loss.This analysis is critical, especially in fast-moving markets. For instance, the Asia-Pacific region is set to become the fastest-growing crypto market, projected to expand at a 29.24% CAGR and lead revenue generation by 2031. For traders using tools like Wallet Finder.ai, this growth means a constant stream of new, sophisticated "smart money" wallets to analyze. You can discover more insights about global crypto market growth on mordorintelligence.com.
By pre-calculating both your potential profit and your pre-defined loss, you remove emotion from the equation. The trade becomes a simple execution of a well-defined plan.
Here are some of the most common questions from traders trying to map out their potential profits and risks.
This is one of the most critical calculations for futures traders, yet most profit calculators never address it.
The formula:
Required Win Rate = Risk / (Risk + Reward)
Example:
Your stop-loss is $500, your profit target is $1,500. Your Risk:Reward is 1:3.
Required Win Rate = $500 / ($500 + $1,500) = $500 / $2,000 = 25%
You need to win just 25% of your trades to break even over time.
Why this matters:
If you're chasing 1:10 risk-reward setups, your required win rate is only 9.1%. But those trades are hard to find and harder to execute. If you're trading 1:1 risk-reward, you need a 50% win rate just to break even—and fees will push that higher.
Rule of thumb:
Track your actual win rate over 30 trades. If it's below your required rate, either tighten your stops (increase reward) or accept smaller profits (decrease reward) to raise your win rate.
Not all exchanges calculate margin and liquidation the same way. This drastically affects your real-world PnL.
The two main types:
1. Cross Margin:
2. Isolated Margin:
Calculation difference:
Example: You have $10,000 total. You open a $5,000 position with 10x leverage.
Cross margin:
Isolated margin:
When using a profit calculator, always know which margin type your exchange uses. Cross margin makes your calculator more optimistic (bigger drawdowns tolerated). Isolated margin makes it more pessimistic (faster liquidations).
Best practice:
Use isolated margin for aggressive trades, cross margin for high-conviction, lower-leverage positions.
Your calculator might show a $5,000 profit target at $120 for SOL, but if SOL's average daily move is only $2 and you're targeting a $10 move, your target is unrealistic.
The volatility-adjusted profit target formula:
Realistic Target Price = Entry Price + (ATR × Multiplier)
ATR (Average True Range) is the average price movement over the last 14 days.
Example:
Conservative target: $115 + ($8 × 1.5) = $127Aggressive target: $115 + ($8 × 2.5) = $135
Anything beyond $135 requires volatility to expand beyond recent norms. It's possible, but not something to base your core calculation on.
How to find ATR:
Most charting platforms (TradingView, exchange charts) have ATR as a built-in indicator. Look for the current ATR value and multiply by your confidence level.
Volatility-adjusted stop-loss:
The same logic applies to stops:
Realistic Stop Price = Entry Price - (ATR × 0.5 to 1.0)
If ATR is $8, your stop should be $4-$8 away from entry. Tighter than that, and you'll get stopped out by normal noise. Wider, and you're risking too much per trade.
This is the profit-killer nobody talks about. Your calculator shows $10,000 in profit. You celebrate. Then tax season hits, and you owe $3,700. Suddenly your "winning year" feels a lot smaller.
Futures tax treatment (US-specific, consult your CPA):
Futures are taxed under Section 1256, which offers a more favorable tax treatment than spot trading:
Calculation:
You made $10,000 trading SOL futures.
Your after-tax profit: $10,000 - $2,480 = $7,520
That's 25% less than your calculator showed.
Non-US traders:
Tax treatment varies wildly:
Action step:
When using a profit calculator, multiply your gross profit by your after-tax multiplier:
This is your real profit. Plan accordingly.
Hands down, your entry and exit prices. Everything else is secondary.
Your entire profit and loss scenario pivots on these two figures. If they're based on wishful thinking, your calculations will be useless. This is where a tool like Wallet Finder.ai becomes so valuable, it lets you see the actual entry and exit points of traders with a proven track record, giving you a much more realistic, data-driven starting point.
Leverage is a powerful tool, but it's also a double-edged sword that can wipe you out in minutes. It magnifies losses just as aggressively as gains.
With 10x leverage, a tiny 5% price move against you instantly translates to a 50% loss of your capital. A 10% move against you? That's a 100% loss. You're liquidated. This is why you must model the downside with a calculator and always use a stop-loss when trading futures.
A trader who only calculates potential profit is just gambling. True professionals calculate their risk first to make sure they live to trade another day.
Absolutely. The math for PnL is the same for Bitcoin or a new memecoin. The difference isn't in the formula but in the inputs you use.
For highly volatile assets, you must be realistic about a few things:
When projecting profits on these, tighten your stop-losses and be more conservative with your profit targets.
For 99% of traders, tracking your performance in a stable currency like USD is the only way to go. It gives you the clearest, most honest picture of your performance.
When you calculate in the crypto you're trading, its own price volatility can distort your results. Did you make a great trade, or did the coin's price just pump? Tallying everything in USD shows you the real fiat value you've gained or lost, making it much easier to track your growth.
Ready to stop guessing and start building your trade plans with real-world data? Wallet Finder.ai shows you exactly how the top wallets are positioning themselves.
Grab a free 7-day trial and see what a difference on-chain intelligence can make.

A premier DeFi analytics platform empowering traders to discover and analyze profitable blockchain wallets, trades and tokens.

