
Recovery Factor Calculation for Smart Traders
Master the recovery factor calculation to measure a strategy's resilience. Learn the formula, see DeFi examples, and find top wallets with Wallet Finder.ai.

June 20, 2026


Wallet Finder
February 5, 2026

It's a classic rookie mistake: subtracting your buy price from your sell price and calling it a day. The hard truth? That simple math gives you a dangerously incomplete picture of your crypto profitability. Real gains are almost always smaller than they appear, thanks to a host of hidden costs that can chip away at—or completely wipe out—what looked like a solid win.
Many traders find out too late that the profit numbers they've been tracking are flat-out wrong. When you rely on surface-level math, you're ignoring the silent killers of your returns. This oversight doesn't just hurt your ego; it leads to bad trading decisions based on flawed data.
Getting a grip on your true profitability means you have to look beyond the basics. The nature of crypto—its volatility and decentralization—introduces costs that don't exist in traditional finance. Acknowledging and tracking these factors is the only way to get an honest assessment of your performance. For a deeper dive on another key metric, check out our guide on how a crypto average calculator works.
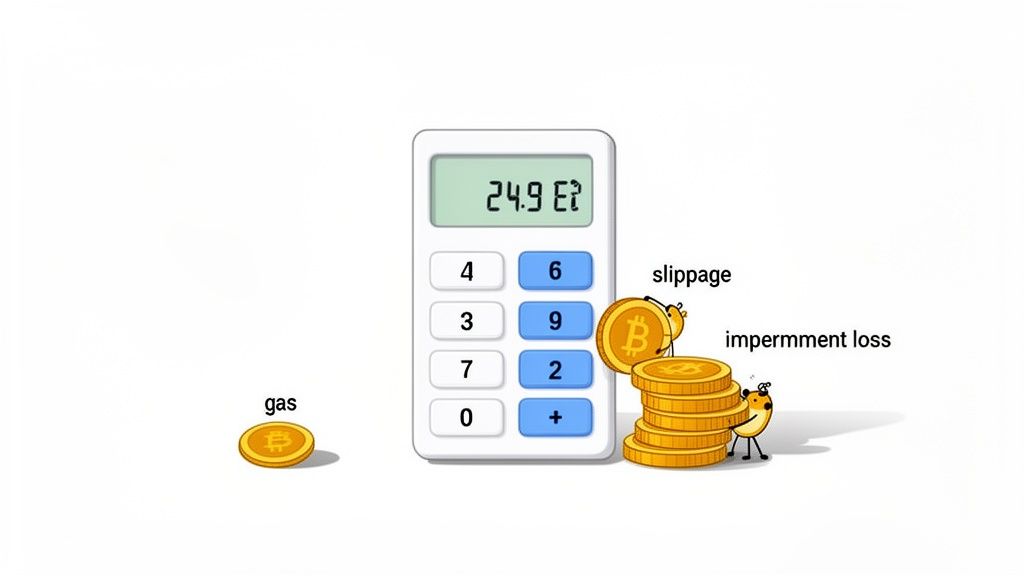
So, what are these profit-eating gremlins? They are everyday realities for anyone active in the crypto space, especially in DeFi. Ignoring them means you’re flying blind.
Here is an actionable checklist of costs to track for every trade:
Here’s where it gets real: Confusing revenue with profit is the fastest way to lose money. A $100 gain on paper can easily flip to a $20 loss once you factor in $50 in gas fees and another $70 lost to slippage on a volatile, low-liquidity token.
The gap between a quick, back-of-the-napkin calculation and a proper, comprehensive one is huge. One gives you a feel-good (but false) number, while the other gives you the truth about your financial standing. Here’s a breakdown of what often gets missed.
By moving from the simple column to the comprehensive one, you turn a crypto profitability calculator from a source of false confidence into a powerful tool for genuine financial insight.
To stop guessing and start knowing, you need to master a few key formulas. These are the tools that tell you if your strategies are actually paying off.
Let's kick things off with the most basic metric: Profit and Loss (PnL). This formula gives you the bottom-line dollar amount a trade made or lost.
The formula itself is simple:
Net PnL = (Current Value - Initial Cost) - Fees
This formula forces you to be honest. You must account for every single cost, from the initial buy-in to gas fees, leaving you with a number that reflects reality.
While PnL shows you the raw cash, Return on Investment (ROI) puts it in perspective. It measures your profit relative to how much capital you put in, making it the perfect metric for comparing different assets. Was that Solana trade really better than your Ethereum stake? ROI holds the answer.
It’s calculated as a simple percentage:
ROI = (Net PnL / Initial Cost) x 100%
A high ROI tells you your money is working hard for you. This is the figure that helps you decide where to put your funds for the best bang for your buck.
Real-World Example: PnL vs. ROI
Let's say you buy 10 SOL for $1,000. You ride the wave and sell it later for $1,500, but you paid $50 in total fees along the way.
- Net PnL: ($1,500 - $1,000) - $50 = $450 profit
- ROI: ($450 / $1,000) x 100% = 45% return
That $450 PnL feels great, but the 45% ROI is the number you'll use to measure this trade's success against every other move you make.
When you venture into staking and yield farming, you’ll run into two terms constantly: APR (Annual Percentage Rate) and APY (Annual Percentage Yield). Mixing these up can seriously throw off your profit projections.
Here’s the breakdown:
Because it captures that snowball effect, APY will always be higher than APR for the same asset (as long as it compounds more than once a year). When you’re calculating staking profits, always double-check whether the platform is showing you APR or APY.
For a deeper dive into these calculations across different scenarios, check out our guide on how to calculate crypto profit.
These core formulas—PnL, ROI, APR, and APY—are the essential tools of the trade. They turn a messy transaction history into clear, actionable intelligence, giving you the power to make much smarter decisions.
If you're an active trader, relying on the simple "sell price minus buy price" formula is a recipe for disappointment. True profitability is found in the details—specifically, in the costs that trip up most beginners. To get a real picture of your performance, you have to account for every single cost tied to a trade.
This simple flowchart breaks down the process, from plugging in your initial numbers to seeing the final result.
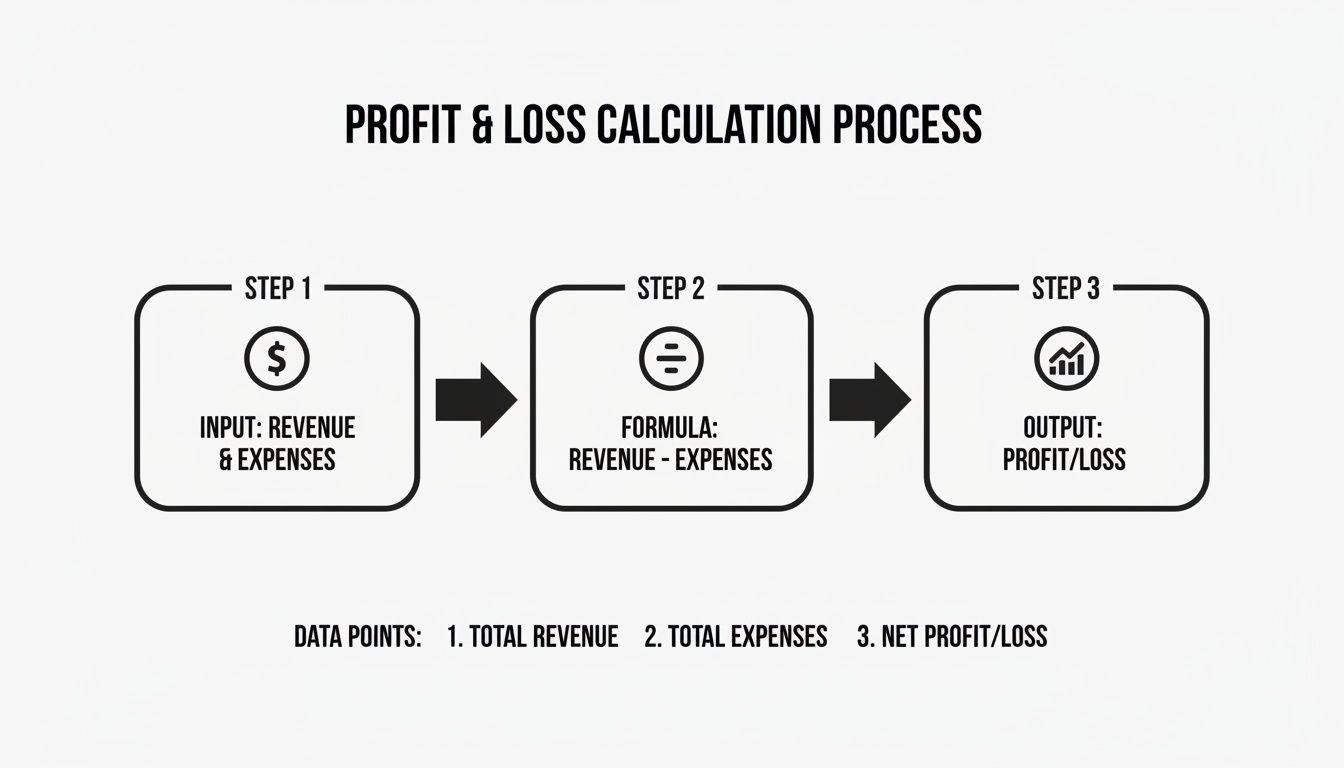
The main takeaway here is that your formula absolutely must subtract all associated costs to give you a reliable PnL figure.
To ensure you capture every cost, follow this simple, three-step process for every trade you make:
Let's walk through a realistic scenario to see just how much these costs can sting. Imagine you want to buy 1 ETH on a DEX when the price is $3,000.
A few weeks later, the price of ETH climbs to $3,200, and you decide to lock in your profits.
Now, for the moment of truth. Let's calculate the real PnL: $3,149.45 (Net Proceeds) - $3,070 (Total Cost) = $79.45 Profit.
If you hadn't accounted for all those costs, you would have patted yourself on the back for a $200 profit. In reality, the hidden fees wiped out over 60% of your perceived gains. This is why getting the details right is so crucial.
While calculators are great for dissecting past trades, the real edge comes from analyzing live data. For instance, top Solana wallets tracked on Wallet Finder.ai have pulled in gains over 1,200% YTD during memecoin season by leveraging real-time on-chain data—something a simple calculator could never predict. You can explore more on how these tools work for different crypto assets at Bitbo.io.
Generating passive income from staking and mining is a totally different ballgame than active trading. To get a real sense of your returns, you need a way to calculate crypto profitability that handles their unique moving parts. Just glancing at a flashy APY or a mining rig's projected output won't cut it.
That advertised APY on a staking platform is a starting point. Your actual, take-home profit requires more digging.
Here are the key factors you must bake into your calculations:
An attractive 10% advertised APY could easily shrink to a 8.5% real APY after a 10% validator commission and a 5% network tax are skimmed off the top, and that's before accounting for any slashing risk.
Mining is a business, and profitability boils down to revenue minus expenses. Any crypto profitability calculator worth its salt must account for several critical inputs that are always in flux.
These are the metrics you can't ignore:
Imagine plugging a Bitcoin miner’s specs into a crypto profitability calculator in early 2021. With Bitcoin around $30,000 and network difficulty at 20 trillion, a top-tier Antminer S19 Pro (110 TH/s) could crank out roughly 0.0006 BTC per day. Today, difficulty has skyrocketed, often pushing operations to break-even or into the red. This shows why calculation tools are so essential for miners. You can dive deeper into mining stats and play with calculators over at WhatToMine.com.
Manual calculations are a great way to learn, but they're tedious and prone to human error. One missed transaction can throw your entire performance history off track.
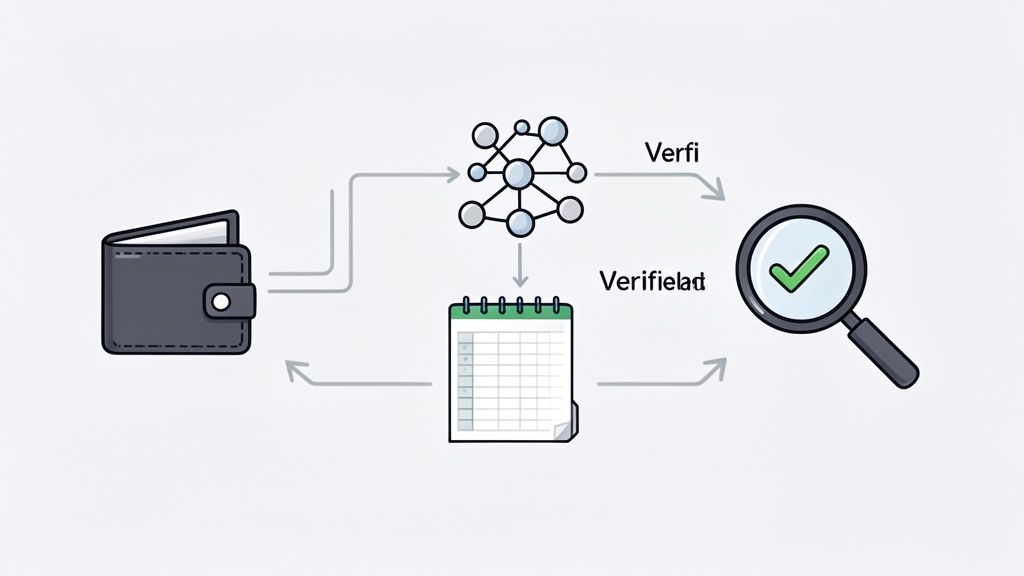
This is where you graduate to automation. Instead of wrestling with spreadsheets, you can use tools that pull verified, on-chain data directly from the source. It’s the difference between estimating your profitability and knowing it with certainty.
The magic happens when you let a modern crypto profitability calculator automate the entire process. Tools like Wallet Finder.ai can generate a complete Profit and Loss (PnL) history for any wallet, automatically accounting for every swap and fee.
The benefits are immediate:
The most successful traders don't spend their time doing manual data entry. They focus on analysis. By automating the calculation process, you free up your mental energy to focus on what actually matters—finding the next profitable move.
So, how does this work in practice? It’s about using real-world data to validate your calculations or uncover new opportunities.
Platforms like Wallet Finder.ai let you find a top-performing wallet, pull up its complete trading history, and see a real-time PnL breakdown. You can export this raw data to build your own advanced performance models or cross-reference it with your personal spreadsheet. This workflow empowers you to stop guessing and start using the same verified data the pros rely on. If you're building your own custom tools, understanding how to source this information is crucial. You can learn more about how platforms get this data through an API for crypto prices.
Ultimately, this approach transforms a simple crypto profitability calculator from a boring historical record-keeper into a powerful, forward-looking discovery tool.
Let's be honest, figuring out crypto profits can sometimes feel like trying to nail Jell-O to a wall. Even when you think you have the formulas down, tricky situations pop up. I’ve seen these same questions come up time and time again, so let's run through a quick-fire round to clear things up.
This is a big one. Your profit calculator will show you raw gains, but your true net profit is what's left after taxes. In most places, you trigger a taxable event almost every time you sell, swap, or even spend your crypto.
To get this right, you first need to know your cost basis—what you originally paid for the asset, including fees. Your taxable gain is the final sale price minus that cost basis. The rate you're taxed at depends on where you live and whether it was a short-term or long-term hold.
My two cents on taxes: Consistency is your best friend. Always use a recognized accounting method like 'First-In, First-Out' (FIFO) to keep your records straight. If you're doing more than a handful of trades a year, seriously, just get a dedicated crypto tax software. It’ll save you a world of pain.
Hands down, the single biggest mistake is completely ignoring transaction fees and gas costs. New traders almost always fall for this, just subtracting their buy price from their sell price and calling it a day. That simple math gives you a totally misleading picture of how you're really doing.
On-chain gas fees and exchange trading fees can absolutely wreck a trade. They can easily flip what looks like a nice little win into a net loss. You have to subtract every single cost from your total revenue to get an honest P&L. It’s not optional if you're serious about this.
Nope. A profitability calculator is an analytical tool, not a crystal ball. It’s brilliant at crunching historical and current numbers to tell you how profitable something was or is under known conditions. You can plug in numbers to model "what-if" scenarios, but the results are just projections, not guarantees.
The crypto market is just too wild and unpredictable. Use these calculators to analyze your past trades and to size up current opportunities. Just don't ever bank on them to tell you the future.
Impermanent loss (IL) is a sneaky risk unique to providing liquidity in DeFi. Think of it as the opportunity cost—the difference in value between keeping your tokens in a liquidity pool versus just HODLing them in your wallet.
If the prices of the two tokens you’ve pooled drift too far apart, the value of your share in the pool can end up being less than if you had just held the assets. To figure out your real DeFi profit, you have to take the trading fees you've earned and then subtract the value of your impermanent loss. Most standard calculators won't do this, so you'll need a specialized DeFi dashboard or a good spreadsheet to see your actual returns.
Stop guessing and start seeing what the most successful traders are doing in real time. Wallet Finder.ai gives you the on-chain data you need to discover winning strategies, track smart money, and act on opportunities before anyone else. Find your next profitable trade at https://www.walletfinder.ai.

A premier DeFi analytics platform empowering traders to discover and analyze profitable blockchain wallets, trades and tokens.

