
Recovery Factor Calculation for Smart Traders
Master the recovery factor calculation to measure a strategy's resilience. Learn the formula, see DeFi examples, and find top wallets with Wallet Finder.ai.

June 20, 2026


Wallet Finder
April 13, 2026
You open a staking page, see a juicy APY, and your brain starts doing fast mental math. If this keeps compounding, maybe the position pays for itself. Then the doubt kicks in. Is that yield stable? Is it auto-compounding? Is the token price falling while the calculator shows a smooth upward line?
That confusion is normal. A cryptocurrency compound interest calculator gives you the clean version of the story. It shows what happens if rewards keep getting added back to your balance. What it doesn't show by default is the messy part of DeFi: changing rates, swap costs, liquidity risk, and taxes.
Used well, though, a calculator is still one of the best tools in a crypto investor's toolkit. It helps you compare staking, lending, yield farming, and savings products on the same footing. It turns abstract APY into a future token balance you can reason about.
Most new DeFi investors make one of two mistakes.
Some ignore compounding and underestimate how much reinvesting can change a position over time. Others stare at a big APY number and treat it like a promise. Neither approach works for long.
Crypto compounding sits in the middle. It's powerful, but it's not magic. If you understand the math, you can model a position before you enter it. If you understand the risks, you can tell the difference between a solid yield source and a flashy trap.
A good calculator helps with three practical questions:
That last question matters more in crypto than in traditional finance. In DeFi, your return often depends on smart contracts, token incentives, liquidity depth, and market behavior. The advertised APY might be mathematically correct and still lead to disappointing results in your wallet.
Practical rule: Treat the calculator's output as a draft, not a verdict.
The useful mindset is simple. First, model the ideal case. Second, pressure-test it. Third, compare it with what skilled on-chain participants have achieved in similar setups.
That approach keeps you from doing two expensive things: skipping good opportunities because the math feels intimidating, or entering bad ones because the APY looked irresistible.
You'll get more value from a cryptocurrency compound interest calculator when you use it like an analyst, not like a shopper. Start with the formula. Translate APR and APY correctly. Then subtract the parts that calculators often miss, including fees, impermanent loss, and taxes. That's how a clean estimate becomes a realistic one.
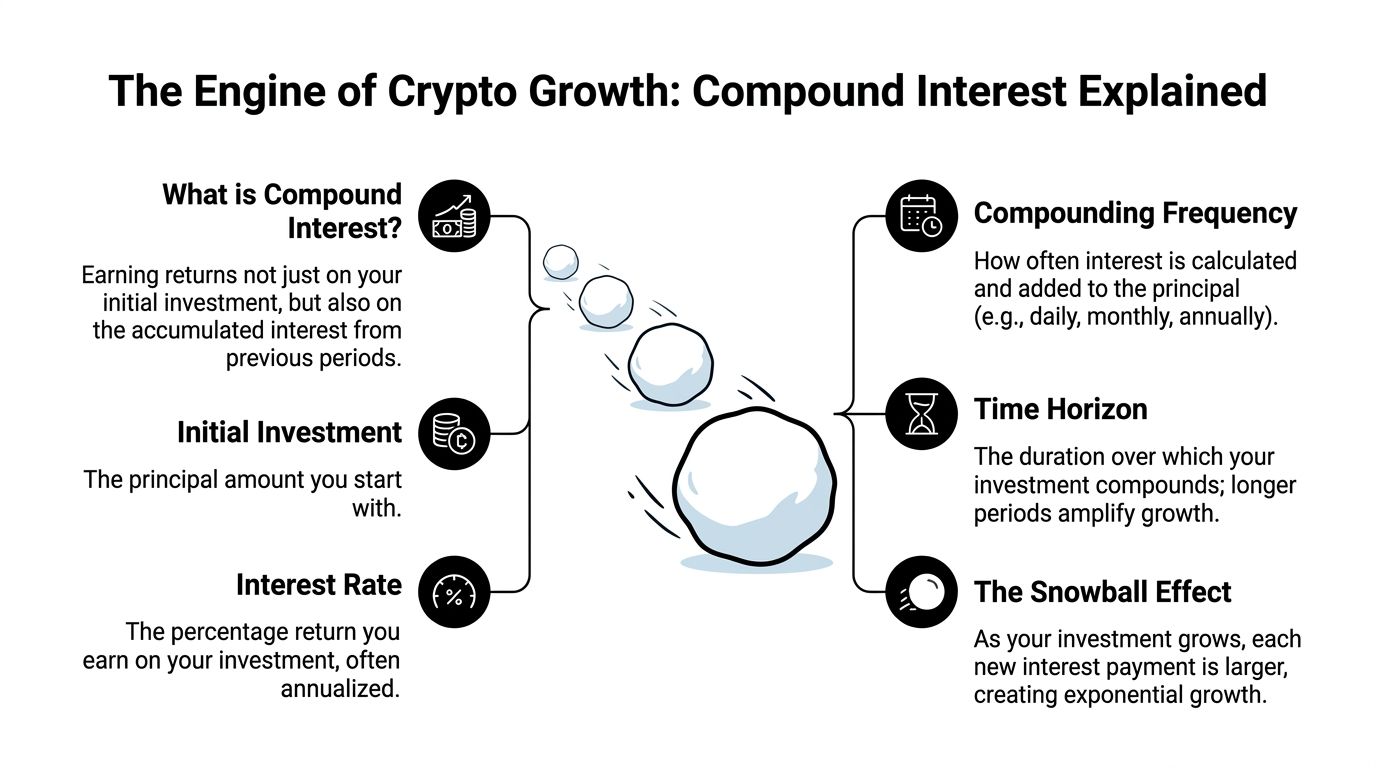
Compound interest is easiest to understand as a snowball rolling downhill. At the top, it's small. As it rolls, it picks up more snow. Then that bigger snowball picks up snow even faster.
Your crypto position works the same way when rewards are reinvested. You earn on your original deposit, then you earn on the rewards that were added back, then on the rewards from those rewards.
The core formula is A = P(1 + r/n)^nt, which has become the standard model for crypto yield calculations across staking and DeFi platforms, as explained in Pineify's overview of the crypto compound interest formula and APY examples.
The letters represent the following:
The formula matters because crypto platforms often pay rewards frequently. Daily, weekly, or automatically through smart contracts. That frequency changes the result.
Pineify gives a clean example. A $10,000 investment at 8% APY compounded daily grows to about $10,833 after one year, adding around $833 in compounding gains. Leave that same setup untouched for five years, and it reaches about $14,918, nearly 50% more than the original investment. That's the snowball effect in numbers, and it's why compounding gets more impressive with time.
Many beginners misunderstand this distinction.
APR is the base annual rate without compounding built in.
APY includes the effect of reinvesting rewards.
If a platform advertises APR, you still need to ask whether rewards are being restaked or manually compounded. If it advertises APY, the compounding effect is already included in the headline figure.
| Feature | APR (Annual Percentage Rate) | APY (Annual Percentage Yield) |
|---|---|---|
| Includes compounding | No | Yes |
| Best for | Base rate comparison | Real growth comparison |
| Typical investor question | “What is the raw rate?” | “What could my balance become?” |
| Reinvestment reflected | Not automatically | Yes |
| Usefulness in DeFi | Helpful, but incomplete | Usually more practical |
Pineify quantifies the gap clearly. A 12% APR compounded daily equals about 12.75% APY, and a 10% APR compounded daily equals about 10.52% APY. That difference may look small at first glance, but it compounds into a meaningful gap over time.
If you want a deeper plain-English refresher, this guide on what APY means in crypto is a useful companion.
Most DeFi dashboards push APY front and center because it maps more closely to what users care about. Not the abstract rate, but the future balance.
That's especially useful when calculators let you project holdings in tokens or coins rather than just fiat values. In practice, you're often asking, “How many more ETH, SOL, or LP tokens will I hold if rewards keep flowing and get reinvested?”
APY tells you the growth story. APR tells you the starting rate. In crypto, you usually need both, but APY is the one that better matches lived results when compounding is active.
A calculator becomes useful the moment you stop treating yield as a vague promise and start entering actual assumptions.

In crypto, that could mean a staking position, a yield farm, or an interest-bearing account. Binance notes that compounding shows up across staking on networks such as Ethereum, Solana, and Cardano, liquidity provision on platforms like Uniswap and PancakeSwap, and crypto savings products like Binance Earn and Nexo. The same source also points out that Compound uses smart contracts to adjust lending rates based on supply and demand inside liquidity pools, which makes compounding more dynamic than a fixed bank-style rate. Their examples show that €10,000 at 5% APY compounded daily grows to about €10,512 in one year, while €10,000 at 10% APY compounded daily grows to about €11,052 in the same period, based on the Binance discussion of crypto compounding use cases.
Most cryptocurrency compound interest calculators ask for the same inputs:
Those fields look simple, but they force a useful discipline. You stop asking, “Is this APY good?” and start asking, “What balance does this produce, over what time frame, under what assumptions?”
For a hands-on companion tool, this APY calculator for crypto helps frame those inputs clearly.
The next step is translating protocols into calculator inputs.
| Strategy type | Typical calculator input style | What to watch closely |
|---|---|---|
| ETH staking | Single asset, steadier reward stream | Lockups, validator mechanics, changing reward rate |
| Stablecoin yield farming | Higher headline yield, usually simpler token accounting | Protocol risk, reward token quality, withdrawal conditions |
| Volatile LP farming | High APY with multiple moving parts | Impermanent loss, fee income stability, exit timing |
A beginner often tries to compare these opportunities by staring only at the APY field. That's like comparing cars only by top speed. You miss fuel efficiency, maintenance cost, and how the vehicle handles on the road.
When the calculator returns a future value, break it into two layers:
That distinction matters because a calculator can be perfectly right about token accumulation and still be useless if the asset drops hard in price.
A short visual walkthrough helps if you want to see the logic in action:
Use this sequence whenever you evaluate a position:
The calculator is most valuable before you deposit funds, not after. It turns marketing language into a model you can challenge.
A basic calculator assumes the world behaves politely. In DeFi, it rarely does.
The biggest problem with many calculator outputs isn't the math. It's the assumption that the rate stays fixed, rewards stay valuable, and the path from deposit to withdrawal stays smooth. That can make a projection look cleaner than reality.
Research highlighted by CoinSwitch argues that many crypto compound interest calculators rely on fixed APY assumptions even though DeFi yields can swing hard. In that analysis, staking APYs on Ethereum protocols such as Aave or Compound Finance fluctuated from 1% to 20% in 2025, and the median APY dropped 45% after Q1 as TVL shifted from $150B to $85B under regulatory pressure. The same write-up says 70% of top-20 DeFi pools saw APY volatility above 50% annually during 2024 to 2025, and effective compounded returns were eroded by 30% to 60% when paired with 40% average BTC and ETH drawdowns. That's from CoinSwitch's discussion of the limits of fixed-rate crypto calculators.
That tells you something important. A smooth compounding curve is often a convenience, not a forecast.
Every reinvestment has friction.
Sometimes it's obvious, like gas fees on a manual claim-and-restake flow. Sometimes it's buried, like protocol fees, borrow costs, or slippage when entering and exiting a farm.
A simple way to think about it is this: compounding is like watering a plant every day. If each watering spills some water on the floor, the plant still grows, but less efficiently than your schedule suggests.
Here are the frictions most often missed:
Reality check: The highest compounding frequency isn't always the most profitable one once transaction costs enter the picture.
This is the risk that surprises liquidity providers most.
Impermanent loss happens when you provide two assets to a pool and one moves sharply relative to the other. The pool rebalances your holdings, and you can end up with fewer of the asset that appreciated more. You still earn trading fees and rewards, but those gains may not be enough to offset the shift.
Use a market-stall analogy. You bring apples and oranges to sell as a pair. If apples suddenly become far more valuable, the stall's rebalancing process leaves you holding relatively fewer apples and more oranges. You still made sales, but your inventory changed in a way that may leave you worse off than if you'd held the original mix outside the stall.
CoinSwitch's analysis goes further and notes that impermanent loss in LP positions can wipe 20% to 50% of principal despite high APYs. That's exactly why a flashy farm can look amazing in a calculator and disappointing in a wallet.
If you want a dedicated framework for this specific risk, an impermanent loss calculator is often a better companion than a plain APY tool.
Not every problem is visible in a chart.
A protocol can change emissions. A vault can route rewards differently. A smart contract can carry code risk. Even if the posted APY is real, the route to capturing it may depend on assumptions that stop holding next week.
A stronger review process includes:
| Risk area | What the calculator misses | What you should ask |
|---|---|---|
| Rate stability | Assumes yield stays constant | Is the APY incentive-driven or organic? |
| Reward quality | Treats all rewards as equal | Are rewards paid in a token you actually want to hold? |
| LP mechanics | Ignores rebalancing damage | Could volatility overwhelm fee income? |
| Execution | Often skips transaction friction | How many actions are needed to maintain compounding? |
Most calculators are good at arithmetic. They are weak at market structure.
That's why experienced DeFi users don't stop at the future value number. They ask where the yield comes from, who is paying for it, what happens if volatility spikes, and whether the reward token has real demand. Those questions matter more than the calculator interface.
Taxes can turn a strong-looking compounding plan into a mediocre one.
A lot of crypto investors still model yield as if every reward token can be reinvested in full. In practice, many jurisdictions treat staking rewards, lending rewards, or auto-compounded distributions as taxable when received. That means part of your “reinvestable” amount may already belong to the tax authority.
AQRU's overview highlights a major blind spot in many crypto calculators. It notes that some tools project earnings without deducting taxes, even though in the US staking rewards are treated as ordinary income taxed at 10% to 37% on receipt, followed by capital gains of 0% to 20% on sale. The same source says this can reduce effective APY by 25% to 50%. It also notes that EU MiCA rules, effective 2025, mandate 15% to 33% withholding on DeFi yields above €500 per year. That's detailed in AQRU's discussion of crypto interest calculations and tax blind spots.
That isn't a side issue. It changes your compounding base.
If rewards are taxed as they arrive, you may not be able to restake the full amount. Your real growth rate becomes lower than the posted APY even if the protocol performs exactly as advertised.
This catches people off guard.
If a protocol auto-compounds inside a vault, the interface may make it feel invisible. But invisible doesn't always mean non-taxable. AQRU's analysis says 60% of DeFi protocols post-2025 auto-compound while still triggering immediate taxable events, which many calculators don't model.
Posted APY tells you pre-tax growth. Your wallet balance after compliance can follow a very different curve.
Instead of treating tax as an afterthought, build it into your process:
AQRU also cites a sobering data point: 2025 IRS audits rose 300% on crypto yield farmers, with an average underreported tax liability of $15k for APY above 8% holders. It adds that incorporating progressive tax brackets and FIFO or LIFO cost basis reduced projected 10-year growth from 6x to 3.2x at 12% APY.
They stop asking only, “What does this pay?” and start asking, “What can I keep?”
That shift sounds small, but it's the difference between a hobbyist estimate and a professional one. If a yield source is attractive only before taxes, it may not deserve capital. If it still looks solid after taxes, fees, and realistic execution assumptions, then it becomes interesting.
A calculator tells you what could happen under a set of assumptions. On-chain history shows what someone managed to do.
That distinction matters when you're trying to find compounding strategies worth following. In DeFi, the cleanest projection often belongs to the weakest opportunity, because nothing in the model reflects messy execution. The more useful question is whether real wallets have managed the same setup successfully over time.
Suppose two farms both advertise attractive APY. A calculator may rank them similarly. On-chain behavior can split them apart fast.
One wallet cohort may enter, harvest, and leave with disciplined timing. Another may show poor exits, sloppy reinvestment, or exposure to reward tokens that faded quickly. Looking at realized wallet behavior helps you identify strategy quality that a calculator can't see.
That includes things like:
The right process isn't to copy a wallet blindly. It's to study how that wallet produced returns.

Use this checklist when reviewing any candidate strategy:
| What to inspect | Why it matters for compounding |
|---|---|
| Source of returns | Distinguishes organic yield from temporary incentives |
| Holding period | Shows whether the wallet compounds patiently or rotates constantly |
| Reinvestment behavior | Reveals whether gains were actually compounded or simply harvested |
| Chain and protocol mix | Helps you judge gas burden, liquidity conditions, and operational complexity |
| Drawdown tolerance | Tells you whether the strategy survives rough conditions |
A wallet that earns well in one lucky stretch isn't the same as a wallet that compounds through changing market regimes.
This process strengthens the workflow.
Start with a strategy you've identified on-chain. Then use a cryptocurrency compound interest calculator to model a simplified version of that wallet's behavior. Compare your modeled result to the wallet's realized path.
If the gap is wide, ask why.
Sometimes the wallet benefited from timing. Sometimes it paid more in execution costs than the calculator implies. Sometimes the APY looked ordinary, but the wallet avoided the worst drawdowns and ended up outperforming more aggressive participants.
Good on-chain research doesn't replace a calculator. It gives the calculator honest inputs.
You don't need perfection. You need evidence that the operator understands compounding in practice.
Look for wallets that show:
That's the practical edge. The calculator gives you the theory. On-chain data gives you the proof.
Compounding is one of the clearest wealth-building mechanics in crypto, but only when you read it correctly.
Start with the basics. Know the difference between APR and APY. Understand what the formula is doing. Use a cryptocurrency compound interest calculator to turn a headline yield into a concrete projection.
Then get stricter.
A calculator's output is the clean version of events. Real returns depend on changing yields, fees, slippage, liquidity mechanics, reward token quality, and taxes. If you're providing liquidity, impermanent loss can override an attractive APY. If you're restaking rewards in a taxable jurisdiction, your real compounding rate may be much lower than the dashboard suggests.
The final upgrade is verification. Don't judge a strategy by the protocol page alone. Check how similar strategies have played out on-chain. Study real wallet behavior, look at realized outcomes, and compare those results with your modeled expectations.
That's how you stop being impressed by numbers and start evaluating systems.
A smart DeFi investor doesn't ask only, “What does this calculator say?” The better question is, “Under realistic conditions, can this strategy still earn enough to justify the risk?”
If you want to move from theory to real strategy discovery, Wallet Finder.ai helps you inspect profitable wallets, review complete on-chain histories, and spot compounding approaches that have already been tested in live markets. Use it to validate ideas before you mirror them, not after the opportunity is gone.

A premier DeFi analytics platform empowering traders to discover and analyze profitable blockchain wallets, trades and tokens.

