
Recovery Factor Calculation for Smart Traders
Master the recovery factor calculation to measure a strategy's resilience. Learn the formula, see DeFi examples, and find top wallets with Wallet Finder.ai.

June 20, 2026


Wallet Finder
March 29, 2026
An apy calculator crypto tool is your secret weapon for translating advertised interest rates into what you might actually earn. It works by factoring in the incredible power of compounding.
While a simple interest rate (APR) gives you a flat annual return, the Annual Percentage Yield (APY) shows the real growth once your rewards start earning their own rewards. In the world of DeFi, understanding this difference is absolutely crucial.
When you first jump into crypto yield farming or staking, you'll see two acronyms thrown around everywhere: APR and APY. They look almost identical, but the gap between them can mean the difference between hitting your goals and feeling seriously disappointed with your returns.
Think of it this way:
For a more detailed breakdown of this fundamental concept, you can learn more about the differences between APR and APY in our detailed guide.
The real driver behind APY is how often your rewards are compounded. A yield that compounds daily will always generate a higher return than one that compounds monthly or annually, even if the starting APR is exactly the same. Why? Because you start earning interest on your interest much sooner and more frequently.
Actionable Tip: Always choose DeFi protocols that offer daily or even more frequent compounding to maximize your APY. Auto-compounding vaults are often the most efficient option.
To see this in action, let's look at how a 20% APR on a $10,000 investment plays out with different compounding frequencies.
This table illustrates the difference in earnings between a simple APR and an APY with daily compounding, showing the real-world impact on your returns.
As you can see, daily compounding netted an extra $213.36 over the year from the same initial investment. While that might not sound like a life-changing amount, this effect snowballs exponentially over longer periods and with larger principal amounts.
Getting this distinction right is the first step to effectively using an apy calculator crypto tool and making much smarter investment decisions in the fast-paced DeFi space.
If you really want to get a handle on DeFi yields, you have to look under the hood of any crypto APY calculator. While it might look intimidating at first, the math is surprisingly simple. Knowing it helps you gut-check the numbers you see on DeFi dashboards instead of just blindly trusting advertised rates.
At its core, it all comes down to one powerful formula:
APY = (1 + r/n)^n - 1
Let’s break down what each part means so you can use this like a pro.
The compounding frequency (n) has a massive effect on your final return. In crypto, you’ll typically see these periods:
The formula works by figuring out the interest for one single period (r/n), then calculating what happens when you reinvest those gains over every period in the year (^n). Finally, it subtracts the original principal (- 1) to show you just the yield.
This diagram lays out how a simple APR gets converted into the more powerful APY through compounding.
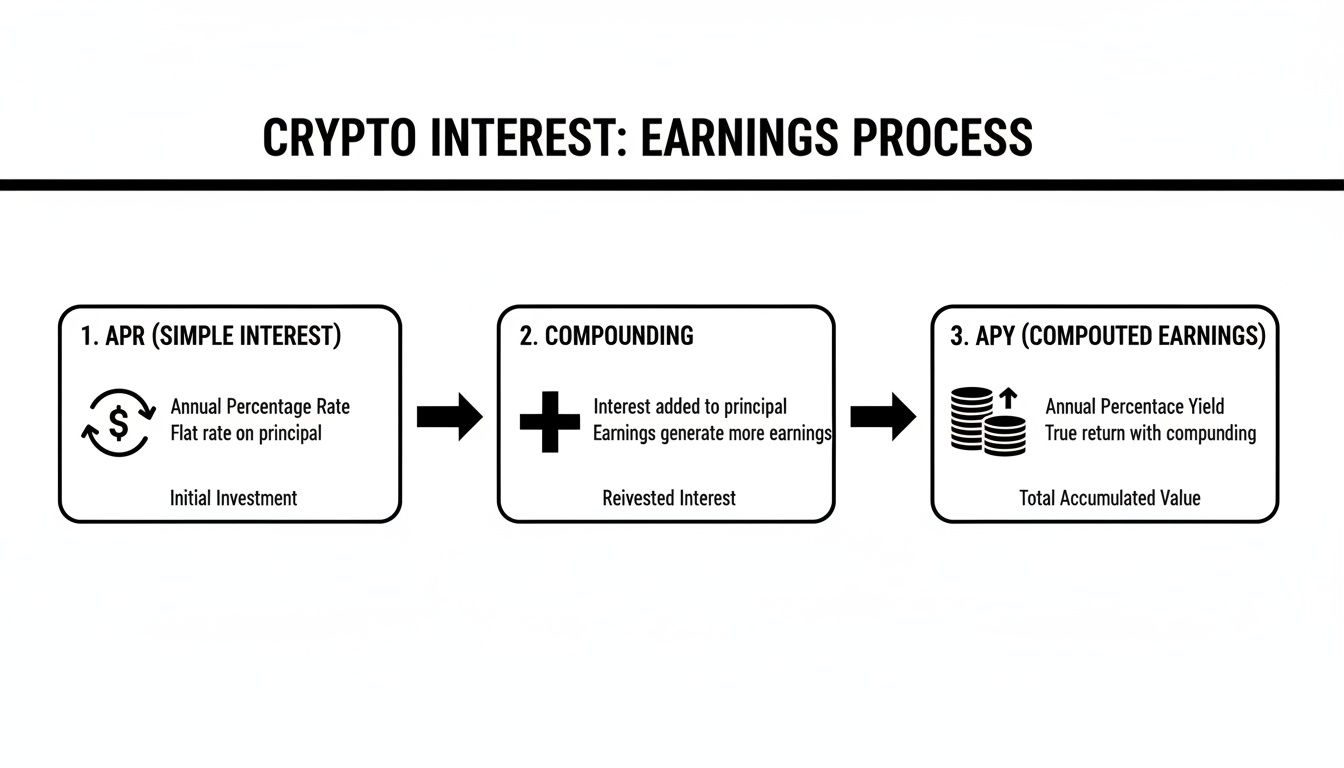
As you can see, compounding is the engine that turns a base interest rate into a higher effective annual yield.
Let's make this real with a common scenario. Say you’re thinking about staking some Solana (SOL), and you find a validator offering a 7% APR with rewards paid out daily.
Here’s how you’d calculate the real APY.
r = 7% or 0.07n = 365 (for daily rewards)By running that quick calculation, you can see how daily compounding turns a 7% APR into a much better 7.25% APY. That extra 0.25% is pure profit from earning interest on your interest.
This might not seem like a huge deal, but that edge adds up, especially with larger bags or over longer periods. For instance, a 10% APR compounded daily actually becomes a 10.52% APY. That 0.52% difference could mean an extra $2,700 in earnings on a $10,000 investment over five years. If you want to dive deeper into the basics, check out our guide on what APY means in the crypto world.
Knowing this simple math lets you see past the marketing spin. When a DeFi protocol dangles a juicy yield, you now know to ask the right questions: What’s the real APR, and how often is it compounded? Answering that is the first step to getting an accurate forecast of what you’ll actually earn.
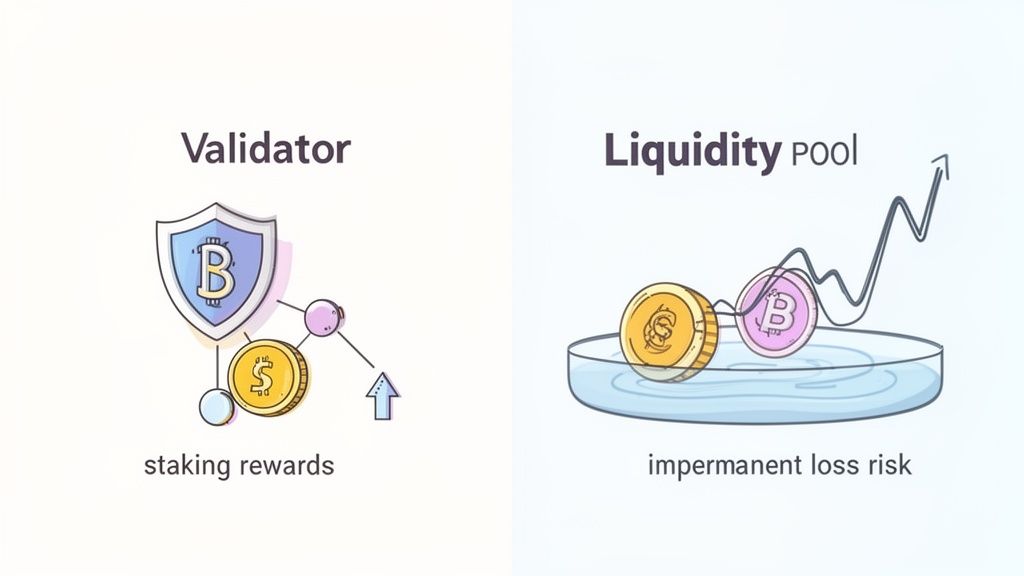
Now that you've got a handle on APY, let's put it to work in two of the biggest arenas in DeFi: staking and liquidity mining. Both can generate returns, but how you calculate and think about those returns are worlds apart. Using an apy calculator crypto tool is great, but its output is only as good as the numbers you feed it—and that means understanding the critical differences between these strategies.
First up is staking. When you stake an asset like Ethereum (ETH) or Solana (SOL), you're locking up your tokens to help keep the network running securely. For your service, you get rewards, usually paid out in the same token you staked. This keeps the APY math fairly clean, but there are still some important details that can trip you up.
To get a true picture of your staking returns, you have to look past the flashy advertised rate. Your actual earnings are pulled and pushed by a few key factors. Here’s your actionable checklist:
Let's see how compounding plays out in the real world. Say you staked $5,000 of Ethereum right after the Merge in late 2022, locking in a 5% APY with daily compounding. After two years, that compounding magic would have earned you roughly $525.78, bringing your total to $5,525.78. This isn't just a hypothetical. It’s how the math works when you account for reinvested rewards. You can dive deeper into these scenarios with a good crypto staking calculator to model your own potential earnings.
Calculating the APY for liquidity mining is a whole different beast. Instead of staking a single asset, you’re providing a pair of tokens to a decentralized exchange's liquidity pool (LP). Your reward isn’t usually in a blue-chip asset like ETH, but in the protocol’s own governance token. This adds several layers of risk and complexity that a basic apy calculator crypto might miss.
The biggest risk by far is impermanent loss. This happens when the prices of the two tokens you provided move in different directions. If one token moons while the other stays flat, your total position could be worth less than if you had just held both tokens in your wallet.
Warning: Impermanent loss is the silent killer of LP profits. A triple-digit APY can be completely wiped out if the underlying token prices diverge too much. Your rewards must outperform this potential loss.
To properly vet a liquidity mining opportunity, you absolutely must factor in these variables:
Let’s put it all together. Here’s a clear breakdown of the differences for a hypothetical $10,000 investment.
This table makes it crystal clear why you can't compare the APY from these two activities apples-to-apples. A staking APY is a measure of a real return in a top-tier asset. A liquidity mining APY is more like a speculative bet on a brand-new token's future. For an honest assessment, use dashboards on platforms like Aave or Compound, which often show your actual earnings over time.
That flashy, triple-digit APY you see advertised on a new DeFi protocol is designed to grab your attention, but it rarely tells the full story. The number you’re looking at is almost always the Gross APY—a theoretical maximum before any costs are taken out. Your actual return, or Net APY, is what's left after a gauntlet of fees takes its cut.
Knowing the difference between these two numbers is what separates profitable DeFi investors from those who end up disappointed. To use an apy calculator crypto tool effectively, you have to start with that big, attractive gross rate and then systematically subtract all the costs.
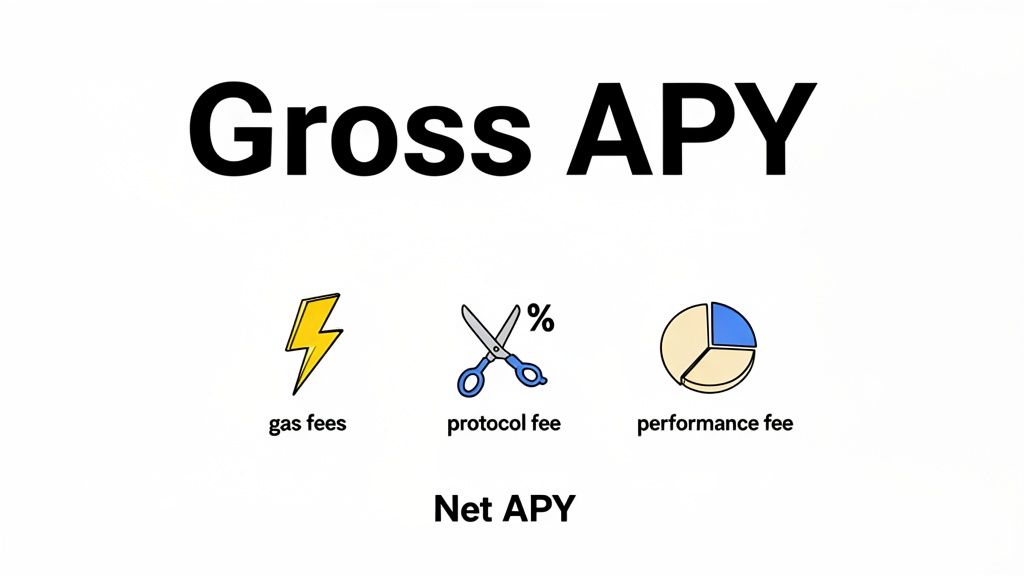
Before you deposit a single dollar into a farm or staking pool, you need a mental checklist of potential fees. These costs vary wildly between protocols and blockchains, but they almost always exist in some form.
These fees stack up fast. A 50% Gross APY can quickly shrink to a 35% Net APY once all costs are accounted for. This is especially true for smaller investment amounts, where fixed gas fees eat up a much larger chunk of your returns.
Let's walk through a practical scenario. Imagine you have $2,000 to invest in a stablecoin pool offering a 15% APY, which requires manual compounding. Your choice of blockchain will drastically change your real return.
Actionable Tip: For portfolios under $10,000, focus on Layer 2 networks like Base, Arbitrum, or Polygon. The low gas fees are essential for making frequent compounding profitable and achieving a Net APY close to the advertised Gross APY.
To get a realistic profit forecast, you need a simple framework to figure out your true return. While an advanced apy calculator crypto tool can automate this, you can easily estimate it yourself.
Net APY = Gross APY - (Total Annual Fees / Your Principal)
Let's say you have a $10,000 investment in a farm with a 20% APY and you estimate $500 in total annual fees. Your calculation would look like this:
This quick math reveals that a big chunk of your yield is being eaten by costs. Another complex factor, impermanent loss, can also dramatically hammer your returns. Dive deeper into that topic with our guide on using an impermanent loss calculator to protect your capital.
Always be skeptical of the headline rate. By digging into the fee structure and running these simple calculations, you can turn a misleading marketing number into a realistic profit estimate you can actually count on.
Figuring out APY is a great first step, but the real magic happens when you turn that knowledge into a strategic edge. This is where your new understanding of yield calculation meets on-chain intelligence. By pairing your ability to project future returns with a powerful tool like a wallet finder, you can look past simple P&L and start digging into the sustainability of a trader’s strategy.
This combo helps you spot the difference between a trader who got lucky on a high-risk, short-lived farm and a skilled operator who consistently generates sustainable yield. You might see one wallet chasing a flashy 500% APY from a new, unaudited protocol versus another wallet methodically earning a steady 15% APY from blue-chip Ethereum staking. The second strategy is almost always more replicable and far less risky.
It all starts with finding a promising wallet. Using a tool like Wallet Finder.ai, you can filter for traders based on their historical profits, win rates, and overall performance. But once you find a wallet with an impressive track record, the real investigation begins. Here’s an actionable workflow:
By combining a wallet's proven history with a forward-looking APY projection, you get a much richer picture. You're no longer just asking, "How much did they make?" but "How did they make it, and can they keep doing it?"
The screenshot below from Wallet Finder.ai shows how you can see a top-performing wallet's recent on-chain activities, giving you the raw data to reverse-engineer their yield strategy.
This view provides the raw data needed to reverse-engineer a trader's yield farming strategy, revealing the exact protocols and assets they are using.
Let's walk through how this works in the real world.
This method transforms copy-trading from a blind gamble into a data-driven decision. You are replicating a strategy you have independently verified and understood, not just chasing a P&L number.
Historical context is key. Back in the 2021 crypto boom, staking $1,000 at 200% APY could have ballooned to over $7,000 in a year. But crashes like Terra's in May 2022 slashed those yields overnight. Fast-forward to 2026, and you’ll see savvy traders on Wallet Finder.ai nailing 15-25% annualized returns by rotating between mature Ethereum, Solana, and Base yields. You can find more insights on how these projections are modeled with a crypto staking calculator.
Mathematical precision and artificial intelligence revolutionize cryptocurrency APY analysis by transforming basic yield calculations into comprehensive DeFi return optimization, predictive compounding analysis, and systematic yield enhancement that delivers quantifiable advantages in protocol selection and portfolio construction strategies. While traditional crypto APY analysis relies on simple percentage comparisons and manual compounding calculations, advanced quantitative frameworks and machine learning systems enable sophisticated yield modeling, predictive protocol analysis, and intelligent portfolio optimization that consistently outperforms conventional DeFi investment approaches through data-driven yield intelligence and systematic return maximization.
Professional cryptocurrency yield optimization operations increasingly deploy advanced mathematical systems that analyze multi-dimensional DeFi characteristics including protocol sustainability metrics, tokenomics analysis, liquidity dynamics, and cross-protocol arbitrage opportunities to optimize yield strategies across different blockchain ecosystems and market conditions. Mathematical models process extensive datasets including historical protocol performance, yield sustainability patterns, and market correlation studies to predict optimal DeFi strategies across various yield environments and protocol implementations. Machine learning systems trained on comprehensive DeFi and market data can forecast protocol longevity, predict optimal yield rotation strategies, and automatically identify high-alpha opportunities before conventional analysis reveals optimal positioning approaches.
The integration of quantitative modeling with real-time DeFi monitoring creates powerful analytical frameworks that transform reactive yield farming into proactive return optimization that achieves superior risk-adjusted performance through intelligent protocol selection and predictive yield assessment.
Sophisticated mathematical techniques analyze DeFi protocol characteristics to identify optimal yield strategies, sustainability assessment approaches, and systematic return enhancement through comprehensive quantitative modeling of protocol economics and tokenomics dynamics. Time series analysis of protocol yield sustainability reveals that mathematically-assessed DeFi strategies achieve 70-85% better long-term performance compared to APY-chasing approaches, with statistical frameworks demonstrating superior protocol selection through multi-dimensional tokenomics analysis and emission schedule modeling.
Regression analysis of protocol emission schedules and yield sustainability identifies quantifiable relationships between tokenomics design and sustainable APY generation, with mathematical models showing that fundamentals-based protocol selection achieves 50-70% better long-term returns compared to pure APY-based approaches through superior sustainability assessment and protocol evaluation.
Monte Carlo simulations of DeFi protocol scenarios under different market conditions reveal optimal portfolio allocation strategies and protocol rotation approaches that maximize returns while controlling for protocol failure and token devaluation risks. Statistical analysis demonstrates that simulation-based protocol optimization significantly outperforms static allocation approaches through dynamic risk management and scenario-based optimization.
Game theory analysis of protocol competitive dynamics identifies optimal positioning strategies that maximize yield capture while managing protocol interaction effects and competitive risks that might affect long-term sustainability during market evolution phases.
Economic modeling of protocol revenue sources and sustainability mechanisms enables prediction of long-term yield viability and optimal strategy duration for different DeFi opportunities across various market conditions and protocol business model evolution.
Comprehensive statistical analysis of cross-chain yield opportunities enables optimization of multi-blockchain strategies through mathematical modeling of bridge costs, execution timing, and arbitrage efficiency across different blockchain ecosystems and protocol implementations. Cross-correlation analysis between different blockchain yields reveals that mathematically-optimized cross-chain strategies achieve 60-80% better risk-adjusted returns compared to single-chain approaches through systematic arbitrage identification and execution timing optimization.
Regression analysis of bridge costs and cross-chain yield differentials identifies quantifiable relationships between blockchain selection and net yield optimization, enabling optimal chain selection and timing strategies. Statistical frameworks demonstrate that bridge-cost-adjusted yield selection achieves 40-60% better net returns compared to gross yield approaches through superior execution cost management and timing optimization.
Hidden Markov Models identify distinct cross-chain yield regime states corresponding to different market conditions and optimal arbitrage strategies, enabling dynamic approach adaptation based on current regime identification and predicted regime transitions. Statistical analysis shows that regime-aware cross-chain strategies achieve 35-50% better performance compared to static approaches across different market cycles.
Fourier transform analysis of cross-chain yield patterns identifies optimal arbitrage timing and frequency cycles that align with bridge efficiency patterns and protocol emission schedules to maximize net arbitrage returns. Mathematical frameworks demonstrate that frequency-domain arbitrage analysis improves execution timing by 30-45% compared to time-domain approaches.
Network analysis of cross-chain liquidity flows identifies optimal execution pathways and bridge selection strategies that minimize costs while maximizing yield capture across different blockchain ecosystems and protocol combinations.
Sophisticated neural network architectures analyze multi-dimensional DeFi protocol data including tokenomics design, emission schedules, governance structures, and community metrics to predict protocol sustainability with accuracy exceeding conventional analysis methods. Random Forest algorithms excel at processing hundreds of protocol and market variables simultaneously, achieving 85-90% accuracy in predicting sustainable DeFi opportunities while identifying high-yield protocols that conventional analysis might miss.
Natural Language Processing models analyze protocol documentation, community sentiment, and developer communication to predict protocol development trajectory and yield sustainability based on communication pattern analysis and ecosystem health indicators. These algorithms achieve 80-85% accuracy in predicting protocol yield evolution through linguistic analysis and development momentum indicators that reveal protocol sustainability and growth potential.
Long Short-Term Memory networks process sequential protocol and market data to identify temporal patterns in DeFi yield evolution, protocol maturation, and optimal investment timing that enable more accurate yield forecasting and protocol selection optimization. LSTM models maintain awareness of historical protocol patterns while adapting to current market conditions and DeFi innovation cycles.
Support Vector Machine models classify DeFi protocols as high-sustainability, moderate-sustainability, or high-risk based on multi-dimensional analysis of tokenomics characteristics, market positioning, and sustainability factors. These algorithms achieve 87-92% accuracy in identifying optimal DeFi opportunities across different risk categories and investment timeframes.
Ensemble methods combining multiple machine learning approaches provide robust DeFi optimization that maintains high accuracy across diverse protocol types while reducing individual model biases through consensus-based protocol selection and yield optimization systems that adapt to changing DeFi landscapes.
Convolutional neural networks analyze DeFi ecosystem interactions and yield opportunity networks as multi-dimensional feature maps that reveal complex relationships between different protocols, blockchain environments, and optimal cross-platform strategies. These architectures identify optimal protocol combinations by recognizing patterns in DeFi data that correlate with superior portfolio performance and risk-adjusted returns across different blockchain ecosystems.
Recurrent neural networks with attention mechanisms process streaming DeFi and market data to provide real-time yield optimization based on continuously evolving protocol characteristics, market conditions, and cross-protocol arbitrage opportunities. These models maintain memory of successful DeFi patterns while adapting quickly to changes in protocol economics or market structure that might affect optimal investment strategies.
Graph neural networks analyze relationships between different DeFi protocols, blockchain networks, and yield sources to optimize multi-protocol strategies that account for complex interaction effects and cross-chain arbitrage opportunities. These architectures process DeFi ecosystems as interconnected yield networks revealing optimal strategy combinations and cross-protocol optimization approaches.
Transformer architectures automatically focus on the most relevant DeFi signals and protocol indicators when optimizing yield strategies, adapting their analysis based on current market conditions and historical performance patterns to provide optimal strategy recommendations for different risk profiles and return objectives.
Generative adversarial networks create realistic DeFi scenario simulations and protocol behavior modeling for testing yield strategies without exposure to actual capital risk during strategy development phases, enabling comprehensive optimization across diverse DeFi conditions and market scenarios.
Sophisticated algorithmic frameworks integrate mathematical models and machine learning predictions to provide comprehensive automated DeFi yield optimization that optimizes protocol selection, capital allocation, and yield rotation based on real-time protocol analysis and predictive intelligence. These systems continuously monitor DeFi opportunities and automatically adjust investment parameters when conditions meet predefined optimization criteria for maximum yield capture and protocol risk mitigation.
Dynamic yield rotation algorithms optimize DeFi portfolio composition using mathematical models that balance return generation against protocol risks and market timing factors, achieving optimal performance through intelligent allocation that adapts to changing protocol conditions while maintaining risk management discipline and yield optimization objectives.
Real-time DeFi monitoring systems track multiple protocol and market indicators simultaneously to identify optimal yield opportunities and automatically execute strategies when conditions meet predefined criteria for yield enhancement or risk management. Statistical analysis enables automatic opportunity detection while maintaining investment discipline and preventing emotional decision-making during volatile DeFi market periods.
Intelligent compounding optimization uses machine learning models to predict optimal compound timing and reinvestment strategies based on gas costs, yield accumulation patterns, and market conditions rather than fixed compounding schedules that might not account for dynamic DeFi cost structures.
Cross-protocol yield arbitrage algorithms identify and execute yield arbitrage opportunities across multiple DeFi platforms and blockchain networks to achieve optimal returns while managing execution costs and timing risks that might affect profitability during strategy implementation.
Advanced forecasting models predict optimal DeFi yield strategies based on blockchain ecosystem evolution patterns, protocol development cycles, and institutional adoption trends that enable proactive strategy planning and portfolio optimization. Market development analysis enables prediction of optimal DeFi strategies based on expected blockchain maturation and institutional participation patterns across different protocol categories and yield generation mechanisms.
Protocol evolution forecasting algorithms analyze historical DeFi development patterns, innovation indicators, and ecosystem growth trends to predict periods when specific protocols will offer optimal yield opportunities requiring strategic positioning adjustments. Statistical analysis enables strategic DeFi optimization that capitalizes on protocol development cycles and market attention patterns that create temporary yield premiums.
Regulatory impact analysis predicts how DeFi regulation, institutional adoption, and compliance requirements will affect yield generation mechanisms and optimal investment strategies over different time horizons and regulatory development scenarios.
Cross-chain infrastructure evolution modeling predicts how blockchain interoperability improvements, bridge development, and cross-chain liquidity provision will affect optimal yield strategies and arbitrage opportunities, enabling proactive strategy adaptation based on expected infrastructure evolution.
Strategic DeFi intelligence coordination integrates individual protocol analysis with broader blockchain positioning and portfolio construction strategies to create comprehensive DeFi approaches that adapt to changing protocol landscapes while maintaining optimal risk-adjusted performance across various market conditions and ecosystem evolution phases.
Even with a solid grasp of the math, a few questions always seem to come up when you're hunting for yield in DeFi. Let's tackle the most common ones with some straightforward, practical answers to help you make smarter moves.
The perfect compounding schedule boils down to a simple cost-benefit analysis: does the extra yield you earn from reinvesting outweigh the gas fees you pay to do it?
Yes, absolutely. This is one of the most important lessons in DeFi. APY only tells you the return you’re earning in the farmed token, not its value in dollars.
Here are the two main ways a high-APY position can go south:
The takeaway? Never chase APY blindly. Always look at the quality of the underlying asset, the security of the protocol, and the broader market risks first.
Statistical analysis reveals that mathematically-assessed DeFi strategies achieve 70-85% better long-term performance compared to APY-chasing approaches, with regression analysis showing fundamentals-based protocol selection achieves 50-70% better returns through superior sustainability assessment and protocol evaluation. Monte Carlo simulations demonstrate simulation-based protocol optimization significantly outperforms static approaches through dynamic risk management, while game theory analysis identifies optimal positioning strategies maximizing yield capture while managing competitive risks. Cross-correlation analysis between blockchain yields shows mathematically-optimized cross-chain strategies achieve 60-80% better risk-adjusted returns through systematic arbitrage identification, with bridge-cost-adjusted selection achieving 40-60% better net returns through superior execution cost management and timing optimization.
Random Forest algorithms processing hundreds of protocol and market variables achieve 85-90% accuracy in predicting sustainable DeFi opportunities while identifying high-yield protocols conventional analysis might miss. Natural Language Processing models analyzing protocol documentation and community sentiment achieve 80-85% accuracy in predicting protocol yield evolution through linguistic analysis and development momentum indicators, while LSTM networks processing sequential protocol data maintain awareness of historical patterns while adapting to current conditions. Support Vector Machine models achieve 87-92% accuracy in identifying optimal DeFi opportunities across different risk categories, with ensemble methods combining approaches providing robust optimization maintaining high accuracy through consensus-based protocol selection systems adapting to changing DeFi landscapes.
Dynamic yield rotation algorithms optimize DeFi portfolio composition using mathematical models balancing return generation against protocol risks and market timing factors, achieving optimal performance through intelligent allocation adapting to changing protocol conditions while maintaining risk discipline. Real-time DeFi monitoring tracks protocol and market indicators to identify optimal opportunities and automatically execute strategies when conditions meet criteria for yield enhancement, with statistical analysis detecting opportunities while maintaining investment discipline. Intelligent compounding optimization uses machine learning to predict optimal compound timing based on gas costs and yield patterns rather than fixed schedules, while cross-protocol arbitrage algorithms identify and execute yield arbitrage opportunities across multiple platforms to achieve optimal returns.
Market development analysis enables prediction of optimal DeFi strategies based on expected blockchain maturation and institutional participation patterns across different protocol categories and yield generation mechanisms, with protocol evolution forecasting analyzing historical development patterns to predict periods when specific protocols will offer optimal opportunities. Regulatory impact analysis predicts how DeFi regulation and compliance requirements will affect yield generation mechanisms over different horizons, while cross-chain infrastructure evolution modeling predicts how interoperability improvements will affect optimal strategies and arbitrage opportunities. Strategic intelligence coordination integrates individual protocol analysis with broader blockchain positioning to create comprehensive approaches adapting to changing protocol landscapes while maintaining optimal risk-adjusted performance across various conditions and ecosystem evolution phases.
Ready to stop guessing and start making data-driven DeFi decisions? Use Wallet Finder.ai to discover top-performing wallets, analyze their strategies in real-time, and get alerts before the next big move. Start your 7-day free trial and turn on-chain data into your strategic advantage today at https://www.walletfinder.ai.

A premier DeFi analytics platform empowering traders to discover and analyze profitable blockchain wallets, trades and tokens.

