
Recovery Factor Calculation for Smart Traders
Master the recovery factor calculation to measure a strategy's resilience. Learn the formula, see DeFi examples, and find top wallets with Wallet Finder.ai.

June 20, 2026


Wallet Finder
June 18, 2026
You find a wallet with spectacular PnL, a clean trade log, and a chart that slopes up hard enough to trigger instant FOMO. The instinct is obvious. Copy the wallet, mirror the entries, and hope the edge transfers.
That's where most copy trading research goes wrong.
PnL tells you what happened at the end. Drawdown analysis tells you what it cost to get there. In DeFi, that distinction matters more than it does in most traditional portfolios because wallet histories often include violent reversals, concentration in illiquid tokens, and periods where a trader was one bad unwind away from permanent damage. If you only study the upside, you'll mistake survival for skill and capital amplification for genius.
A wallet that compounds through manageable pullbacks is a different animal from a wallet that survives repeated near-death experiences. Both can post big gains. Only one is usually copyable.
A sharp on-chain trader usually starts the same way. You scan wallets, sort by returns, and click the ones with the biggest curve. One wallet looks unstoppable. It caught the right meme rotation, nailed a few swing entries, and turned a modest base into something eye-catching. Then you inspect the path and realize the story is uglier than the headline.

A wallet can show huge realized gains while hiding brutal underwater periods. It may have sat on collapsing positions, doubled down into weakness, or relied on a few outsized rebounds to erase earlier damage. If you only read the top-line return, you're judging a strategy by the summit and ignoring the ravines.
That's why professionals put drawdown analysis next to return analysis, not below it. Return answers, “How much did this strategy make?” Drawdown answers, “How much pain, fragility, and capital impairment did it take to make it?”
If you already review profit and loss analysis for wallets, drawdown is the missing half of the picture. PnL shows output. Drawdown shows resilience.
Practical rule: If a wallet's gain profile excites you more than its loss profile reassures you, you probably haven't researched it deeply enough.
In DeFi, this matters because wallet behavior is visible. You can inspect entries, exits, token concentration, and holding periods. That gives you a rare edge. Most traders still waste it by stopping at leaderboard returns.
A good wallet doesn't just make money. It survives bad conditions in a way that another trader can realistically follow.
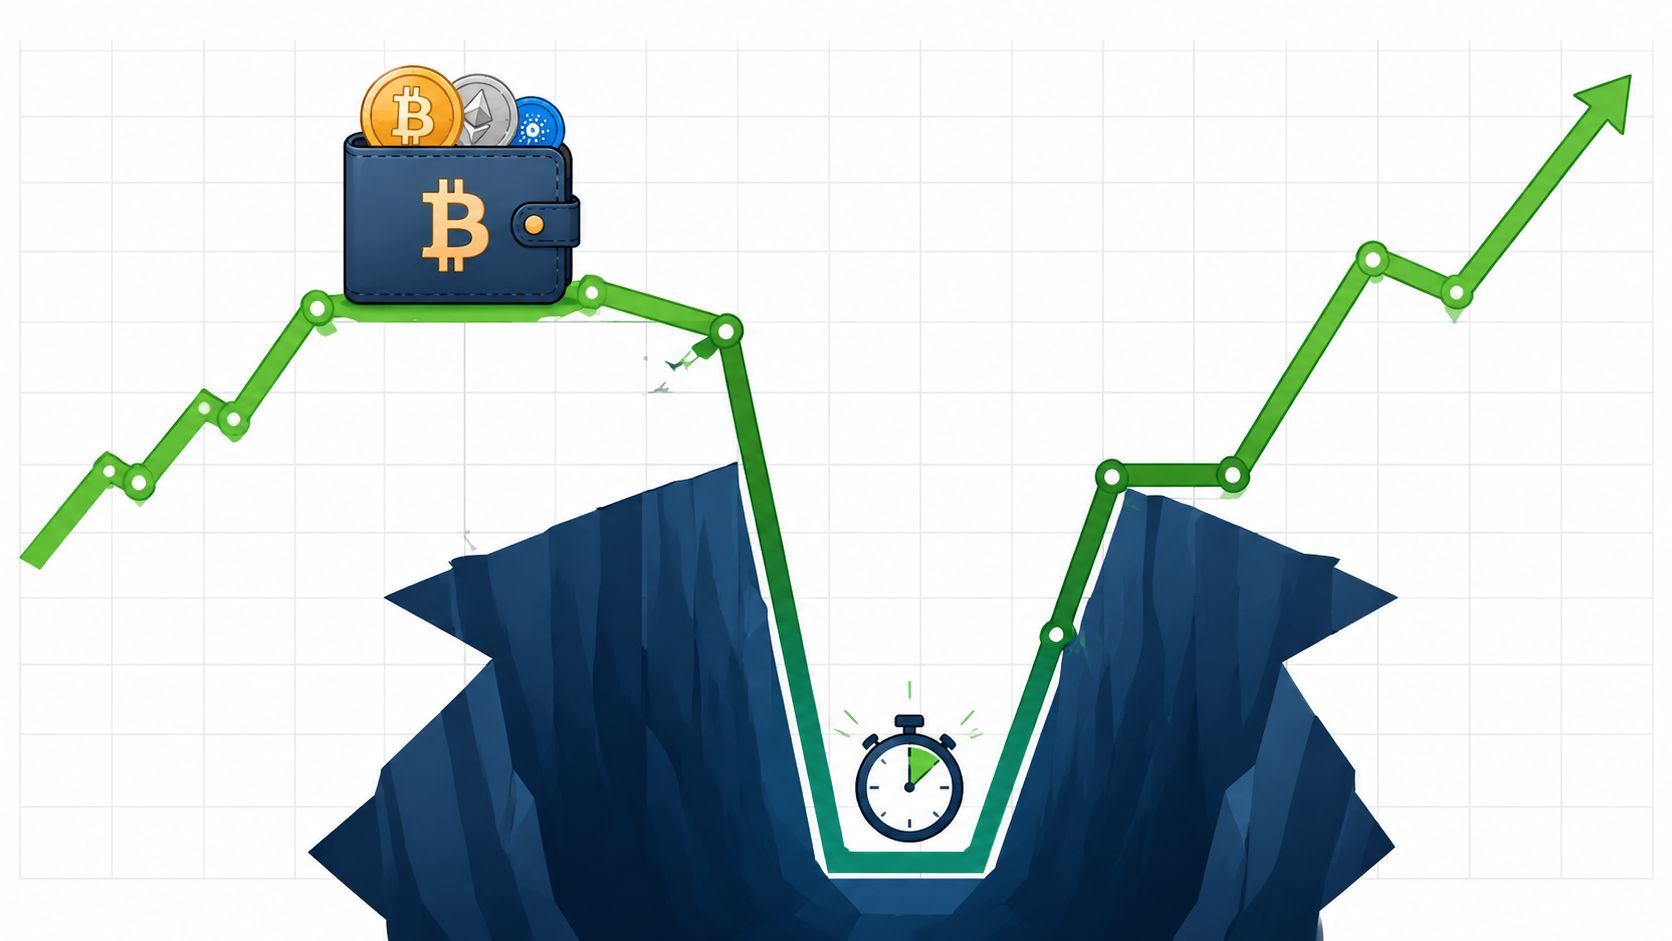
A wallet's drawdown profile starts with its equity curve, or more practically for DeFi, a time series of wallet value built from balances, transfers, and marked positions. Every metric in this section comes from one question: after a wallet hits a high, how far does it fall, and how long does it stay below that high?
Take a wallet that runs from $100,000 to $180,000 during a meme coin rotation, then slides to $126,000 before stabilizing. The peak is $180,000. The trough is $126,000. The drawdown is the percentage loss between those two points.
That sounds simple because the formula is simple. The hard part on-chain is defining wallet value correctly. A wallet can look flat on realized PnL while its marked holdings are already deep underwater. It can also look healthier than it is if illiquid tokens are still priced at stale marks.
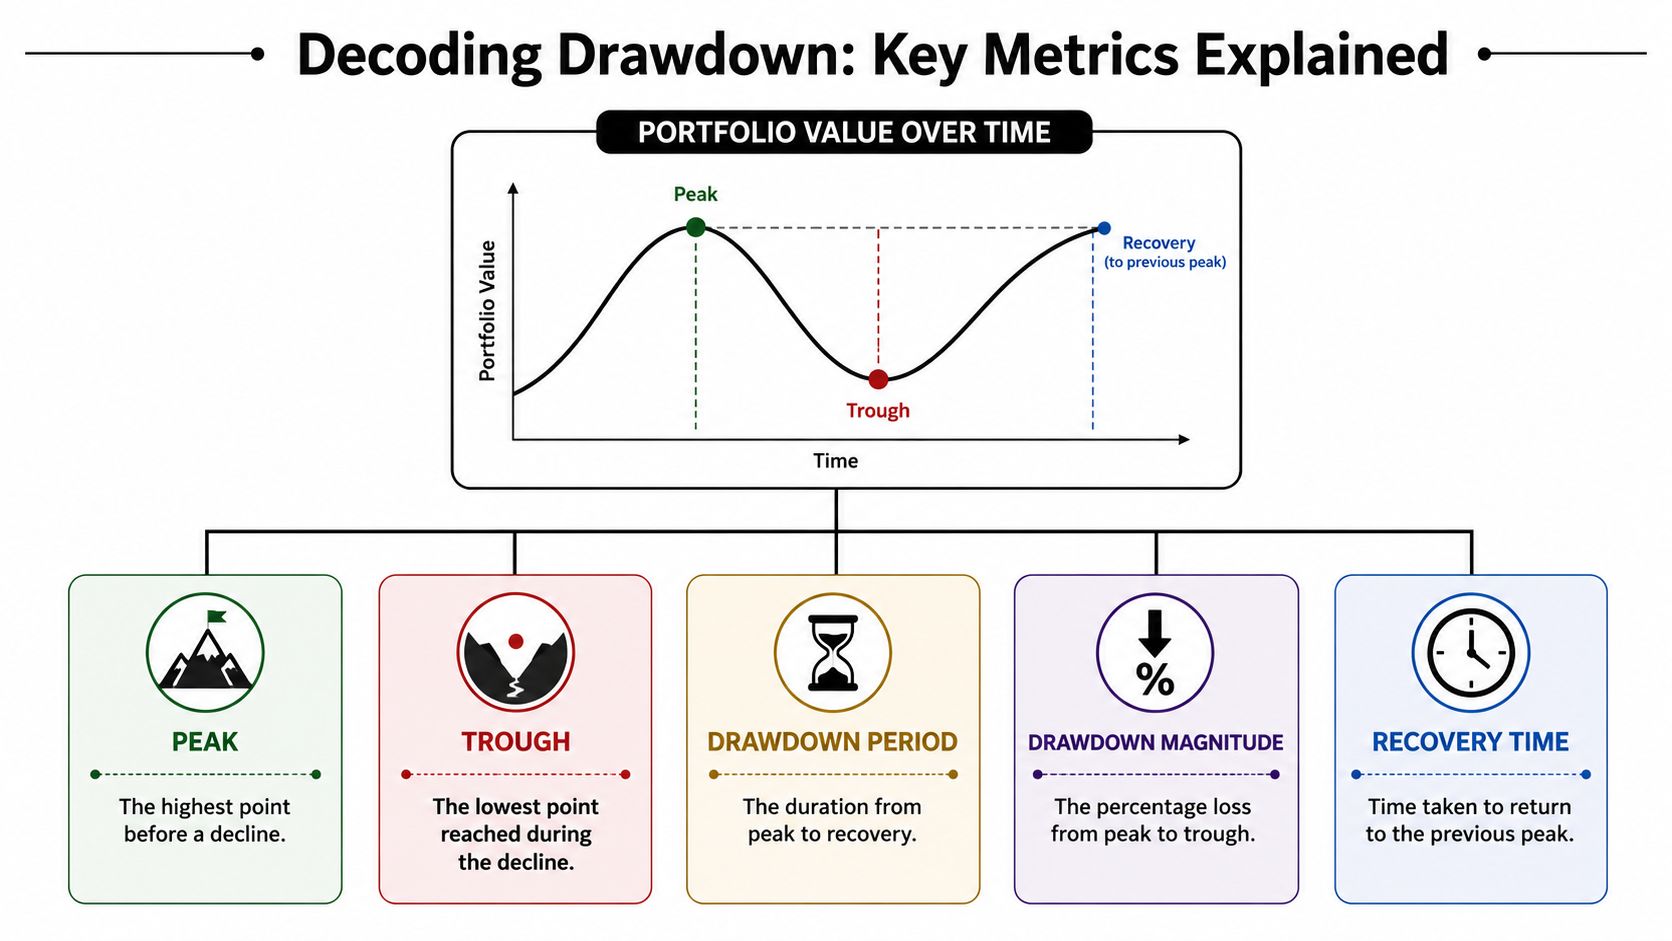
| Metric | What It Measures | The Question It Answers |
|---|---|---|
| Peak | Highest wallet value before a decline | Where did the loss episode start? |
| Trough | Lowest wallet value reached after that peak | How bad did the decline get before any recovery? |
| Drawdown | Percentage drop from peak to trough | How much capital was impaired from the prior high? |
| Maximum Drawdown | Largest peak-to-trough decline across the full history | What was the worst historical stress event? |
| Recovery Time | Time required to reclaim the prior peak | How long was capital tied up below water? |
These metrics are basic, but they carry more signal than many DeFi traders expect. Wallet history lets you inspect the exact sequence behind the number. You can see whether the drawdown came from one concentrated bet, a series of correlated longs, repeated mean-reversion entries, or refusal to exit.
Maximum drawdown, or MDD, gets most of the attention because it compresses the worst pain in the track record into one number. That is useful for screening wallets quickly. If a wallet has already suffered a catastrophic decline, copy-trading it or allocating capital to a similar style deserves extra skepticism.
But MDD has blind spots.
A wallet with one violent drawdown and a fast rebound can be easier to follow than a wallet that spends months in smaller but constant declines. In practice, I care about three things together: depth, duration, and frequency. Depth tells you the damage. Duration tells you how long capital was trapped. Frequency tells you whether the process keeps revisiting the same mistake.
A shallow drawdown that clears quickly is often more survivable than a prettier equity curve with repeated long underwater periods.
This is the distinction many TradFi explanations skip when applied to wallets.
Absolute drawdown measures loss from the wallet's own high-water mark. Use it when the question is capital preservation. If a wallet falls 35% from peak, that is real pain regardless of what the market did.
Benchmark-relative drawdown asks a different question. Did the wallet lose ground versus the exposure you could have held more easily? A wallet can be flat or even up in dollar terms while still lagging ETH, SOL, or a sector basket badly. For DeFi research, this matters when a trader claims skill but most of the return came from beta. If you want to set that comparison up properly, this guide to benchmark performance for trading strategies gives the right framework.
For wallet tracking, benchmark-relative drawdown is often the better alpha filter. A trader who survives well in bad tape but still bleeds against the benchmark may be taking a lot of activity risk without adding much edge.
Classical finance treats drawdown as a portfolio statistic. On-chain, it is also a behavior record.
A short, sharp drawdown often points to concentrated exposure or event risk. A slow drawdown usually shows drift, overtrading, or refusal to cut weak positions. Long recovery times often map to illiquid tokens, farming positions that cannot be exited cleanly, or conviction that turned into bag-holding.
That is why wallet history matters so much here. The metric tells you what happened. The transaction trail shows why it happened.
You don't need institutional tooling to compute drawdowns. You need a clean time series of wallet value and a consistent method.
For on-chain wallets, that usually means reconstructing value over time from token balances, realized trades, and mark-to-market pricing. The hard part isn't the formula. It's building a trustworthy equity curve.
Start by exporting wallet activity from a block explorer or analytics tool. Then create a time series, daily is usually enough, of total wallet value. Include liquid balances and any marked positions you want counted. Exclude assets you can't price reliably unless you're prepared to handle stale marks.
Once you have the series, the drawdown formula is straightforward:
Drawdown = (Trough Value - Peak Value) / Peak Value
That gives you the decline from the last high-water mark. To calculate it across the whole history:
Spreadsheet math is easy. Wallet data hygiene isn't.
If the equity curve is wrong, every drawdown metric built on top of it is wrong too.
A portfolio analytics platform can save time by reconstructing history and plotting the equity curve automatically. That's useful when you're screening many wallets and need consistency more than spreadsheet craftsmanship.
For technical users, a small script is enough. The logic is simple: keep a rolling maximum, compare each value to that max, and store the worst decline.
Here's the walkthrough before you automate further:
And here's a concise Python example:
def max_drawdown(values):if not values:return Nonepeak = values[0]mdd = 0.0for v in values:peak = max(peak, v)dd = (v - peak) / peakmdd = min(mdd, dd)return mddwallet_values = [100, 120, 115, 90, 95, 130, 110]print(max_drawdown(wallet_values)) # returns the worst drawdown as a negative decimalFor more advanced work, keep separate curves for absolute performance and benchmark-relative performance. That matters because, as noted earlier, drawdown should be measured on the exact equity curve tied to the decision you're making. If you're evaluating a copy trade, absolute capital drawdown is usually the first filter. If you're evaluating whether a wallet adds edge versus a baseline, active drawdown matters too.
A 40% drawdown can describe two very different wallets. One got hit once during a market-wide liquidation and climbed back in an orderly way. The other hit minus 40% three separate times because the trader kept running concentrated positions without respecting exits. Same headline number. Very different risk.
That is why drawdown interpretation matters more on-chain than it does in many TradFi writeups. With wallet history, you can often inspect the path directly. You can see whether losses came from one oversized bet, a cluster of correlated token exposures, failed rotation timing, or a refusal to cut risk after conditions changed.
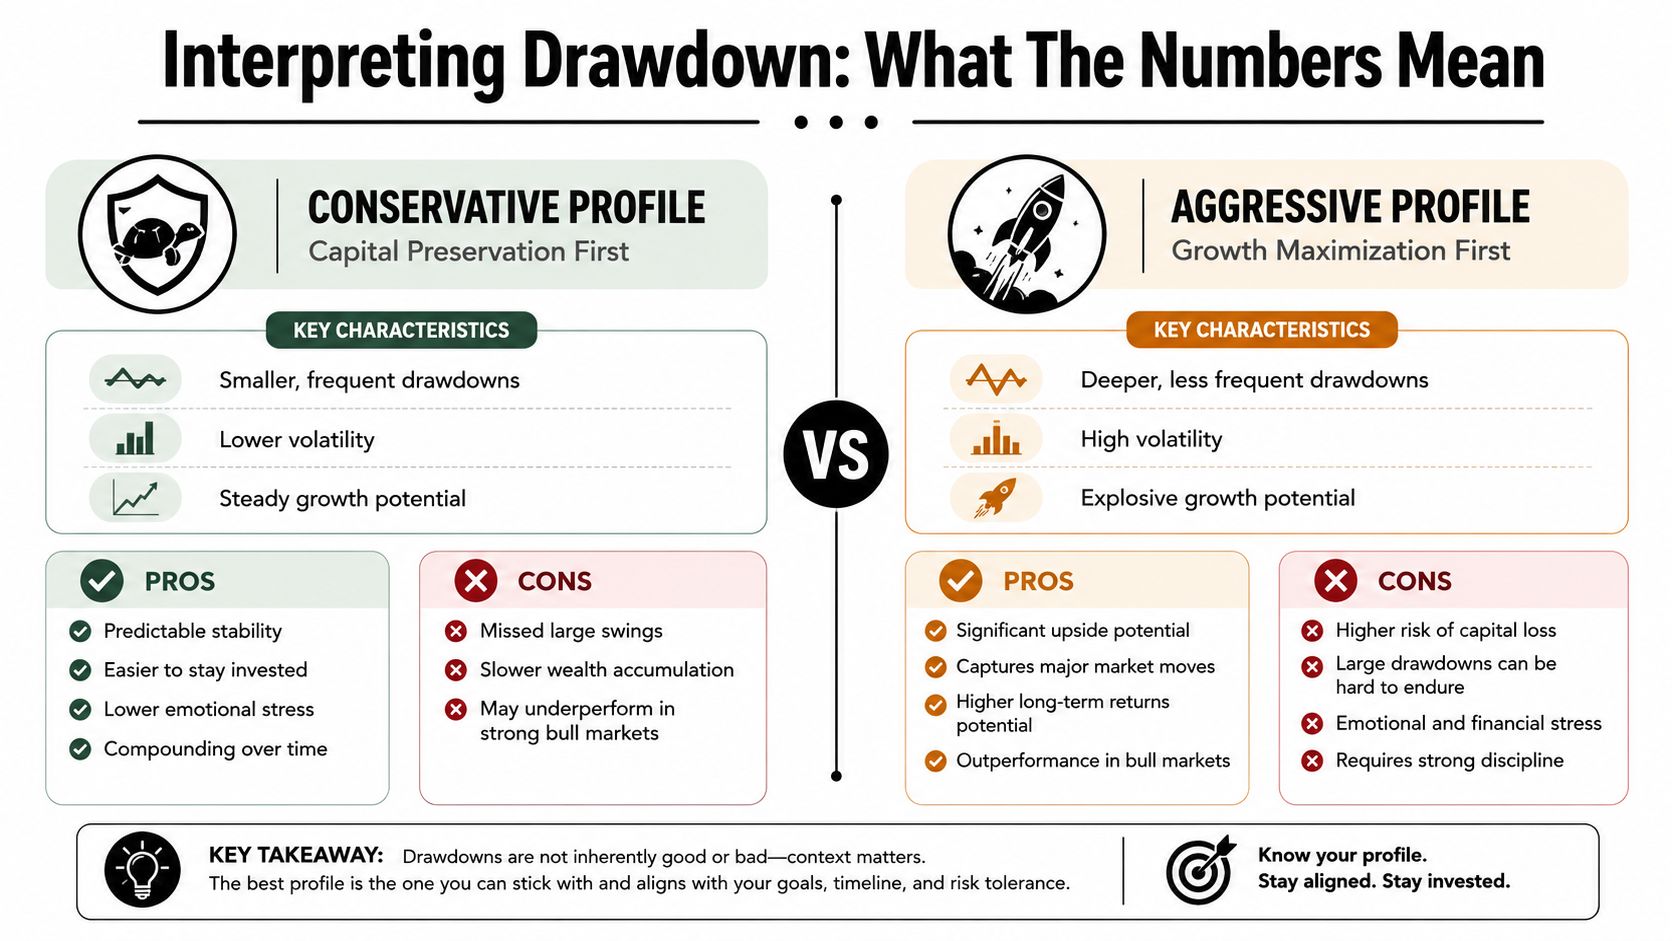
| Profile | Typical drawdown behavior | What it often suggests | Main copy-trading risk |
|---|---|---|---|
| Steady compounder | Shallower declines, quicker resets, fewer ugly equity cliffs | Process-driven execution and tighter risk control | You may abandon it during a dull period before the edge has time to work |
| Aggressive gambler | Deep equity holes, violent rebounds, uneven path | High concentration, narrative chasing, or delayed loss cutting | One unrecovered drawdown can erase months of gains |
Neither profile is automatically wrong.
The job is to match the wallet's drawdown profile to your own constraints. Capital base matters. Psychology matters. Execution lag matters too, because a copied wallet always looks cleaner in hindsight than it feels in real time.
Deep drawdowns are expensive because the recovery math gets harder as losses grow. Western Asset discusses this clearly in its analysis of drawdowns and recovery odds. The lesson transfers well to DeFi. Once a wallet enters catastrophic-loss territory, recovery usually depends on exceptional upside or luck, not normal process.
On-chain, depth also needs context. A 25% drawdown in a market-neutral farming wallet can be a red flag. The same 25% in a high-beta alt rotation wallet may be tolerable if the trader repeatedly contains it and rebuilds without widening risk. Interpretation starts with strategy type, not with the raw percentage alone.
Depth gets attention. Shape is often more useful.
A single sharp break tied to a broad liquidation says one thing. A long series of lower highs and lower lows says something else entirely. In wallet review, recurring pattern beats isolated event. If the same failure mode appears across different market regimes, that is usually the trader's process showing through.
Look for these signatures:
I care a lot about what the trader did after the drawdown started. Did position sizes shrink? Did they de-risk correlated bets? Did they stop trading the same setup that caused the damage? Wallet history can answer those questions if you review transactions, token concentration, and holding periods instead of staring only at the equity curve.
If the honest answer to that last question is no, the wallet is a bad fit for you, even if the final return looks great on a dashboard.
Drawdown analysis becomes useful when it stops being a postmortem and turns into a filter. The best traders don't review drawdowns only after a painful month. They use them before entering, while sizing, and during live risk management.
Start with a candidate set of wallets that already interest you for whatever reason. Maybe they trade the ecosystems you know well. Maybe they show consistent activity, not just a single hot streak. Then bring in drawdown as the first serious gate.
Use a checklist like this:
Reject fragile equity curves early
If a wallet history shows repeated collapse-like behavior, move on. You don't need perfect smoothness. You do need evidence that the trader can survive adverse conditions without depending on a miracle rebound.
Separate depth from duration
Professional risk work treats drawdown depth and drawdown duration as different problems. A smaller but longer drawdown can do more damage to compounding because capital stays trapped below the high-water mark for longer, as described in the CFI overview of drawdown depth and duration.
Check recovery behavior
A wallet that bounces back fast after a shock is different from one that spends months drifting under water. Fast recovery often signals either better risk reduction or better opportunity selection after the loss.
Most traders fail here because they study risk but don't operationalize it. A useful process needs rules that affect decisions.
A related discipline is position sizing. Drawdowns usually start as sizing mistakes before they show up as chart problems. If you want a practical framework for that side of the equation, this guide to a position sizing calculator for risk control fits naturally with drawdown work.
I like a simple rhythm for active DeFi research:
Small losses are operating costs. Long, unmanaged drawdowns are feedback that your process is wrong, your sizing is wrong, or both.
If you make drawdown analysis part of the daily workflow, you stop treating risk as a vibe. It becomes observable, comparable, and actionable.
A wallet is up hard over the last year. The equity curve looks copyable until you trace the path and find a drawdown that would have forced many followers out long before the recovery. That gap between reported return and lived return is the whole point of drawdown analysis.
On-chain, that gap matters even more because wallet histories are public, fast to screen, and easy to misread. A trader can look disciplined on a terminal snapshot while the underlying path shows repeated deep underwater periods, slow recoveries, or dependence on one violent rebound. PnL tells you what happened. Drawdown shows what you had to sit through to get there.
The practical question is not whether a wallet made money. It is whether the return path fits your risk tolerance, capital lockup, and ability to keep following the strategy when conditions get ugly.
Path matters. A sharp drawdown during a market-wide liquidation says something different from a long erosion during a relatively normal tape. Same headline loss, different signal. One can reflect market beta and forced deleveraging. The other often points to weak trade selection, poor sizing, or a strategy that stopped working and never adjusted.
That is the shift from admiring returns to underwriting behavior.
Review wallets the way a risk manager would. Look at the worst peak-to-trough period, the time spent below prior highs, and the quality of the recovery. Check whether the trader changed behavior after the hit or kept pressing the same exposures. In DeFi, wallet history gives you a direct record of those decisions if you bother to read past the profit column.
Returns get attention. Drawdowns decide who can hold size, keep conviction, and stay in the game long enough to compound.
If you want to inspect wallet histories with a risk-first lens, Wallet Finder.ai helps you track profitable wallets, review complete trade histories, and study the equity path behind the headline returns so you can make copy-trading decisions with more context and less guesswork.

A premier DeFi analytics platform empowering traders to discover and analyze profitable blockchain wallets, trades and tokens.

