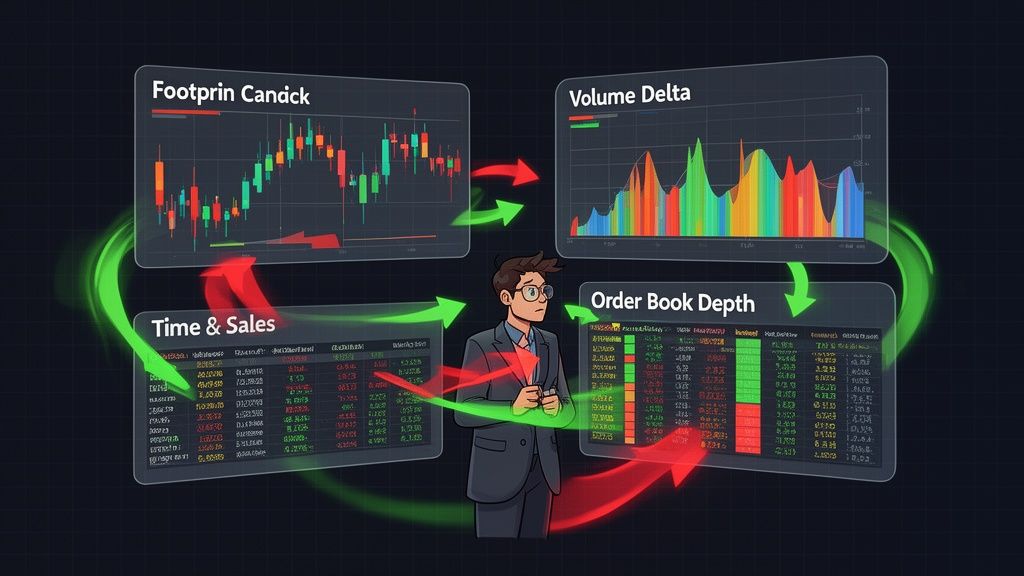
Guide to Order Flow Charts
Unlock the market's secrets with order flow charts. This guide explains footprint charts, delta, and volume profile to help you find and follow smart money.

December 26, 2025


Wallet Finder
December 27, 2025
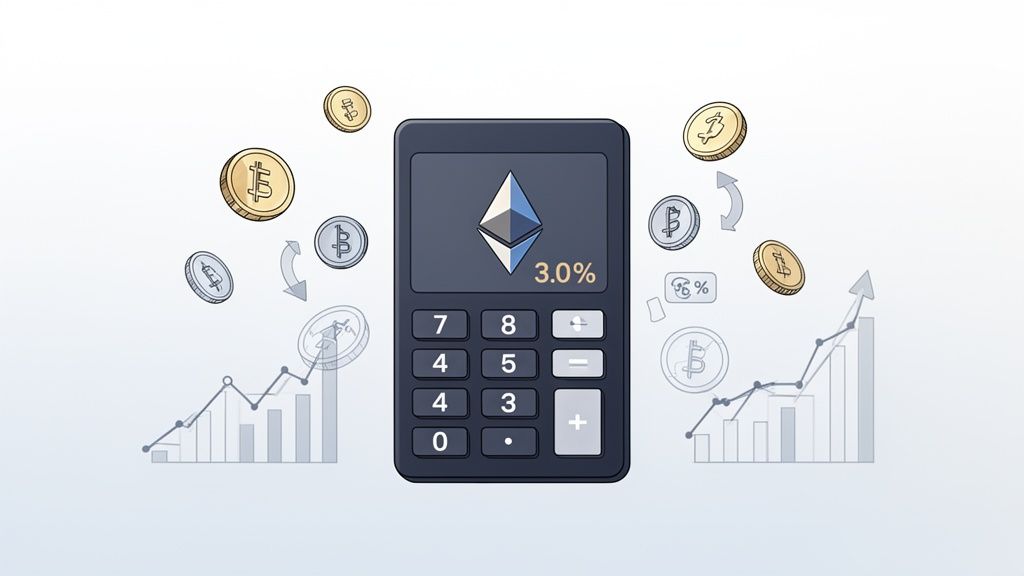
Figuring out your real profit on an Ethereum trade goes way beyond subtracting your buy price from your sell price. To get the true picture, you have to account for all the little costs that chip away at your returns, like gas fees and slippage. These can seriously eat into what you actually take home.
On the surface, calculating profit seems easy. Buy low, sell high, and the difference is yours. But the reality of trading on a decentralized network like Ethereum is a lot messier. Several hidden costs can quietly drain your gains, and if you ignore them, you're flying blind.
The starting point is always the classic Profit and Loss (PnL) formula. At its core, it’s simple:
PnL = (Sale Value - Purchase Value) - Total Fees
This formula is your foundation. The real work is digging into that "Total Fees" part and making sure you've caught every single cost.
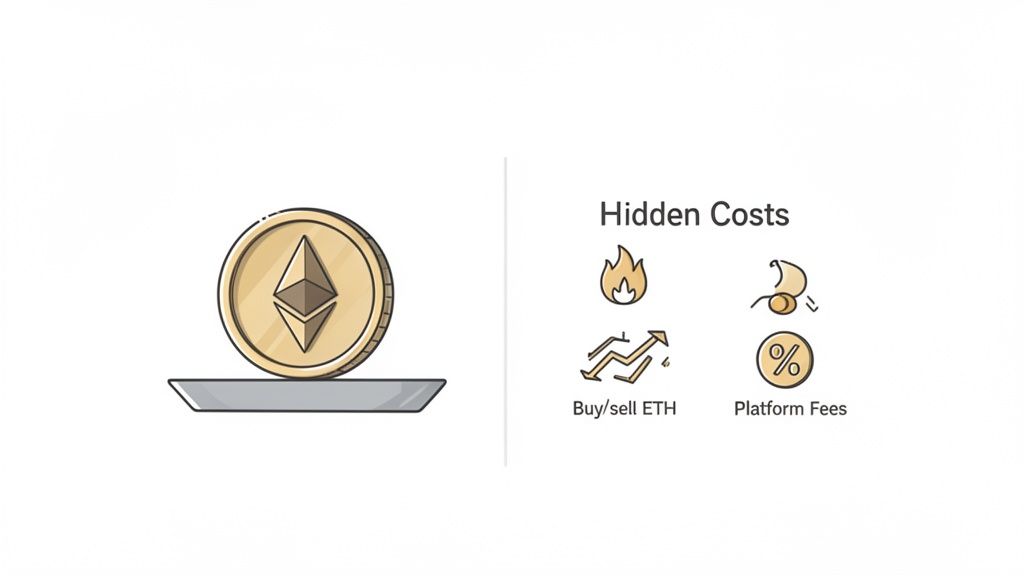
Gas fees are what you pay to have your transaction processed on the Ethereum network. Every single on-chain action—from buying a token to swapping on a DEX—costs gas. These fees are famous for being volatile, and they can skyrocket when the network is busy.
A trade that looks like a winner can flip to a loser fast if you’re not watching gas. For instance, a small $50 profit from a quick token flip can be completely erased by a $60 gas fee. This is a painful lesson many new traders learn. It’s also why experienced traders often time their transactions for off-peak hours to save on costs. If you want to get a better handle on this, check out our deep dive on Ethereum gas fees.
Key Takeaway: Always factor in gas fees for both your entry (buy) and your exit (sell). A simple round-trip trade means you're paying network costs at least twice, and both need to be in your PnL calculation.
Slippage happens in the tiny gap between when you hit "confirm" on a trade and when it actually gets executed on the blockchain. In those few seconds, the price can move—especially in volatile markets or with tokens that don't have a lot of liquidity.
Let's say you place an order to buy 1 ETH at $3,000. But by the time your transaction is processed, the price has ticked up to $3,005. You just experienced $5 of negative slippage. While most decentralized exchanges (DEXs) let you set a slippage tolerance (like 0.5%) to protect against huge price swings, it doesn't stop the small, common slippage that adds up over dozens of trades.
On top of the network-level costs, the platforms and protocols you use take their own cut. Centralized exchanges have their trading fees, and decentralized exchanges like Uniswap have liquidity provider (LP) fees baked into every single swap.
These are often a fixed percentage, like the common 0.3% on many popular DEX pools. It might not sound like much on one trade, but for an active trader making hundreds of swaps, those fees become a significant drag on performance.
To do this right, you have to be meticulous. The table below breaks down the essential costs you need to track for any accurate PnL calculation.
Getting a handle on these variables is the first critical step. Without a complete picture of your costs, you're not calculating your profit—you're just guessing.
Theory is great, but let's get our hands dirty. The best way to really understand your crypto finances is to start with the basics: calculating the profit from a simple, single Ethereum trade. This is a foundational skill, and it’s about more than just the difference between your buy and sell price. You have to account for every single cost.
The formula at its core is straightforward. Think of it as your North Star:
Net Profit = (Final Sale Value) - (Initial Purchase Cost + Total Fees)
This simple equation forces you to paint the full financial picture of your trade, from the second you click "buy" to the moment you cash out. The tricky part, as always, is nailing down each of those numbers, especially the fees.
Let's walk through a real-world example to make this tangible. Say you decide to buy 2 ETH, hang onto it for a week, and then sell.
Step 1: Calculate Your Total Initial Cost
First up, we need to figure out your Initial Purchase Cost. This isn't just the price tag on the ETH; it includes the gas fee you paid to get the transaction on the blockchain.
That $6,035 is your true cost basis—the total capital you've put on the line. Forgetting to add that gas fee is the first mistake people make, and it throws off every calculation that follows.
Pro Tip: Don't guess your gas fees. Pull them directly from a block explorer like Etherscan. Just pop in your transaction hash (TxID), and it'll show you the exact "Transaction Fee" you paid. On-chain data is your source of truth.
Step 2: Calculate Your Net Sale Proceeds
A week goes by, ETH has a nice little run-up, and you decide it's time to take some profits off the table. Now, we calculate the Final Sale Value, and just like before, we have to subtract the gas fee for the sell transaction.
Step 3: Bring It All Together for Net Profit
Okay, we've got all our numbers. Now we can plug them into the main formula and see what you actually pocketed.
See the difference? If you only looked at the price action, you might have told your friends you made $400 ($6,400 - $6,000). But after factoring in the $60 in total gas fees ($35 to buy + $25 to sell), your actual take-home profit is $340. Those "small" fees chewed away 15% of your potential gain.
This is exactly why a precise ethereum profit calculator has to sweat the details. Timing is everything. For instance, imagine buying ETH on December 19, 2025. It opened at $2,827.41 and screamed to a close of $2,977.971—a massive 5.32% daily gain, or $150.56 profit per ETH. The very next day, December 20, it was a snoozefest, closing at $2,977.583 with a tiny loss of just $0.287 per ETH. Smart DeFi traders using platforms like Wallet Finder.ai aren't just watching these daily charts; they're tracking top wallets and mirroring their real-time PnL. You can learn more about how these price swings create opportunity and how to track them on WEEX.com.
Simple buy-and-sell trades are just the beginning. The real challenge for any serious trader comes when you dive into the wild world of Decentralized Finance (DeFi). Transactions here are rarely a straightforward swap for cash; instead, you're dealing with complex token swaps, multi-hop trades, or positions you've been building for months.
This visual flow breaks down the core steps: you start with the initial buy, account for all the costs that chip away at your returns, and finally, see your gain or loss when you sell.
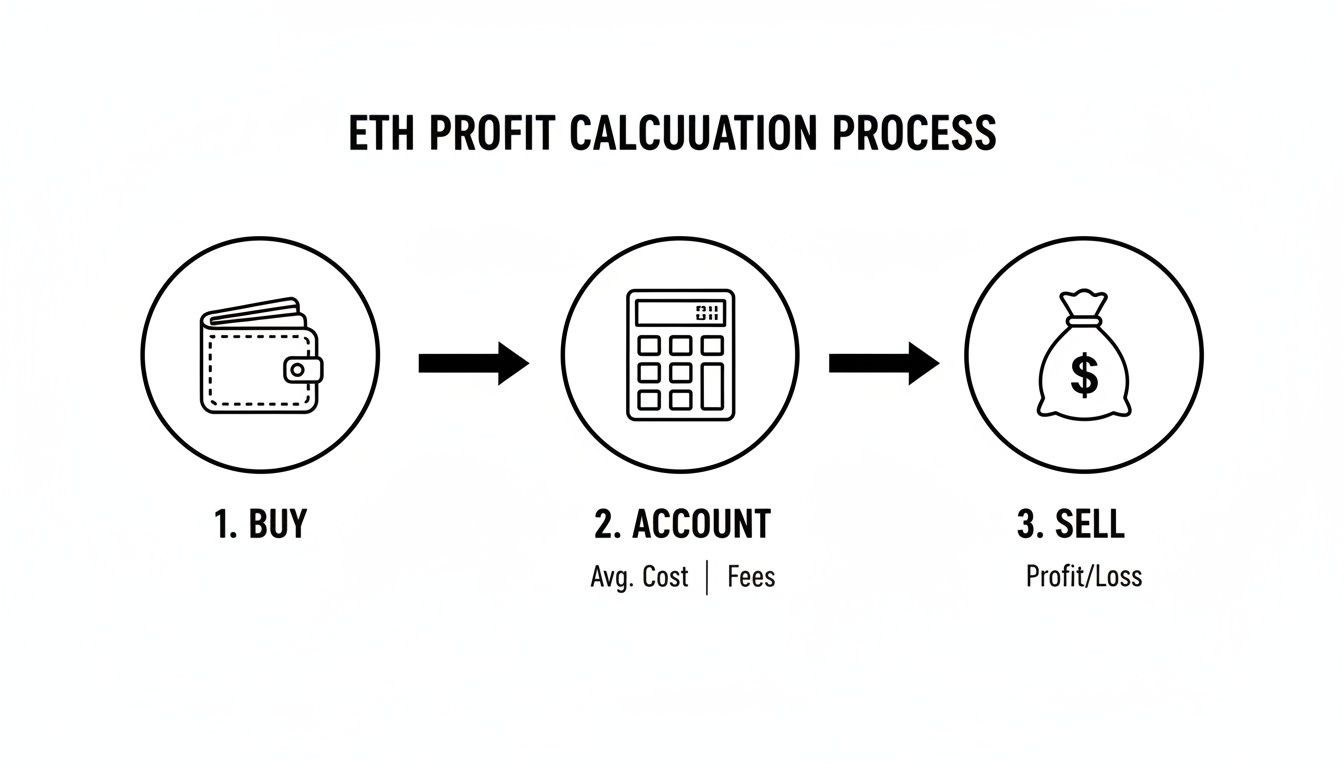
As you can see, that middle step—accurately accounting for every single fee—is what separates a rough guess from a true PnL calculation.
When you swap ETH for another token, like LINK, on a DEX such as Uniswap, you aren't actually realizing a profit in USD terms. What you're really doing is opening a brand new position in a different asset. To figure out your PnL, you have to nail down the dollar value of both assets at the exact moment of the swap, plus all the fees involved.
Let's walk through an example. Imagine you swap 1 ETH for 200 LINK.
Your final profit calculation looks like this:
Net Profit = Final Swap Value - Initial Cost Basis - Exit Gas FeeNet Profit = $3,600 - $3,040 - $30 = $530
This kind of multi-step tracking is absolutely essential for getting an accurate picture of your DeFi swap performance.
Dollar-cost averaging (DCA) is a classic strategy where you buy a fixed dollar amount of an asset on a regular schedule, no matter the price. It's fantastic for smoothing out market volatility, but it creates a massive headache for PnL calculations. Why? Because you now have multiple entry points at different prices. The solution is to calculate your average cost basis.
Let's say you made three separate buys of ETH:
You're now holding 1.5 ETH after a total investment of $4,500.
The Key Insight: Your average cost per ETH isn't a simple average of the three prices. It's the total amount you spent divided by the total amount of ETH you acquired. This gives you a single, unified cost basis for your entire position.
To find your average cost basis, use this formula:
Average Cost Basis = Total USD Invested / Total ETH AcquiredAverage Cost Basis = $4,500 / 1.5 ETH = $3,000 per ETH
Now, when you decide to sell your whole 1.5 ETH stack at a market price of $3,500/ETH, the math becomes simple again.
Just don't forget to subtract the gas fees for all four transactions (the three buys and the one sell) from this gross profit to find your actual net PnL.
Different DeFi trading scenarios require different ways of thinking about your PnL. If you use the wrong method, you'll end up with a completely distorted view of how well your portfolio is actually doing.
Here's a quick comparison of the right approach for each trade type.
Mastering these different methods is non-negotiable for anyone who's serious about tracking their performance in DeFi. Each strategy adds a layer of complexity that basic profit calculators often miss, making diligent, accurate record-keeping your most valuable tool.
In crypto, not all profit is created equal. Seeing a big green number in your portfolio tracker is a great feeling, but it doesn't mean you have cash in your pocket. This is a critical distinction that separates your "paper gains" from actual, spendable earnings—a concept you absolutely need to grasp for smart risk management and, just as importantly, for staying on the right side of the tax man.
The two terms you'll hear constantly are realized PnL and unrealized PnL. Think of it this way: unrealized profit is the potential money you’d make if you sold an asset right this second. It’s hypothetical. It's fleeting. It can vanish in a heartbeat during a market downturn.
Realized profit, on the other hand, is the cold, hard gain you've locked in by actually completing a trade. It’s the money that hits your account after selling or swapping an asset for something else.
Let's walk through a quick scenario. Imagine you buy 1 ETH at $3,000. A week later, the price pumps to $3,500. At that moment, your portfolio is showing a cool $500 in unrealized profit. It feels good, but it's not yours yet.
If the market suddenly tanks and ETH drops back to $3,000 before you hit the sell button, that $500 paper gain is gone. Poof. It never existed outside of your screen.
Key Takeaway: Unrealized PnL is a performance metric, not a bankable asset. Getting too attached to paper gains can lead to terrible risk management, tempting traders to hold a position for too long, only to watch their potential profits evaporate.
This distinction gets very real, very fast when we talk about taxes. Tax agencies like the IRS are almost exclusively concerned with realized gains. Simply holding an asset that has gone up in value (an unrealized gain) is typically not a taxable event.
A taxable event happens the moment you dispose of your asset. That's the action that "realizes" the gain or loss. For a deeper dive into the whole process, you might want to check out our complete guide on how to calculate crypto profit.
Common actions that will trigger a taxable event include:
Meticulously tracking these events is non-negotiable. Every time you realize a gain, you potentially create a tax liability. Any good Ethereum profit calculator must not only track PnL but also timestamp these events. This is crucial for differentiating between short-term and long-term capital gains, which often have very different tax rates.
For U.S. taxpayers, holding an asset for more than one year before selling typically qualifies the profit as a long-term capital gain, which is usually taxed at a much lower rate. Gains from assets held for a year or less are considered short-term gains and are taxed as ordinary income. This makes tracking your holding periods just as important as tracking your prices.

Let's be honest: manually logging every single trade into a spreadsheet is a recipe for disaster. It's not just tedious; it's how costly mistakes happen. An incorrect gas fee here or a miscalculated cost basis there can completely throw off your actual performance.
The smart move is to automate. This is where modern wallet tracking tools come in. Think of platforms like Wallet Finder.ai as a supercharged ethereum profit calculator. They plug directly into on-chain data, pulling and parsing every transaction automatically. You get a real-time, perfectly accurate picture of your portfolio's performance without lifting a finger.
The biggest win with automation is accuracy. These tools grab data straight from the blockchain, capturing every fee, slippage detail, and transaction timestamp with perfect fidelity. Human error is completely eliminated, giving you a rock-solid foundation for your PnL calculations.
But more importantly, automation frees you up to think about strategy. Instead of spending hours matching up transactions, you can analyze your win rates, see which assets are actually driving your growth, and refine what works. It’s a huge shift from being a bookkeeper to being an analyst.
Key Takeaway: The goal of automation isn't just to save a few hours. It's about turning messy, raw blockchain data into clear, actionable intelligence that tells you why you're winning or losing, not just what the numbers are.
This kind of detail is also incredibly powerful for refining your approach. We all know that dollar-cost averaging (DCA) into Ethereum has historically been a solid long-term play. With a tool like Wallet Finder.ai, you can take that concept and apply it to finding top Ethereum wallets that show similar consistency. You can filter for traders with 30-50% win streaks and strong PnL track records. Pro traders do this all the time, mirroring strategies that yield 35%+ ROIs and even exporting the datasets for their own custom analysis.
The real power of advanced wallet trackers is their ability to look beyond your own portfolio. These platforms let you find and follow the wallets of top-performing traders, effectively turning the entire blockchain into a source of fresh ideas, or "alpha."
This changes everything. Instead of just calculating your own PnL, you can see the complete, transparent trading history of wallets that are consistently in the green. You can dissect their exact entry and exit points, see how long they hold tokens, and check their win rates on specific assets.
Using a crypto wallet tracker is like getting to look over the shoulder of a seasoned pro. It gives you a massive informational edge.
Here’s a simple process for turning this on-chain data into actionable moves:
By automating your own PnL and tapping into the transparent world of on-chain data, you upgrade a simple ethereum profit calculator into a powerful tool for discovery. You stop just reacting to the market and start anticipating moves based on what the most successful traders are doing.
Even with the right formulas, calculating your Ethereum profit can throw a few curveballs your way. This section is your quick-reference guide for the common hurdles and tricky details you'll run into, whether you're using a simple profit calculator or trying to nail down your on-chain PnL.
Let's cut through the confusion and get you some clear, actionable answers. Getting these details right is what separates a wild guess from a true financial record.
The only way to do this with 100% accuracy is to pull the data directly from the blockchain. For any trade you make, you'll need to use a block explorer like Etherscan and look up your transaction hash (TxID).
Once you're on the transaction page, you'll see the exact "Transaction Fee" you paid in ETH. You have to log this fee for both the buy and the sell.
To be truly precise, you should convert that ETH fee into your local currency using the price of ETH at the exact moment the transaction happened. For anyone trading frequently, this is a nightmare to do by hand. It's exactly why automated tools like Wallet Finder.ai, which pull and parse this on-chain data for you, are a game-changer.
Pro Tip: Remember, gas fees are added to your cost basis. If you bought 1 ETH for $3,000 and paid $50 in gas, your real cost basis is $3,050. This is huge because it lowers your taxable gain when you eventually sell.
For a quick and dirty calculation on a single buy-and-sell trade, the free tools on sites like CoinGecko or the ones built into major exchanges are perfectly fine. They're great for getting a ballpark figure without getting lost in the weeds.
But here’s the thing: for any serious DeFi trader, those simple calculators just don't cut it. As soon as your strategy involves complex token swaps, liquidity providing, or even just dollar-cost averaging, they fall apart. They can't handle multiple cost basis entries or track fees across different protocols.
In those cases, the "best" calculator isn't a calculator at all—it's a full-blown wallet tracking platform that calculates your PnL automatically by reading on-chain data. That's how you get a complete and precise picture of your actual performance.
You absolutely can, but be warned: the math gets a lot more complex, and you'll need to keep meticulous records. Each of these DeFi activities has its own set of rules for calculating PnL accurately.
Let's break them down:
Forgetting about impermanent loss is probably the most common mistake LP providers make. It can easily make what looks like a profitable position on paper a net loss the moment you pull your funds out. For this reason, specialized DeFi portfolio trackers are practically a necessity for getting an accurate LP profit figure.
Ready to stop guessing and start knowing your real PnL? Wallet Finder.ai automates the entire process, giving you crystal-clear insights into your trading performance while helping you discover and mirror the strategies of top-performing wallets. Start your free trial today and turn on-chain data into your competitive advantage. https://www.walletfinder.ai
"I've tried the beta version of Walletfinder.ai extensively and I was blown away by how you can filter through the data, and the massive profitable wallets available in the filter presets, unbelievably valuable for any trader or copy trader. This is unfair advantage."
.avif)
Pablo Massa
Experienced DeFi Trader
Smarter trades, made simple.
.svg)
.svg)