
Recovery Factor Calculation for Smart Traders
Master the recovery factor calculation to measure a strategy's resilience. Learn the formula, see DeFi examples, and find top wallets with Wallet Finder.ai.

June 20, 2026


Wallet Finder
April 27, 2026
You spot a token after it explodes, pull up the chart, and wonder why it looked invisible a few days earlier. A lot of traders make the same mistake. They watch price, volume, and wallet flows, but they ignore search behavior until the move is already obvious.
Search demand is one of the cleanest off-chain signals you can add to a crypto workflow. When people start searching a token name, a chain, or a strategy before liquidity fully rotates, that attention often shows up before the chart looks mature. That’s why google trend api python is worth learning properly, not as a toy script but as a repeatable input into trading research.

The first clue for a crypto move doesn’t always come from price. It often comes from attention. Search activity captures curiosity from people who aren't yet in the market, are just hearing a narrative, or are starting to investigate a token after seeing it mentioned in chats, videos, or news feeds.
That matters because crypto trades on narrative as much as fundamentals. A rising search pattern for terms like a chain name, a memecoin ticker, or a DeFi strategy can tell you that demand is broadening beyond a small cluster of on-chain insiders. If you're only screening DEX prints and wallet labels, you're missing that layer.
On-chain data tells you who is acting. Google Trends helps you estimate what the crowd is starting to care about.
That combination is useful in a few situations:
Search interest won't replace order flow analysis. It gives context to order flow, which is often what separates noise from a narrative with room left.
For Python users, the common entry point has been pytrends, an unofficial library first released in 2017 with over 1.2 million downloads as of early 2026, according to the pytrends package listing on PyPI. That same source notes that pytrends supports up to five keywords per query and exposes datasets like Interest Over Time and Interest by Region.
Manual checks in the Google Trends website are fine for curiosity. They aren't enough for trading.
You want scripts that can:
Python does that well because pandas gives you a clean path from pull to feature engineering to alert logic. The trap is that most guides stop at a single working request. For trading, that’s the easy part. Reliability is the hard part.
Start simple. Install the base tools, make one connection, and force yourself to use the correct request pattern from the beginning. Most pytrends errors come from skipping setup details that look minor but aren't.
You only need a few packages to begin:
pip install pytrendspip install pandaspip install python-dotenvProper pytrends usage requires build_payload() before extraction, supports historical timeframes back to January 1, 2004, and commonly uses sequential processing to avoid rate-limiting issues, as described in this ScraperAPI guide to Google Trends scraping.
If you’re organizing multiple scripts and credentials, this short guide to a Google Sheets API key workflow is also a practical reference for keeping config cleaner across small data projects.
A clean initialization looks like this:
from pytrends.request import TrendReqimport pandas as pdpytrends = TrendReq(hl='en-US', tz=360)Two parameters matter immediately:
hl='en-US' sets the interface languagetz=360 sets timezone offset in minutesKeep those stable across runs. If you change your setup midstream, comparisons get messier and debugging becomes harder than it needs to be.
This is the part beginners skip. pytrends doesn't infer your active request context well enough for sloppy usage. You need to define the payload before calling an extraction method.
kw_list = ["solana", "base"]pytrends.build_payload(kw_list=kw_list,cat=0,timeframe='today 12-m',geo='',gprop='')Then pull data:
iot = pytrends.interest_over_time()print(iot.tail())Use this as a baseline before you add loops, retries, or proxies:
from pytrends.request import TrendReqimport pandas as pdpytrends = TrendReq(hl='en-US', tz=360)kw_list = ["solana", "base"]pytrends.build_payload(kw_list=kw_list,cat=0,timeframe='today 12-m',geo='',gprop='')iot = pytrends.interest_over_time()if 'isPartial' in iot.columns:iot = iot.drop(columns=['isPartial'])print(iot.head())print(iot.describe())Practical rule: Get one keyword set working end to end before you automate anything. A script that runs once and saves clean output is more valuable than a larger script that fails unpredictably.
A few habits help immediately:
That separation matters because your exploratory code will tolerate manual reruns. Production code won't.
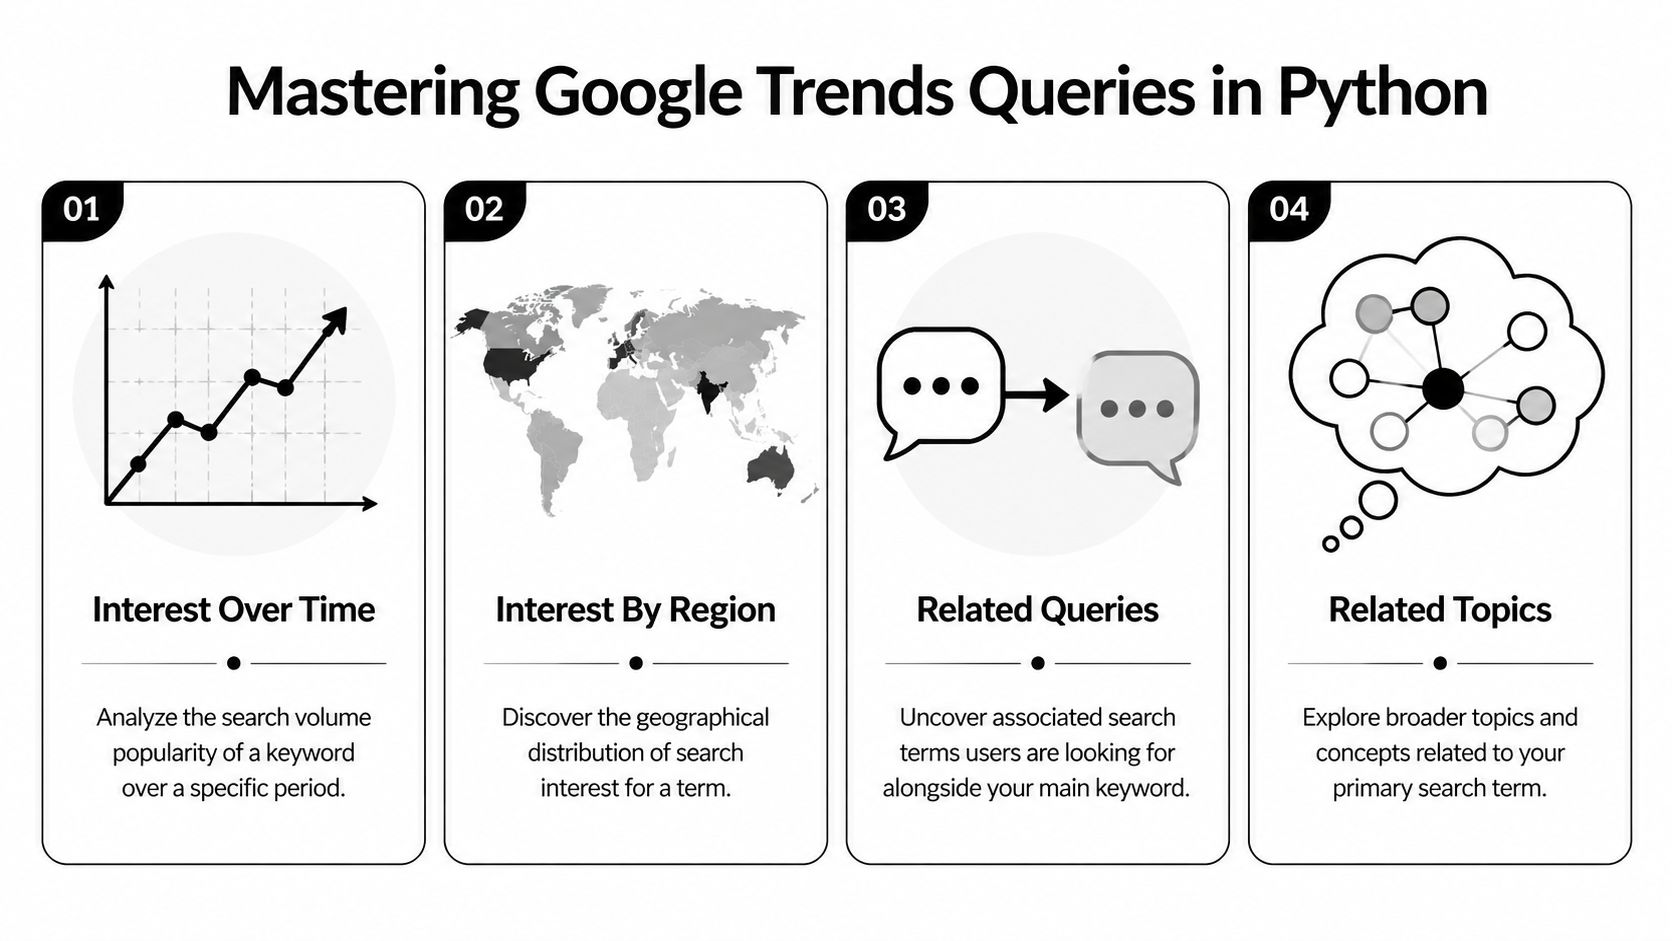
Most traders only use one method, interest_over_time(), and leave a lot of value on the table. The stronger workflow uses several query types for different jobs: tracking narratives, mapping geography, surfacing adjacent terms, and scanning the daily attention tape.
This is the main chart and a common initial request. It returns indexed search interest across the timeframe you request.
from pytrends.request import TrendReqimport pandas as pdimport matplotlib.pyplot as pltpytrends = TrendReq(hl='en-US', tz=360)kw_list = ["solana", "base"]pytrends.build_payload(kw_list, timeframe='today 12-m', geo='')trends_df = pytrends.interest_over_time()if 'isPartial' in trends_df.columns:trends_df = trends_df.drop(columns=['isPartial'])print(trends_df.tail())trends_df[kw_list].plot(figsize=(10, 5), title="Search Interest Over Time")plt.xlabel("Date")plt.ylabel("Indexed Interest")plt.show()Use this for:
One useful extension is to compute your own smoothed signal:
signal_df = trends_df.copy()signal_df["solana_rolling"] = signal_df["solana"].rolling(52).mean()signal_df["base_rolling"] = signal_df["base"].rolling(52).mean()The weekly default aggregation makes a 52-week rolling average a sensible long-horizon smoother when you're studying momentum rather than intraday noise.
If a token starts showing concentrated search interest in a particular geography, that's a clue worth checking against exchange access, local communities, and language-specific influencer clusters.
pytrends.build_payload(["solana"], timeframe='today 12-m', geo='')region_df = pytrends.interest_by_region(resolution='COUNTRY', inc_low_vol=True)print(region_df.sort_values("solana", ascending=False).head(10))This output is useful for:
For subnational views, pytrends can also return more detailed geographic breakdowns where available.
Related queries are one of the best discovery tools in a crypto workflow. They reveal what users are searching alongside your seed term. That’s how you move from a known narrative to possible breakout subtopics.
pytrends.build_payload(["solana"], timeframe='today 3-m', geo='')rq = pytrends.related_queries()top_queries = rq["solana"]["top"]rising_queries = rq["solana"]["rising"]print("Top queries")print(top_queries.head())print("\nRising queries")print(rising_queries.head())The trading use case is straightforward. Start with a broad term like a chain name or sector. Then inspect rising related searches for protocol names, bot names, wallet apps, or strategy terms that deserve their own pull.
When related queries start naming specific assets or products, you're no longer measuring broad curiosity. You're measuring where attention is trying to land.
Related topics are broader than related queries. They help when users don't search the exact token string but are clearly moving into the same concept cluster.
pytrends.build_payload(["defi"], timeframe='today 3-m', geo='')rt = pytrends.related_topics()top_topics = rt["defi"]["top"]rising_topics = rt["defi"]["rising"]print("Top topics")print(top_topics.head())print("\nRising topics")print(rising_topics.head())Use this when you're mapping a narrative rather than screening one ticker. For example, a chain thesis might branch into bridges, launchpads, wallets, and memecoin tooling before any single coin dominates attention.
Trending searches are less precise for portfolio research, but they’re useful for context. They tell you what the broader search environment looks like right now.
daily_df = pytrends.trending_searches()print(daily_df.head(20))This helps with:
| Method | What it answers | Best trading use |
|---|---|---|
interest_over_time() | Is attention rising, stable, or fading? | Trend persistence |
interest_by_region() | Where is demand clustering? | Geo validation |
related_queries() | What exact searches are expanding around this term? | Token discovery |
related_topics() | What concept cluster is forming? | Narrative mapping |
trending_searches() | What is the broader public searching now? | Macro attention context |
A practical workflow is to start broad, then narrow. Pull a chain or sector term, inspect related queries and topics, promote interesting terms into a new watchlist, then track those with time-series and regional pulls.
A pytrends script that works on your laptop once isn't a production data source. That's the biggest gap in most google trend api python tutorials. They show extraction. They don't show what breaks when you scale it.
The first is rate limiting. pytrends is an unofficial interface, and rate behavior isn't documented the way a formal vendor API would document it. The second is scaling inconsistency. pytrends data is tied to request-level normalization, which means different requests can distort comparisons.
That second issue is the bigger analytical risk. A chart can look clean and still be misleading if the series came from separate rescaled pulls.
A widely overlooked issue in pytrends usage is handling throttling and scaling inconsistencies. The pytrends repository discussion cited in this background reference highlights that, unlike pytrends' per-request rescaling, the official Google Trends API introduced in July 2025 provides consistent scaling across requests for production systems.
If you plan to merge trend series across batches, request consistency matters more than convenience.
pytrends is still useful. It's good for exploration, testing ideas, and validating whether a term even deserves a place in your pipeline.
It breaks down when you need:
A few defensive practices help:
Google launched an official Trends API in alpha in 2025 with consistent cross-request scaling and JSON responses, according to the Google Search Central announcement about the Trends API. That design is materially better for production because you can compare and merge data without fighting website-style rescaling behavior.
The official API also changes how you update data. With consistent scaling, you can pull only the latest period for monitored terms instead of repulling full histories just to keep series comparable.
| Method | Cost | Rate Limits | Data Scaling | Best For |
|---|---|---|---|---|
| pytrends | Free library use | Undocumented and can become a practical bottleneck | Per-request scaling | Exploration and prototypes |
| Official Google Trends API | API-based access | Structured API workflow | Consistent across requests | Production pipelines |
| SerpApi-style managed service | Paid service model | Managed by provider | Depends on provider output | Teams that want less scraping overhead |
The right choice depends on what you're building.
If you're testing whether search interest helps your process, pytrends is enough. If you're feeding alerts, ranking models, or multi-source dashboards, the unofficial route becomes harder to defend.
A strong stack usually looks like this:
That last point is where most false positives die, which is exactly what you want.
A usable signal doesn’t come from a trend chart alone. It comes from agreement between off-chain attention and on-chain behavior.
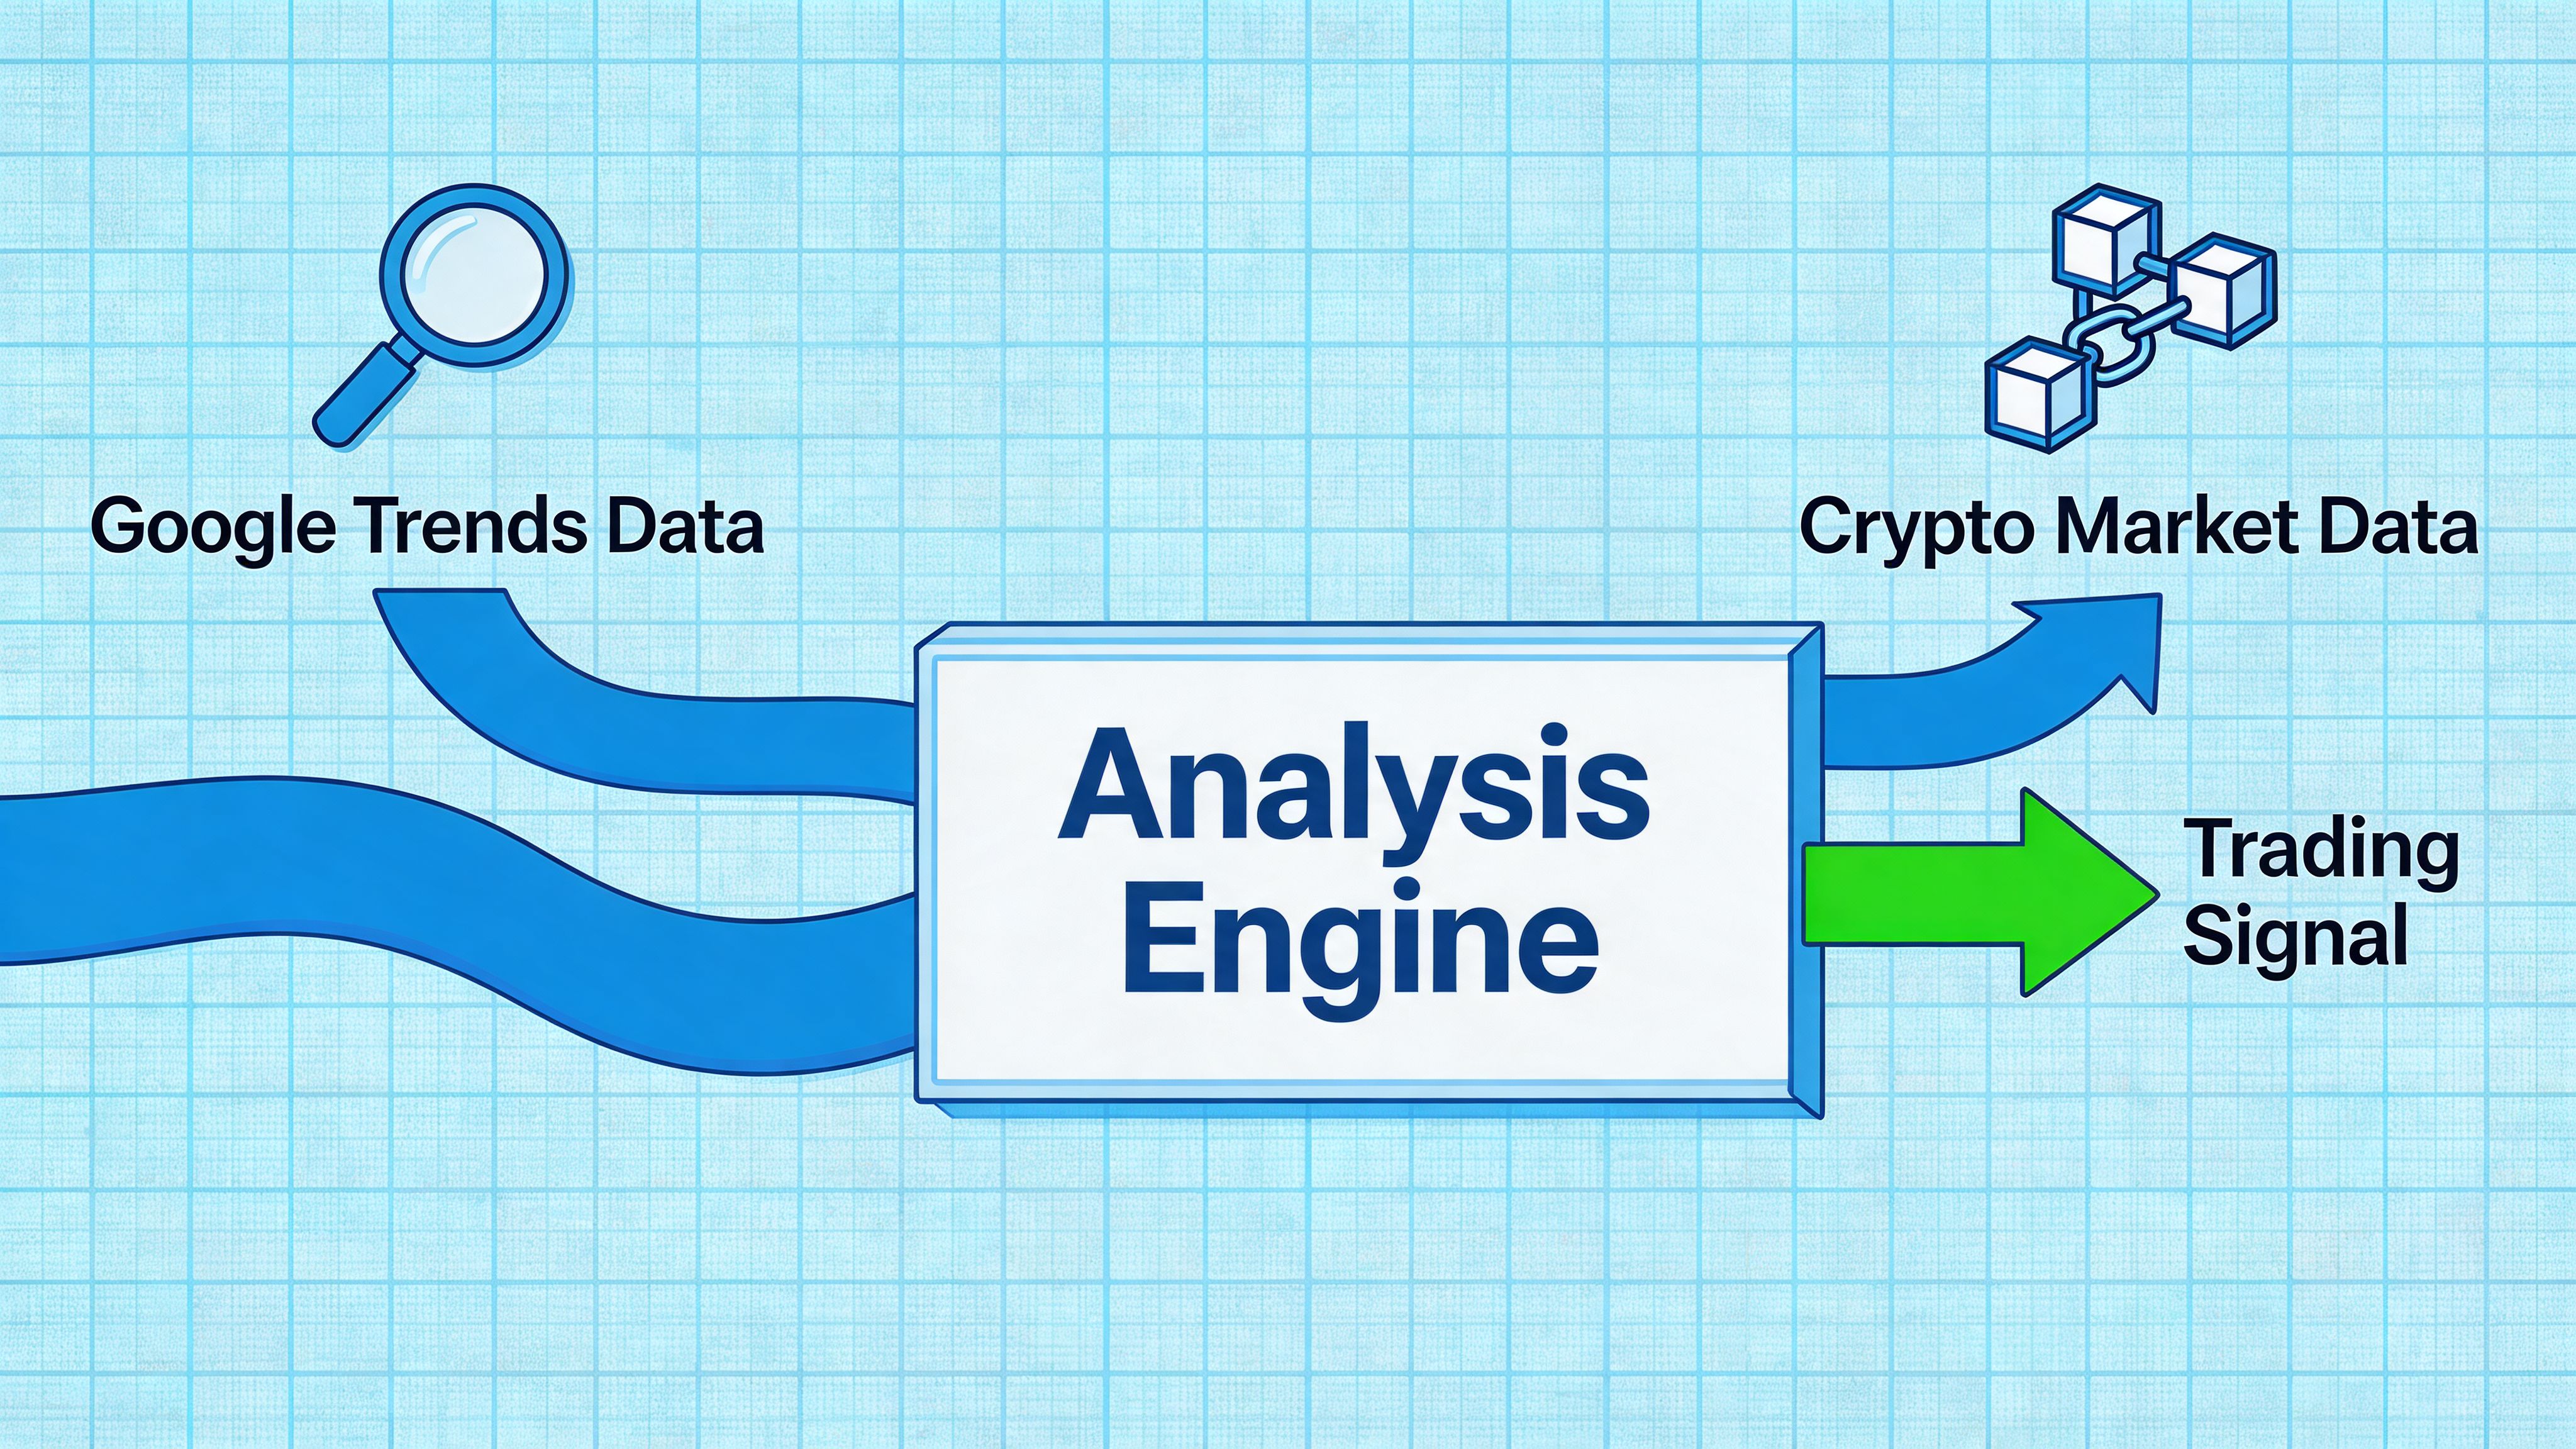
A solid workflow starts with a broad narrative term, narrows into related searches, then checks whether the wallets you care about are positioning into the same theme. That’s where search data stops being interesting and starts being useful.
Start with a seed term such as a chain, sector, or app category. Pull related queries and rising topics. Promote any promising names into a second watchlist. Then measure whether those terms are gaining steady interest rather than printing one noisy spike.
After that, compare the attention shift with on-chain evidence. If search interest is rising but smart wallets aren't touching the asset or ecosystem, the setup may be retail curiosity without capital commitment. If both move together, the trade becomes much more actionable.
A key challenge is combining Google Trends data with live crypto data sources. One simple example is joining DataFrames in Python with pd.merge(trends_df, wallet_pnl_df, on='date'), as shown in this SerpApi article on Google Trends scraping alternatives.
Here is the simplest shape of that workflow:
import pandas as pd# trends_df indexed or keyed by date# wallet_pnl_df keyed by date with wallet metricsmerged_df = pd.merge(trends_df, wallet_pnl_df, on='date')print(merged_df.head())Once the tables are joined, you can build features like:
For broader market context, it also helps to maintain a clean crypto pricing feed. This overview of an API for crypto prices is useful when you're building the price side of the same research stack.
A practical filter might look like this:
This is also a good place to review visual workflows before you code your own alerts:
The best setups tend to have three properties.
First, the search move isn't isolated to one random day. It shows persistence. Second, related searches are converging on specific assets, apps, or chain-native tools rather than staying generic. Third, wallets with a record you trust are active in the same area.
A search spike is attention. A search trend plus wallet accumulation is a thesis worth testing.
That doesn't guarantee a trade works. It gives you a better shortlist, which is what a signal engine should do.
Most mistakes happen after the data pull, not during it. Traders see a neat line, assume it predicts price, and skip the hard part of interpretation.
The bigger lesson is simple. Google Trends is a strong secondary signal, not a standalone oracle. Use it to narrow the field, validate narratives, and time deeper research. That's where it earns its place in a crypto stack.
Wallet Finder.ai helps traders turn wallet activity into actionable research across Ethereum, Solana, Base, and other ecosystems. If you want to pair search-driven narrative discovery with live smart money tracking, explore Wallet Finder.ai to find profitable wallets, monitor trades, and act faster when real capital starts moving.

A premier DeFi analytics platform empowering traders to discover and analyze profitable blockchain wallets, trades and tokens.

