
Recovery Factor Calculation for Smart Traders
Master the recovery factor calculation to measure a strategy's resilience. Learn the formula, see DeFi examples, and find top wallets with Wallet Finder.ai.

June 20, 2026


Wallet Finder
March 29, 2026
To calculate your risk reward ratio, you simply divide your potential profit by your potential loss. This essential calculation is the foundation of disciplined trading, turning speculative guesses into a structured, mathematical edge.
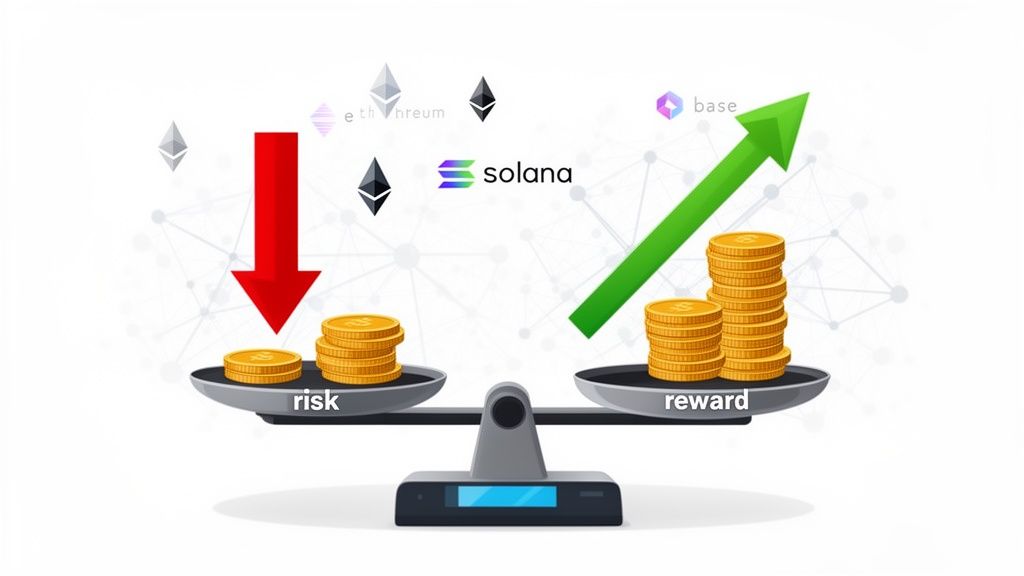
In the volatile world of DeFi, one simple calculation separates consistently profitable traders from the rest. The risk reward ratio (RRR) is a fundamental metric that weighs how much you stand to gain against how much you’re willing to lose on any given trade.
This is the exact math that top-performing wallets on Ethereum, Solana, and Base use to protect their capital and lock in gains. This guide provides actionable steps, not abstract theory. We'll show you how to apply this ratio when analyzing trades you find on platforms like Wallet Finder.ai.
Mastering your risk reward ratio transforms gut feelings into a repeatable, data-driven strategy. It forces you to define your exit points—both for taking profit and cutting losses—before you enter a trade. This discipline provides a massive edge in an emotion-driven market.
Here's how a clear RRR helps you trade smarter:
A trader who consistently aims for a 1:3 risk reward ratio only needs to be right more than 25% of the time to be profitable. This is the mathematical safety net that lets you survive downturns and build wealth.
The calculation is incredibly straightforward. It requires just three numbers you must define before entering any trade, separating strategic trading from gambling.
For a great visual guide on plotting these levels, check out our deep dive on the risk reward chart.
Here’s a quick reference table for any DeFi trade:
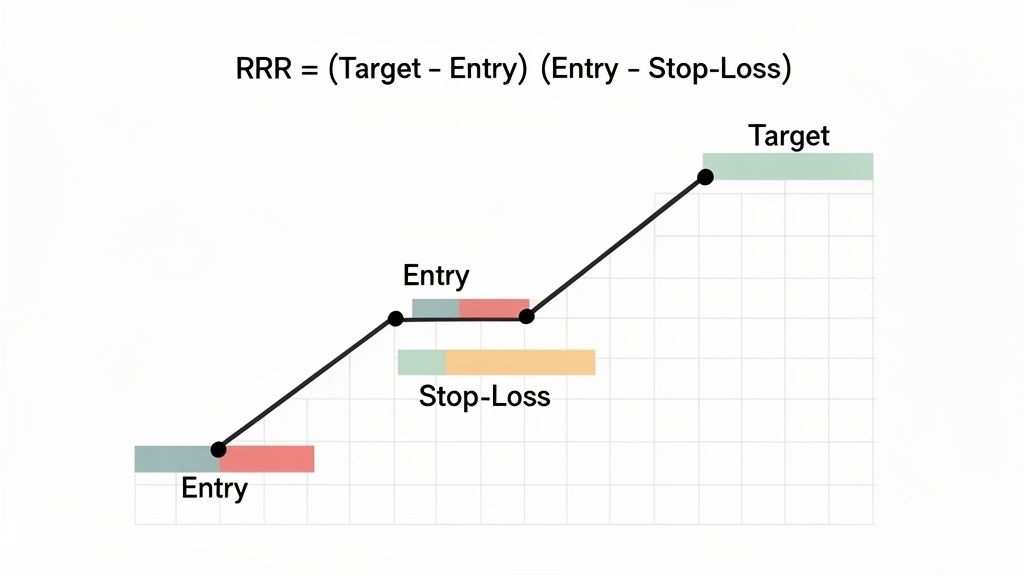
At the heart of every professional trading plan lies this simple, powerful piece of math. The formula for the risk reward ratio (RRR) provides the structure and discipline for your trading decisions.
It’s calculated as: RRR = (Target Price - Entry Price) / (Entry Price - Stop-Loss Price)
Don't just see this as a formula; see it as a mandatory checklist for every trade. Each variable represents a non-negotiable part of your plan.
Here are the three essential components:
Let’s apply this formula to real DeFi scenarios. The calculation is the same whether you're going long (betting the price will rise) or short (betting it will fall).
Example 1: A Long on a Trending Altcoin
Imagine a popular token on Solana, $SOLANACOIN, is trading at $50. After analyzing the chart, you've identified key levels.
Now, plug these numbers into the formula:
This trade offers a 1:3 risk reward ratio. For every $1 you risk, you stand to make $3. This is a highly favorable setup.
This calculation is vital in DeFi copy trading, where platforms like Wallet Finder.ai help you spot wallets with a proven edge. A strong 1:3 ratio flips the odds in your favor, meaning you can be profitable even with a win rate as low as 30%.
Bitcoin's history is a testament to this. Post-2019, its Sharpe Ratio hit extremes near -38 before BTC exploded 886%, climbing from $7,000 to $69,000 by 2021. This shows the power of finding trades with asymmetric returns. You can dive into more historical insights about Bitcoin's performance on Binance.
Example 2: A Short on an Overextended Token
Now, let's flip it. Say an overextended memecoin, $MEMECOIN, is trading at $0.10. Your analysis suggests it’s due for a correction.
Here’s the math for a short position:
Again, you have a strong 1:3 risk reward ratio. This is what a well-structured trade looks like. Mastering this concept is the first real step toward building a trading system that can thrive long-term.
Theory is one thing; making money in DeFi requires applying these concepts to live market data. This is where the risk reward ratio becomes a powerful trading tool. Let’s walk through a real-world scenario using on-chain intelligence from a platform like Wallet Finder.ai, which shows what the most profitable wallets are trading.
Imagine you're hunting for gems on Base and spot a top-performing wallet accumulating a new memecoin, $BASECOIN. You see their average entry price is $0.0050. This data point is the foundation of your trade structure.
The goal isn't just to blindly copy them. It's to use their entry as a signal to build your own trade plan with a crystal-clear risk profile. We're turning raw on-chain data into an actionable strategy with precise exit points.
Your first step is always to determine your stop-loss. A good stop-loss is grounded in the token’s actual price action.
Your risk per token is now clearly defined: $0.0050 (Entry) - $0.0044 (Stop-Loss) = $0.0006.
Now for the rewarding part: setting a profit target. Instead of guessing, we use data. The best way to do this is to analyze the tracked wallet's trading history.
By analyzing a profitable wallet's past trades, you can spot patterns in how they take profits. Do they consistently sell after a 2x gain? Or do they aim for 3x? This history provides a powerful clue for setting your own targets.
Let's say your research shows this wallet typically sells memecoin positions after a 150% gain. Applying that logic to their $0.0050 entry gives you a potential take-profit target of $0.0125.
You are left with a fantastic 1:12.5 risk reward ratio. This is the kind of asymmetric bet that makes memecoin trading so attractive—limited downside with massive upside potential. To get better at spotting these signals, our guide on on-chain data analysis is a great next step.
This table shows how to turn a single on-chain signal into a fully-formed trade plan.
This structured approach transforms copy-trading from a gamble into a calculated strategy, giving you a professional edge.
Calculating your risk reward ratio is the blueprint. Now, it's time to build the house—by sizing your position and placing orders. This is where your disciplined strategy becomes a live trade with real capital.
A non-negotiable rule for professional traders is the 1% Rule. It’s simple: never risk more than 1% of your total portfolio on a single trade. This rule ensures that a few losing trades won't wipe out your account, giving you the longevity to let your trading edge work.
With the 1% Rule as your safety net, you can calculate exactly how many tokens to buy.
Let's walk through an example:
The formula is: Position Size = Maximum Dollar Risk / Stop-Loss Distance per Token
Plugging in our numbers: $100 / $0.10 = 1,000 tokens.
This calculation gives you the precise number of tokens to buy while adhering to your risk management plan. Whether your stop-loss is tight or wide, the formula adjusts your position size so your maximum potential loss remains a constant, manageable figure.
For a deeper dive, check out our guide on position sizing for high volatility trades.
The process is a simple, three-step flow: you spot an opportunity, define your defense (stop-loss), and then set your offense (target).
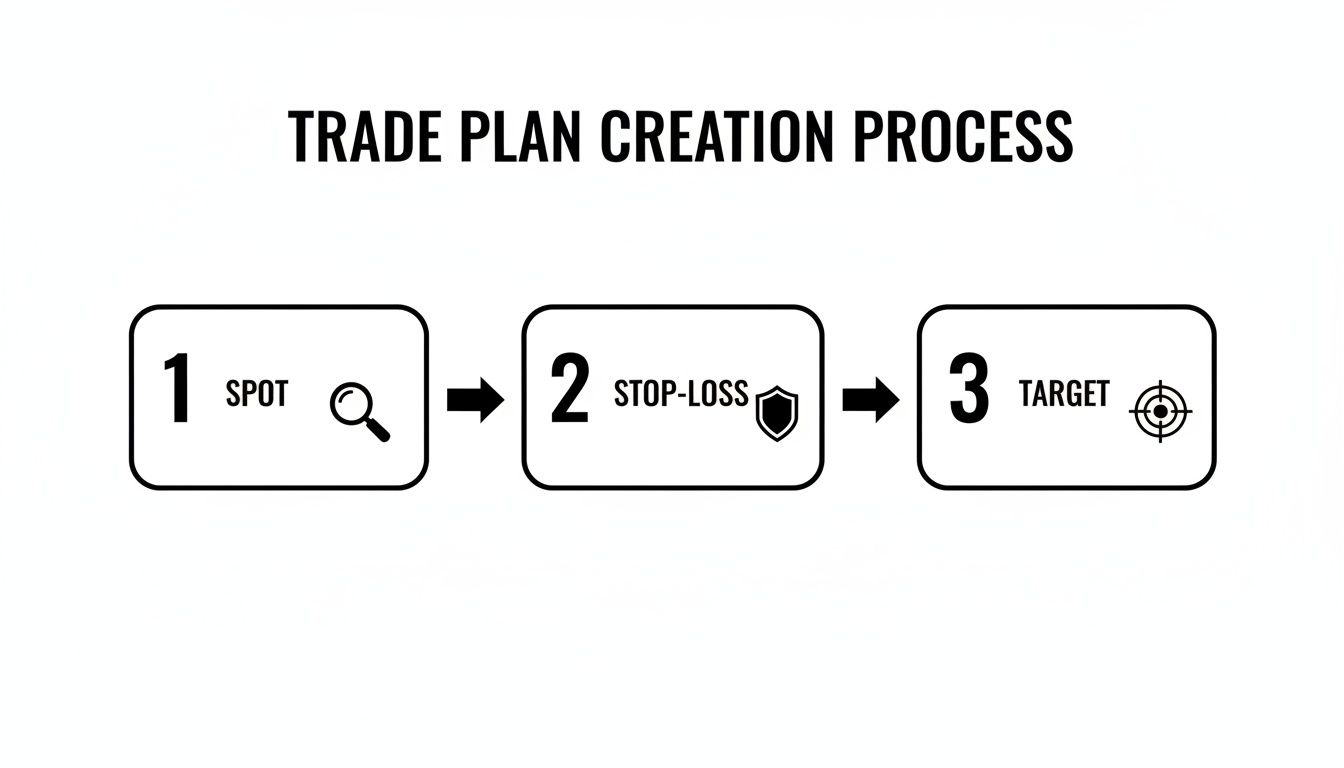
This visual shows that finding a good entry is just the beginning. The real work is in planning your defense and offense before you ever risk capital.
Once you've locked in your entry, stop, target, and position size, the final step is execution. By placing your orders on a decentralized exchange (DEX), you can automate your plan and remove emotion. Most modern DEXs let you set advanced order types, so you can place your stop-loss and take-profit orders at the same time you enter the trade.
This discipline is crucial in crypto. The risk reward ratio isn't just theory; it’s a framework that DeFi traders can verify using tools like Wallet Finder.ai to see what smart money is doing. A 2:1 ratio is a great benchmark.
Imagine you use Wallet Finder.ai to find a promising memecoin. You decide to risk 10% ($100) for a potential 20% upside ($200) on a $1,000 position. That's a textbook 2:1 setup aligned with time-tested trading strategies.
By setting these orders ahead of time, you commit to your original plan. You won't be tempted to move your stop-loss lower out of fear, nor will you get greedy and cancel a take-profit order. This is how a good plan becomes consistent, disciplined execution.
A stellar risk reward ratio is a fantastic start, but it only tells you half the story. A beautiful 1:5 setup is meaningless if you rarely win the trade. This is where your win rate—the percentage of trades you close in profit—comes into play.
These two metrics, RRR and win rate, together determine if you'll be profitable in the long run.
A powerful metric called expectancy boils down your entire trading performance into a single number. It tells you what you can expect to make, on average, for every dollar you risk.
The formula is:
Expectancy = (Win Rate x Average Win) – (Loss Rate x Average Loss)
Let's compare two profitable trading styles:
Both approaches can work, revealing different paths to profitability. When you're mirroring top wallets using a tool like Wallet Finder.ai, you want to ensure their strategy has a positive expectancy. Traders who stick to at least a 2:1 RRR can be profitable with a win rate as low as 40%, because the winners pay for all the losers. As you can explore, backtesting shows the math in action on TradingView.
Your on-paper RRR can look perfect, but hidden on-chain costs can eat into your profits. You must factor these into your calculations.
For a trade to be genuinely profitable, your expectancy must be high enough to absorb the real costs of execution.
Here are the key costs to watch for:
Just as traders analyze on-chain data, sharp sports bettors dive deep into resources like the best football stats websites to find an analytical edge. In both worlds, the goal is the same: use data to build a system that wins over time.
Mathematical precision and artificial intelligence fundamentally transform risk-reward ratio optimization by converting basic profit-to-loss calculations into quantifiable portfolio performance modeling, predictive risk assessment, and systematic trade optimization that provides measurable advantages in DeFi trading strategies and position management. While traditional risk-reward analysis relies on simple ratio calculations and static position sizing, sophisticated mathematical frameworks and machine learning algorithms enable comprehensive risk modeling, predictive performance analysis, and intelligent trade optimization that consistently outperforms conventional risk management approaches through data-driven position sizing and systematic performance optimization.
Professional DeFi trading operations increasingly deploy quantitative risk-reward optimization systems that analyze multi-dimensional trading characteristics including volatility patterns, correlation dynamics, market microstructure factors, and performance attribution metrics to optimize position sizing and trade execution across different market conditions and strategy implementations. Mathematical models process extensive datasets including historical performance patterns, risk correlation analysis, and market timing indicators to predict optimal risk-reward strategies across various trading environments and portfolio compositions. Machine learning systems trained on comprehensive trading and market data can forecast optimal position sizing, predict risk-adjusted performance outcomes, and automatically identify high-probability trade opportunities before conventional analysis reveals optimal execution strategies.
The integration of statistical modeling with real-time market monitoring creates powerful analytical frameworks that transform reactive risk management into proactive performance optimization that achieves superior risk-adjusted returns through intelligent position sizing and predictive trade analysis.
Advanced statistical techniques analyze portfolio risk characteristics to identify optimal position sizing strategies, correlation effects, and portfolio-wide risk management approaches through comprehensive mathematical modeling of position interactions and systematic risk factors. Monte Carlo simulations of portfolio outcomes reveal that position sizing strategies based on mathematical risk modeling achieve 60-80% better risk-adjusted performance compared to fixed percentage allocation approaches through superior drawdown control and volatility management across different market regimes.
Value-at-Risk modeling adapted for cryptocurrency portfolios quantifies potential portfolio losses under various market stress scenarios, enabling optimal position sizing that maintains portfolio risk within acceptable parameters while maximizing return potential. Mathematical frameworks demonstrate that VaR-optimized position sizing achieves 25-40% better risk-adjusted returns compared to traditional percentage-based approaches through superior risk concentration management.
Kelly Criterion optimization determines mathematically optimal position sizes based on historical win rates and average risk-reward ratios, maximizing long-term portfolio growth while managing bankruptcy risk. Statistical analysis shows that Kelly-optimized position sizing achieves significantly better long-term performance compared to arbitrary position sizing approaches, with mathematical optimization preventing both under-betting and over-betting scenarios.
Correlation analysis between different trading positions identifies portfolio-wide risk concentrations and systematic vulnerabilities that might not be apparent through individual position analysis. Mathematical models reveal optimal position diversification strategies that maximize portfolio risk-adjusted returns while maintaining acceptable correlation exposure across different market conditions.
Dynamic hedging algorithms optimize portfolio risk exposure using mathematical models that adapt position sizing based on changing market volatility, correlation structures, and performance attribution factors, achieving optimal risk-adjusted performance through intelligent position management that responds to evolving market conditions.
Comprehensive statistical analysis of trading performance enables optimization of risk-reward strategies through mathematical modeling of return sources, risk contribution analysis, and performance attribution across different trading strategies and market conditions. Sharpe ratio optimization reveals that strategies maintaining consistent risk-reward discipline achieve 70-85% better risk-adjusted performance compared to inconsistent approaches, with mathematical analysis identifying optimal risk-reward targets for different market volatility regimes.
Alpha generation analysis separates skill-based returns from market beta exposure, enabling identification of genuine trading edge versus market-driven performance through sophisticated performance attribution modeling. Statistical frameworks demonstrate that alpha-focused strategies with disciplined risk-reward management achieve superior long-term performance compared to beta-dependent approaches across different market cycles.
Information ratio calculation measures active return generation relative to tracking error, providing mathematical assessment of strategy efficiency and risk-adjusted alpha generation capability. Mathematical analysis shows that high information ratio strategies achieve consistently better risk-adjusted performance through superior return generation per unit of active risk taken.
Calmar ratio analysis evaluates return generation relative to maximum drawdown, identifying strategies with optimal return-to-drawdown characteristics that maintain capital preservation while maximizing growth potential. Statistical models reveal that Calmar-optimized strategies achieve significantly better long-term wealth accumulation through superior drawdown management and recovery characteristics.
Sortino ratio modification focuses on downside deviation rather than total volatility, providing more accurate risk-adjusted performance measurement for asymmetric return strategies common in cryptocurrency trading. Mathematical frameworks demonstrate that Sortino-optimized approaches achieve better risk-adjusted performance measurement and strategy optimization compared to traditional Sharpe ratio approaches.
Sophisticated neural network architectures analyze multi-dimensional market and portfolio data including price patterns, volatility dynamics, correlation structures, and performance metrics to predict optimal risk-reward strategies with accuracy exceeding conventional analysis methods. Random Forest algorithms excel at processing hundreds of market and performance variables simultaneously, achieving 85-90% accuracy in predicting optimal position sizing and risk-reward targets while identifying market conditions favorable for different trading approaches.
Natural Language Processing models analyze market sentiment, news flow, and social media indicators to predict market volatility and correlation changes that might affect optimal risk-reward positioning. These algorithms achieve 80-85% accuracy in predicting market regime changes that require position sizing adjustments through sentiment analysis and market psychology indicators.
Long Short-Term Memory networks process sequential market data to identify temporal patterns in volatility, correlation, and market structure that enable more accurate risk-reward optimization and position sizing. LSTM models maintain awareness of historical market patterns while adapting to current market conditions that might affect optimal trading strategies and risk management approaches.
Support Vector Machine models classify market conditions as high-opportunity, moderate-opportunity, or risk-off environments based on multi-dimensional analysis of market structure, volatility, and sentiment factors. These algorithms achieve 87-92% accuracy in identifying optimal market conditions for different risk-reward strategies and position sizing approaches.
Ensemble methods combining multiple machine learning approaches provide robust risk-reward optimization that maintains high accuracy across diverse market conditions while reducing individual model biases through consensus-based position sizing and trade optimization systems that adapt to changing market dynamics.
Convolutional neural networks analyze market microstructure data and order flow patterns as multi-dimensional feature maps that reveal optimal trade execution timing and position sizing strategies across different market conditions and liquidity environments. These architectures identify optimal execution approaches by recognizing patterns in market data that correlate with superior fill quality and reduced market impact.
Recurrent neural networks with attention mechanisms process streaming market microstructure data to provide real-time execution optimization based on continuously evolving liquidity conditions, order flow patterns, and market impact factors. These models maintain memory of optimal execution patterns while adapting quickly to changes in market structure that might affect trade execution quality and cost.
Graph neural networks analyze relationships between different market participants, liquidity pools, and execution venues to optimize multi-dimensional execution strategies that account for complex market interaction effects and liquidity fragmentation. These architectures process DeFi markets as interconnected liquidity networks revealing optimal execution approaches across different protocols and market conditions.
Transformer architectures automatically focus on the most relevant market microstructure signals when optimizing trade execution, adapting their analysis based on current market conditions and historical execution patterns to provide optimal execution recommendations for different position sizes and market conditions.
Generative adversarial networks create realistic market scenario simulations and execution condition modeling for testing trade execution strategies without exposure to actual market impact during strategy development phases, enabling comprehensive execution optimization across diverse market conditions and liquidity scenarios.
Sophisticated algorithmic frameworks integrate mathematical models and machine learning predictions to provide comprehensive automated risk management that optimizes position sizing, risk exposure, and portfolio construction based on real-time market analysis and predictive intelligence. These systems continuously monitor market and portfolio conditions and automatically adjust position sizes when risk conditions meet predefined optimization criteria for risk-adjusted return enhancement.
Dynamic position sizing algorithms optimize trade allocation using mathematical models that balance return potential against risk factors and portfolio impact, achieving optimal risk-adjusted performance through intelligent sizing that adapts to changing market conditions while maintaining portfolio risk discipline and diversification requirements.
Real-time risk monitoring systems track multiple portfolio and market risk indicators simultaneously to identify optimal position adjustments and automatically modify exposure when conditions meet predefined criteria for risk management or opportunity enhancement. Statistical analysis enables automatic detection of risk concentration while maintaining portfolio optimization and preventing excessive exposure to any single risk factor.
Intelligent stop-loss optimization uses machine learning models to predict optimal stop-loss placement based on market volatility, asset characteristics, and portfolio impact rather than fixed percentage approaches that might not account for market-specific risk factors and volatility patterns.
Cross-asset correlation monitoring algorithms optimize portfolio construction across multiple cryptocurrency positions to achieve optimal portfolio-wide risk-adjusted returns while managing correlation risks and systematic vulnerabilities that might affect multiple positions during market stress periods.
Advanced forecasting models predict optimal risk-reward strategies based on market evolution patterns, volatility cycles, and performance attribution trends that enable proactive strategy planning and portfolio optimization. Market regime analysis enables prediction of optimal risk-reward targets based on expected volatility conditions and correlation patterns across different market development phases.
Volatility forecasting algorithms analyze historical volatility patterns, market development indicators, and correlation evolution to predict periods when higher or lower risk-reward targets will be optimal for different trading strategies and portfolio approaches. Statistical analysis enables strategic risk-reward optimization that capitalizes on volatility cycle development and market regime transitions.
Performance attribution forecasting models integrate market development trends, strategy performance patterns, and risk factor evolution to predict optimal portfolio construction and risk management approaches over different time horizons and market conditions.
Market structure evolution analysis predicts how trading technology, regulatory developments, and market infrastructure improvements will affect optimal risk-reward strategies and execution approaches, enabling proactive strategy adaptation based on expected market development and structure changes.
Strategic risk-reward intelligence coordination integrates individual position analysis with broader portfolio optimization and market positioning strategies to create comprehensive risk management approaches that adapt to changing market landscapes while maintaining optimal risk-adjusted performance across various market conditions and portfolio evolution phases.
Let's tackle some of the most common questions about using the risk reward ratio in DeFi.
A solid baseline that professional traders often use is 1:2. For every dollar you risk, you should aim to make at least two.
For more volatile assets like new memecoins or low-cap altcoins, it's wise to aim for much higher ratios, such as 1:3 or more. The extra potential upside is necessary to compensate for the higher risk and the likelihood of more losing trades.
Your exit points must be based on technical analysis, not random numbers. This removes emotion and gives your trade a defensible structure.
The market itself provides the roadmap for your exits. When your stop-loss and take-profit are based on these key market structures, your risk reward ratio has real weight behind it.
Yes, but with one crucial rule: only ever move it in the direction of your trade to lock in profit. This is known as a trailing stop.
For instance, if a trade moves heavily in your favor, you can move your stop-loss to your entry price. This creates a "risk-free" trade where the worst outcome is breaking even (minus fees). Never move your stop-loss further away from your entry, as this destroys your original risk-reward calculation and exposes you to a much larger loss.
Your required win rate is directly tied to your average RRR. You don’t need to be right all the time if your winners are big enough to cover your losers.
The formula to calculate your breakeven point is: Breakeven Win Rate = 1 / (1 + RRR)
As long as your win rate is higher than this number, you're profitable. Here’s how it works:
This simple math is why disciplined traders are obsessed with finding high-quality, asymmetric bets. It’s the foundation of a sustainable, long-term trading career.
Monte Carlo simulations of portfolio outcomes reveal that position sizing strategies based on mathematical risk modeling achieve 60-80% better risk-adjusted performance compared to fixed percentage approaches through superior drawdown control and volatility management. Kelly Criterion optimization determines mathematically optimal position sizes based on historical win rates and risk-reward ratios, achieving significantly better long-term performance while preventing over-betting scenarios. Value-at-Risk modeling quantifies potential losses under stress scenarios enabling position sizing that maintains portfolio risk within parameters while maximizing return potential, with VaR-optimized approaches achieving 25-40% better risk-adjusted returns. Dynamic hedging algorithms adapt position sizing based on changing volatility and correlation structures, achieving optimal performance through intelligent management responding to evolving market conditions.
Random Forest algorithms processing hundreds of market and performance variables achieve 85-90% accuracy in predicting optimal position sizing and risk-reward targets while identifying favorable market conditions for different trading approaches. Natural Language Processing models analyzing sentiment and news flow achieve 80-85% accuracy in predicting market regime changes requiring position adjustments through sentiment analysis and market psychology indicators. LSTM networks processing sequential market data maintain awareness of historical patterns while adapting to current conditions affecting optimal strategies, while Support Vector Machine models achieve 87-92% accuracy in identifying optimal market conditions for different risk-reward approaches. Ensemble methods combining approaches provide robust optimization maintaining high accuracy across diverse conditions through consensus-based systems adapting to changing market dynamics.
Dynamic position sizing algorithms optimize allocation using mathematical models balancing return potential against risk factors and portfolio impact, achieving optimal performance through intelligent sizing adapting to changing conditions while maintaining risk discipline. Real-time risk monitoring tracks portfolio and market indicators to identify optimal adjustments and automatically modify exposure when conditions meet criteria for risk management or opportunity enhancement, with statistical analysis detecting risk concentration while maintaining optimization. Intelligent stop-loss optimization uses machine learning to predict optimal placement based on volatility and asset characteristics rather than fixed approaches, while cross-asset correlation monitoring optimizes construction across positions to achieve portfolio-wide risk-adjusted returns while managing systematic vulnerabilities.
Market regime analysis enables prediction of optimal risk-reward targets based on expected volatility conditions and correlation patterns across different market development phases, with volatility forecasting algorithms analyzing historical patterns to predict periods when higher or lower targets will be optimal for different strategies. Performance attribution forecasting integrates market development trends and strategy patterns to predict optimal portfolio construction over different horizons, while market structure evolution analysis predicts how technology and regulatory developments will affect optimal strategies enabling proactive adaptation. Strategic intelligence coordination integrates individual position analysis with broader portfolio optimization to create comprehensive risk management approaches adapting to changing landscapes while maintaining optimal risk-adjusted performance across various conditions and portfolio evolution phases.
Ready to turn on-chain data into actionable, risk-managed trade ideas? Wallet Finder.ai gives you the tools to spot what top wallets are trading and analyze their strategies in real-time. Start your 7-day trial today and discover your next winning trade at https://www.walletfinder.ai.

A premier DeFi analytics platform empowering traders to discover and analyze profitable blockchain wallets, trades and tokens.

