
Recovery Factor Calculation for Smart Traders
Master the recovery factor calculation to measure a strategy's resilience. Learn the formula, see DeFi examples, and find top wallets with Wallet Finder.ai.

June 20, 2026


Wallet Finder
June 11, 2026
MOG is trading around $0.00000016, with recent data clustering around $1.567e-7 to $1.632e-7, and its market cap is around $63.5M based on current exchange-tracked snapshots and circulating supply. That puts mog crypto price in the familiar memecoin zone where one viral move can change the chart fast, but the bigger edge usually comes from reading wallet behavior before the crowd notices.
If you're checking MOG right now, you're probably in one of two camps. You're either wondering whether this is a dead bounce after a brutal drawdown, or you're trying to figure out whether smart traders are positioning again.
Both are fair questions. Price alone won't answer them.
For a token like MOG, the chart matters, but the chart is late. By the time retail sees a clean breakout, the best wallets have often already built positions. The traders who do well in these names usually combine basic market structure with wallet flow, exchange activity, and support-resistance discipline.
Most people landing on a "mog crypto price" search are in one of two states: they already hold MOG and want to know whether the chart is telling them something, or they have just heard the name and want to understand what they are looking at before deciding whether it deserves a position. This section is for the second group, because context shapes everything that comes after.
MOG launched in July 2023 as a community-driven meme coin with no stated utility, no venture backing, and no team with public identities. The name and the Mog the cat meme that defined its visual identity came from a specific image macro representing confident, dominant energy — the "mog" in internet culture means to outdone or outcompete someone through sheer presence. The coin took that framing and built a community around it at a moment when the meme coin ecosystem was highly competitive and most tokens with similar profiles faded within weeks of launch.
What separated MOG from that cohort was not fundamentals — by design, it had none — but staying power. The community maintained activity through periods of market indifference, and the token survived long enough to benefit from the broader meme coin rotation that accelerated in 2024. By December 2024, MOG had printed an all-time high of approximately $0.000004022, a move that took it from total obscurity to a token that momentum desks were actively watching. As CryptoNews noted in their analysis, MOG has outlasted many meme coins from its 2023 cohort, which is itself meaningful evidence that the community has some durability even in the absence of traditional utility.
The honest answer is that meme coin longevity comes from three things that have nothing to do with technology. The first is community cohesion — whether holders feel enough shared identity to keep participating during drawdowns rather than rotating to the next launch. The second is narrative stickiness — whether the original meme concept continues generating organic social content rather than requiring paid promotion to stay visible. The third is liquidity access — whether the token remains listed on accessible venues and maintains enough DEX depth to attract new participants during attention spikes.
MOG has shown some evidence of all three. The merchandise pivot that CryptoNews documented — selling physical goods to the community — was an unconventional but effective mechanism for strengthening holder identity beyond token speculation. It is not a substitute for utility in the traditional sense, but it creates a layer of community engagement that pure speculation-only meme coins rarely develop. That engagement is what has kept MOG on watchlists rather than in the archived deadcoin directories where most of its 2023 contemporaries now reside.
You open the MOG chart after a quiet weekend, see a small green candle, and the move looks meaningless at first glance. On MOG, that kind of print can still turn into a fast percentage move if a few active wallets start bidding size on-chain before the wider market notices.
What matters right now is not whether MOG looks cheap on a screenshot. What matters is whether fresh demand is showing up in the places that usually matter for this token: Uniswap flow, wallet concentration, and repeat buying from addresses that have traded memecoin rotations well before.
MOG still trades like a reflexive meme asset. Price can move hard without any change in long-term fundamentals because the actual drivers are attention, liquidity access, and how aggressively larger holders choose to add or sell. That is why I treat the headline price as a starting point, not the signal itself.
A useful MOG read starts with execution quality. If buyers are stepping in, I want to see that happen through repeated on-chain buys from the same wallets or clusters of related wallets, not just one exchange-led pop that fades within hours.
Use a MOG-specific checklist:
The edge in MOG comes from following the wallets that can shift short-term price. If a few proven traders start accumulating into weak sentiment, that is actionable. If price rises while those wallets stay flat or reduce exposure, the move is much easier to fade.
Practical rule: Do not trade MOG because the chart looks active. Trade it when you can identify the buyers, confirm where they are buying, and see that they are still holding after the first spike.
That framing keeps you out of a lot of bad entries. It also puts the focus where it belongs: on the wallets and flows that move MOG first, not the hype that shows up later.
A trader who pulled up MOG in late 2023 saw a tiny memecoin with very little structure. By December 2024, that same chart had printed an all-time high at $0.000004022 after trading around $4.61e-8 in December 2023. The move from obscurity to full breakout is the part of the MOG story that matters.
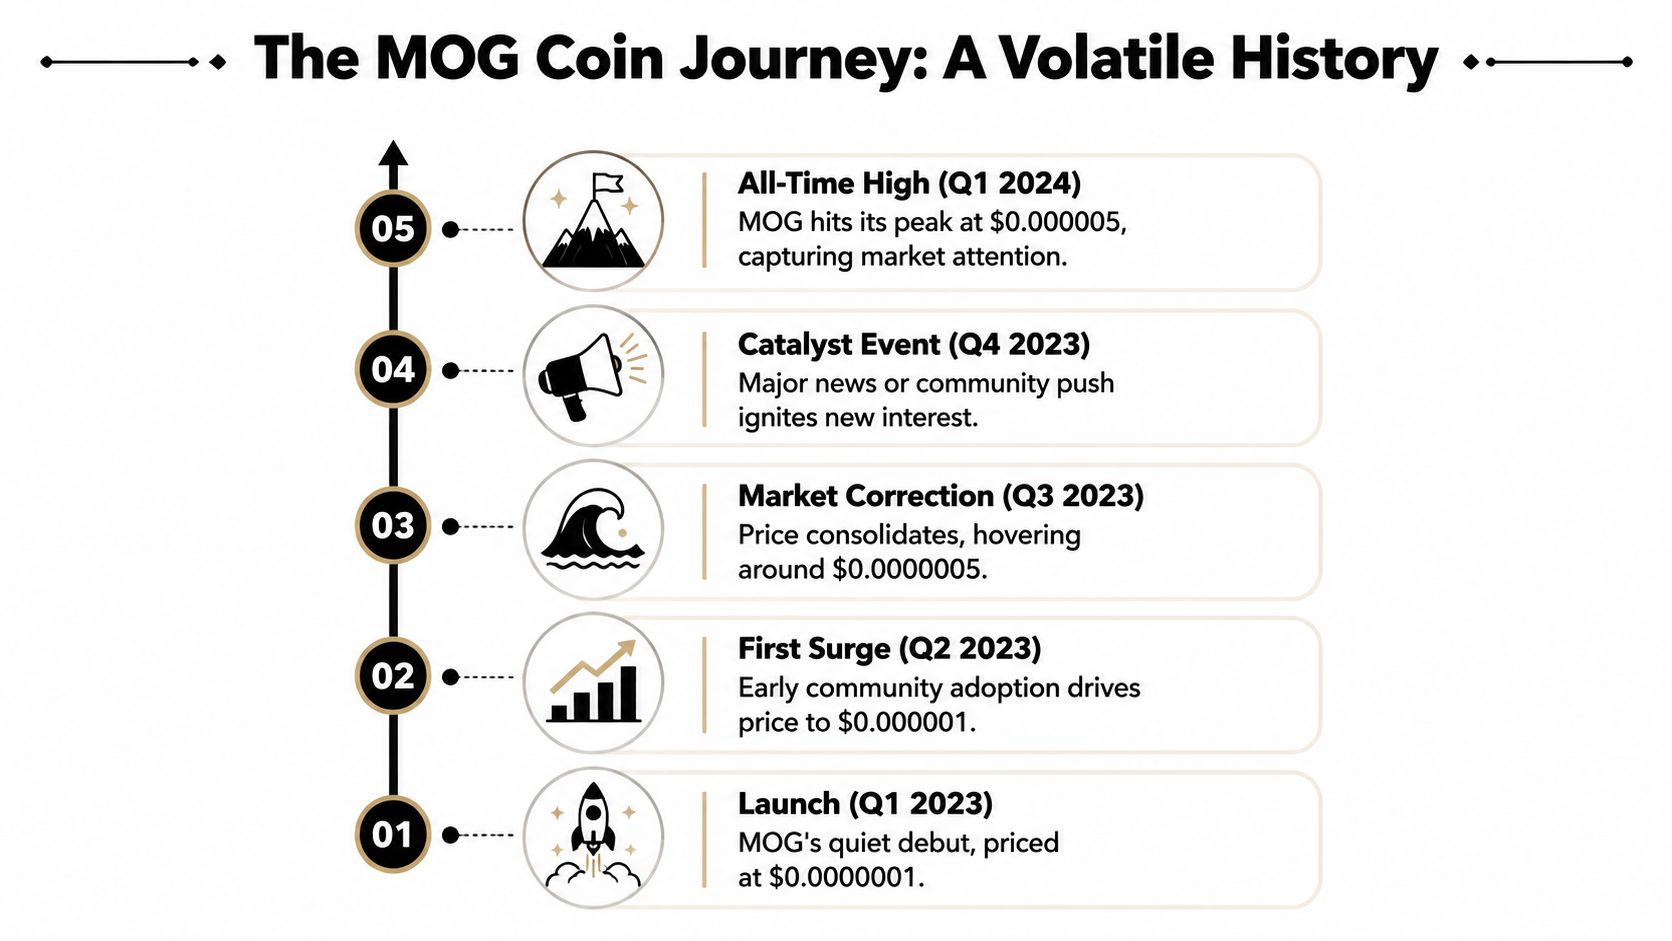
MOG launched in July 2023. Early trading was thin, price discovery was messy, and the token behaved like many new meme assets do before broader attention arrives. Then the market found a narrative. Listings, social traction, and meme rotation pulled more liquidity into the chart and turned MOG from a niche trade into a name momentum desks had to watch.
The key phase came in 2024.
MOG did not grind higher in a clean trend. It repriced in bursts. Strong upside days changed market perception fast, and that matters historically because meme traders usually respond to acceleration, not valuation. Once MOG showed it could produce outsized daily moves, it earned a place on more watchlists and stayed there.
That is the useful read on its history. MOG's breakout was not built on slow, orderly demand. It was built on attention spikes, expanding participation, and repeated momentum waves that fed on each other.
The same record also shows why the chart needs more than surface-level analysis. A token can make a huge run and still trade with violent air pockets between impulse legs. For MOG, that means the historical chart is less useful as a "belief" story and more useful as a map of how fast sentiment can reprice the market in both directions.
A few patterns stand out:
That last point is where traders usually miss the edge. The chart tells you when MOG already moved. Wallet behavior helps explain who moved it. In practice, the historical record matters most when it is paired with wallet tracking, holder rotation, and repeated buying from experienced meme traders. That is how you separate a nostalgic retest story from a setup that has real sponsorship behind it.
MOG's history is worth studying for one reason. It shows the token can go from ignored to crowded very quickly, and that kind of transition usually starts in wallets before it becomes obvious on the chart.
A workable MOG setup usually appears before the chart looks clean. The edge comes from reading how the risk profile, trend damage, and wallet participation fit together.
That matters more here than repeating headline figures from the price section.
The most useful combination is MOG's small-cap profile paired with a chart that still sits well below its long-term trend marker. Coinlore's MOG trend page shows the token trading 49.8% below its 200-day EMA, a reminder that any upside trade is still a counter-trend attempt until that gap starts closing materially, based on Coinlore's MOG forecast and trend data.
For traders, that creates a specific type of opportunity. Small meme assets can reprice fast when attention returns, but the same structure also fails fast if buyers cannot hold higher levels. In practice, this is a high-risk, high-reward reversal environment, not a clean trend-following market.
A trader does not need six metrics with equal importance. MOG is easier to frame with three questions:
That last point is where many retail traders lose time. They watch candles first and wallets second. For MOG, the order should often be reversed.
The same chart can mean two different trades.
If MOG is still under the 200-day EMA, but wallet accumulation and bid-side volume start improving, the better plan is usually a tactical trade with tight invalidation. If price reclaims higher levels and strong wallets keep adding, the trade can shift from a bounce setup into a momentum continuation.
If those pieces do not line up, standing aside is a position too.
One practical habit helps here. Set alerts around trend levels and breakout zones before MOG starts moving, then pair them with wallet tracking so price strength has a sponsor behind it. A simple crypto price alert workflow helps catch the level. Wallet behavior helps judge whether the move is worth taking.
Market lens: MOG is attractive when the chart is damaged but sponsorship starts improving. That is usually where asymmetric meme trades begin.
The most searched sub-intent behind "mog crypto price" is the prediction question: where does MOG go from here and over what timeframe. This section addresses that directly, with the models aggregated and the honest context for why the spread between them is so wide.
The 2026 prediction range across reputable models runs from deeply conservative to aggressively bullish, and the gap is so large that the range itself is the most useful information. On the conservative end, CryptoNews projects MOG reaching approximately $0.00000016 by end of 2026 — essentially flat from current levels — with their analysis noting that meme coins typically do not sustain momentum and that the absence of utility creates structural fragility. StealthEX's conservative model estimates a range between $0.000000153 and $0.00000109 for the year, suggesting limited volatility outside of sentiment spikes. On the bullish end, Telegaon's 2026 scenario places MOG between $0.00000429 and $0.00000683 — an implied return of 2,700% to 4,350% from current levels — contingent on strong meme coin hype and rapid community-driven adoption that matches or exceeds the 2024 cycle conditions.
The 3Commas technical model, which applies AI-assisted pattern recognition to historical price data, projects an average 2026 price near $0.00000051 with a range of $0.00000046 to $0.00000055. DigitalCoinPrice lands near $0.00000102 in December 2026 as its central estimate.
For 2027, CoinPedia's model suggests that if meme coin cycles return with broader market optimism, MOG could approach $0.00000154, with token burns providing an additional price catalyst if sustained. The more bullish 2027 scenarios from MEXC and similar aggregators place potential peaks near $0.0000082, though these models apply fixed growth rates to historical patterns in ways that consistently overestimate meme coin performance during periods of market indifference.
The 2030 prediction landscape is where the spread becomes almost meaningless as a precision instrument. CryptoNews projects $0.00000067 by end of decade — roughly 3x current price over four years. MEXC's bull scenario reaches $0.000042, implying 250x. Changelly's maximum 2030 estimate is $0.00004, implying 25,000% from current price. These ranges do not reflect different analytical methodologies so much as different assumptions about whether meme culture remains a capital-attracting narrative in four years — a question that no quantitative model can answer.
The prediction models are most useful not as price targets but as a framing device for position sizing and time horizon decisions. If the conservative models are right and MOG trades near current levels through 2026, a position based on price appreciation alone produces flat or negative results after accounting for opportunity cost. If the moderate models are right and MOG revisits the $0.000001 range — still well below its 2024 all-time high — the return from current levels is meaningful for appropriately sized positions. If the bullish scenarios require a repeat of 2024-level meme coin conditions that may or may not materialize, they are risk scenarios to understand rather than base cases to size around.
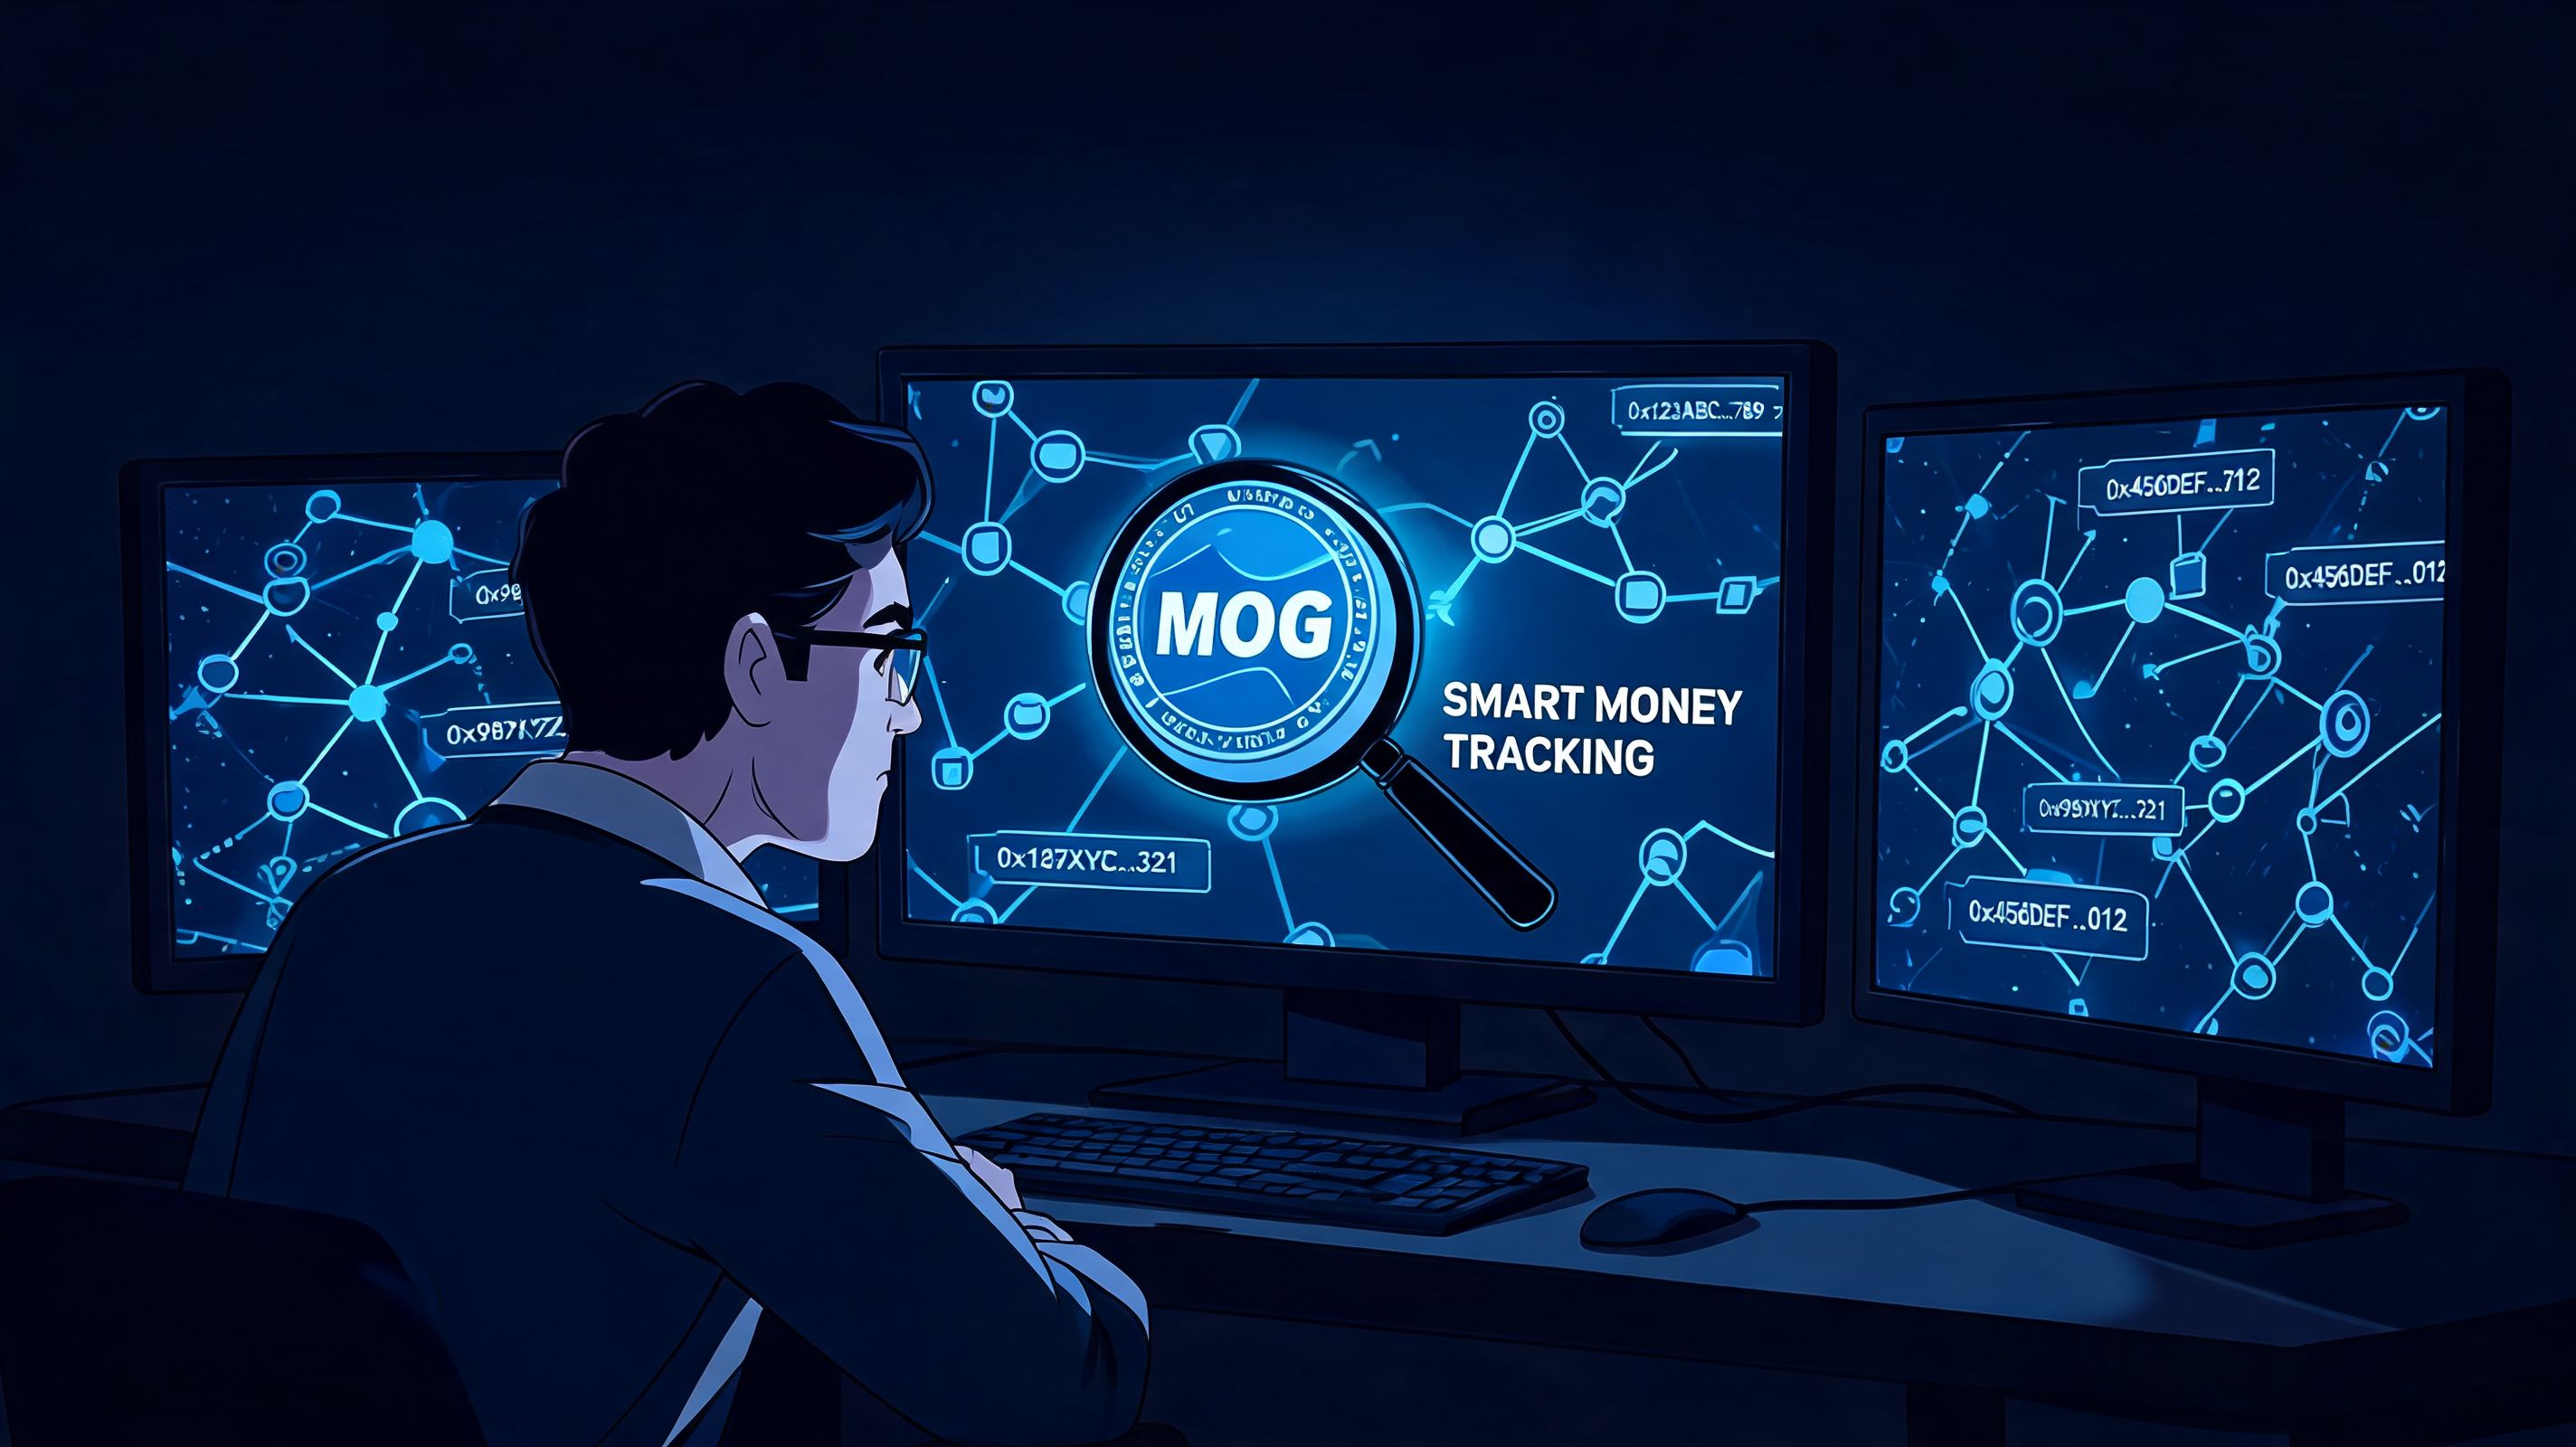
The practical trading implication is that MOG's 2026 price outcome will be determined almost entirely by whether a catalyst — a viral social moment, a broader meme coin rotation, or a new cycle of retail attention — materializes. Predicting that catalyst is not possible. Watching the on-chain signals that precede it — wallet accumulation, Uniswap flow improvements, holder count growth — is the part of the process that a prediction model cannot provide but wallet tracking can. The smart money tracking guide covers how to monitor those behavioral precursors across meme coin positions specifically.
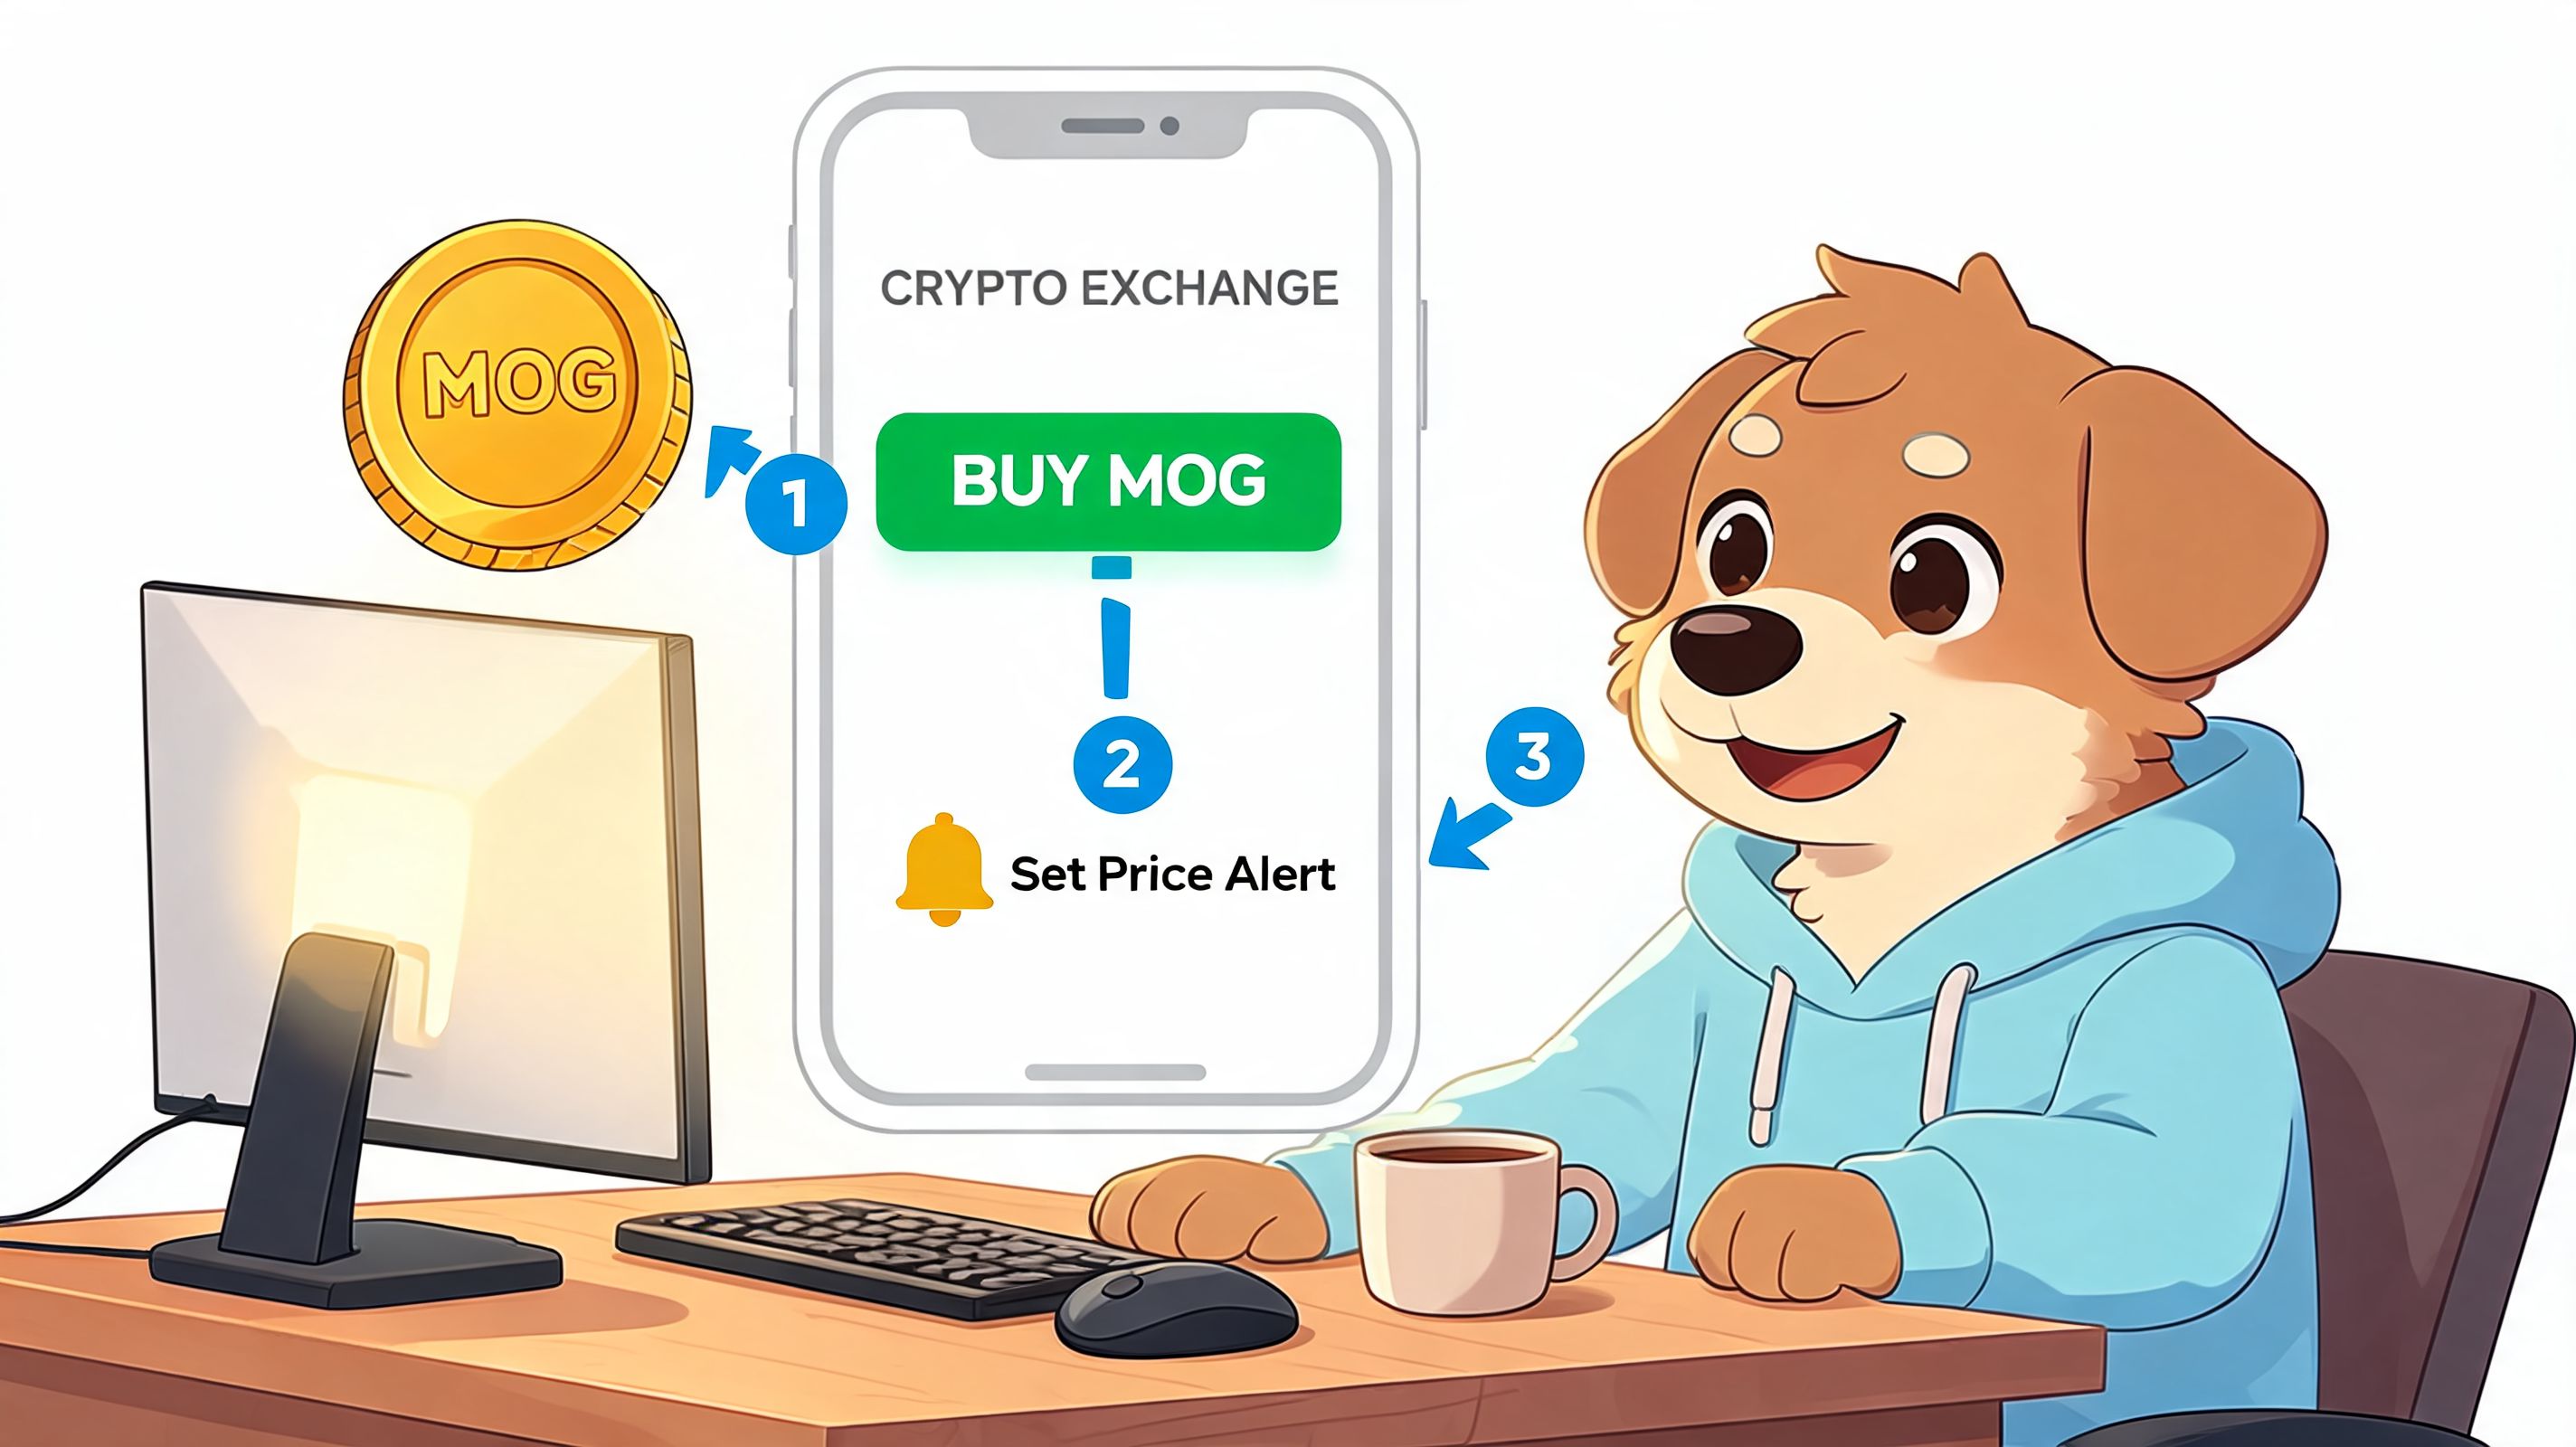
There are two practical ways to buy MOG. Use a centralized exchange if you want speed and simpler order entry. Use a decentralized exchange if you want self-custody and direct wallet control.
For most traders, this is the cleaner starting point.
This route usually works best for traders who care about execution simplicity and don't want to manage swaps manually.
Use this route if self-custody matters more to you than convenience.
Most traders wait too long to do this. If MOG is on your watchlist, alerts should already be live.
Set alerts in three layers:
If you want a cleaner process for notification setup, this guide on how crypto price alerts work is a useful operational reference.
What doesn't work is staring at the chart all day. Good traders build alert systems so they can react with a plan instead of improvising under pressure.
Most MOG price content stops at chart patterns. That's incomplete. In memecoins, wallet behavior often matters more than the visible chart because the traders who move these markets don't wait for confirmation candles.
On-chain analysis highlighted by MEXC notes a gap in typical MOG prediction coverage. It found that top MOG wallets tracked through tools like Wallet Finder.ai posted 300-500% PnL in the last year by accumulating on dips below $0.00000015 and exiting near hype peaks, as covered in MEXC's MOG market analysis.
That isn't a promise you can copy mechanically. It is evidence that wallet-level behavior can produce a clearer edge than headline sentiment.
A wallet tracker helps you answer practical questions that a normal chart can't:
Not every whale is smart money. Some big wallets are early holders with poor timing. Others are active traders with repeatable entry discipline.
Use a process, not intuition.
For traders who want a deeper framework, this explainer on smart money crypto tracking gives a solid base for evaluating wallet quality.
Execution note: The best signal usually isn't one wallet buying MOG. It's a cluster of capable wallets entering the same zone within a short period.
Many traders get sloppy at this juncture. They see a profitable wallet buy and jump in without context.
Before acting, check:
Later in your research flow, video walkthroughs can help you speed up this process without missing details.
What works with MOG is following disciplined wallet behavior at meaningful levels. What doesn't work is copying random large buys with no idea whether the buyer is entering, averaging, hedging, or preparing to distribute.
You log in after a sharp MOG bounce and price looks tempting. The better question is not who bought first. It is whether the underlying on-chain metrics support continuation or warn that the move is running into supply.
A forecast only matters if it can be checked against live market behavior. Traders Union's daily and weekly MOG outlook cites a near-term projection of $0.000000175 within four weeks, along with a "Strong Buy" signal and RSI(14) at 65.886. For traders, that forecast is only useful if on-chain metrics confirm that holders are not sending size into likely sell venues and ownership is not becoming more fragile as price rises.
Net exchange flow measures whether more MOG is moving onto exchanges or off them over a given period. This is a supply metric, not a wallet-quality metric.
A positive net flow usually raises the chance of near-term sell pressure, especially after a fast upside move. A negative net flow often supports price better because fewer tokens are sitting where they can be sold immediately. In practice, I treat this as a pressure gauge. If MOG is reclaiming a level while exchange inflows stay muted, the move has a better base than a bounce fueled only by social momentum.
Holder distribution shows how much supply sits with small, mid-sized, and large holders. For MOG, this matters because concentrated ownership can distort price discovery fast.
Watch the change, not just the snapshot:
This metric helps answer a simple trading question. Is the market broadening, or is it becoming easier for a few holders to move price?
Active addresses and daily transfer count help separate real participation from a dead-cat bounce. If price rises while address activity and transfers stay flat, the move is often thinner than it looks. If both expand with price, market interest is usually broadening.
That does not guarantee continuation. It does tell you that more participants are engaging with the token, which tends to matter more for MOG than isolated chart breakouts.
If you want a clearer framework for reading metrics like these, this guide to crypto on-chain analysis covers the core signals in a practical way.
Older coins moving after long inactivity can change the tone of a market. Dormant supply waking up into strength often deserves respect because long-held tokens can become fresh overhead supply.
For MOG, I pay close attention when older holdings begin moving during a rally but price stops expanding. That combination can mark distribution from patient holders into late buyers, even when the chart still looks constructive.
The cleanest MOG setups tend to show agreement across measurable conditions, not just one attractive print.
That is the distinction that matters here. The previous section focused on which wallets deserve attention. This section is about which measurable conditions make a MOG move stronger, weaker, or more fragile before you put risk on.
MOG is still the kind of asset that can move hard and fast. That's the attraction, and it's also the trap. Traders who treat mog crypto price as just another chart usually end up entering too late, sizing too large, or holding through conditions they never properly assessed.
A better approach is narrower and more disciplined. Start with the current market context. Respect the long-term weakness while the chart remains below key macro trend markers. Use support and resistance to plan entries. Then do the part most traders skip. Check who is active on-chain.
That's where the edge tends to show up in memecoins. Price tells you what already happened. Wallet behavior often tells you what skilled traders are trying to do next.
The practical lesson isn't that every smart-money move should be copied. It isn't. The lesson is that wallet activity gives you timing, context, and intent that ordinary chart reading often misses.
MOG is a community-driven meme coin that launched in July 2023 on Ethereum. It has no formal utility layer, no venture backing, and no publicly identified founding team — which is common for meme coins built on cultural identity rather than technology. What makes MOG stand out from the majority of its 2023 cohort is survival. Most meme coins launched in the same window have since gone to zero or near zero. MOG has maintained community activity, DEX liquidity, and holder engagement across multiple market cycles, which is a meaningful form of legitimacy even without a roadmap or whitepaper. It is not a project in the traditional sense. It is a community asset whose value tracks attention, sentiment, and the behavior of the wallets driving it.
MOG is currently trading around $0.00000016, with recent data showing a range between approximately $1.567e-7 and $1.632e-7. Its market cap sits near $63.5 million based on current circulating supply and exchange-tracked pricing. Because MOG trades on both centralized exchanges and decentralized venues like Uniswap, the quoted price can vary slightly depending on where you check. CoinGecko and CoinMarketCap aggregate across sources and typically provide the most reliable current reference. For a token at this price level, percentage moves matter far more than the nominal number — a 30% move in either direction can happen within hours during periods of active wallet flow, so checking the date on any quote you find is as important as the number itself.
The $0.000001 level represents roughly a 6x move from current prices and sits within the moderate forecast range from models like DigitalCoinPrice, which targets approximately $0.00000102 by December 2026, and PricePrediction.net, which puts its average near $0.00000092. Reaching that level is plausible if a broader meme coin rotation materializes in the second half of 2026, if Bitcoin dominance begins to decline and capital flows into higher-beta assets, and if MOG specifically attracts social attention at a moment when it has enough DEX liquidity to absorb inflows without immediately collapsing. It is not a base case — it is an outcome that requires several favorable conditions aligning simultaneously. Conservative models from CryptoNews suggest MOG stays near current levels through year-end without a major catalyst. As always with meme coins, the difference between flat and 6x in 2026 will be determined by wallet behavior and sentiment long before any price chart makes it obvious.
The most reliable early signal for MOG accumulation is Uniswap flow analysis — specifically, repeated buy transactions from the same wallet addresses or a cluster of related addresses over several days rather than a single large print. A single large buy from an unknown address can mean anything. Repeated smaller buys from the same wallet across multiple sessions, from an address with a documented profitable track record in prior meme coin rotations, is a meaningfully different signal. The practical workflow is to identify the addresses making early entries, run them through a wallet analytics tool to check their historical performance across other meme tokens, and assess whether their current MOG behavior matches the patterns they showed before prior winning trades. Wallet Finder.ai surfaces this kind of behavioral data across Ethereum and other chains, letting you filter by win rate, trade consistency, and entry timing so you are tracking the wallets most likely to be moving in advance of a price reaction rather than reacting to one that already happened.
MOG sits firmly in the high-risk, high-reward category — which is not the same as either a good or a bad investment, but a specific risk profile that needs to match the trader's approach and position sizing before any allocation makes sense. For traders who understand meme coin mechanics, who can size positions as a small percentage of their overall portfolio, who have a defined invalidation level before entering, and who are monitoring the wallet activity behind the token rather than relying on social media for their edge — MOG offers the kind of asymmetric opportunity that concentrated, community-driven tokens can provide during attention cycles. For traders who are not actively watching the on-chain signals, who would hold through a 60% drawdown without a plan, or who are allocating based on prediction model targets they found in an article — the risk profile is not well suited to the asset. The honest answer is that whether MOG is a good investment in 2026 depends less on the token and more on the discipline and process of the person holding it.
If you're going to trade MOG in 2026, keep the process tight. Wait for defined zones. Use alerts. Track wallet clusters instead of isolated prints. Reduce size when structure is unclear. Press only when technicals and on-chain behavior line up.
If you want to turn that process into something repeatable, Wallet Finder.ai helps you track profitable wallets, monitor trades across major chains, and spot smart-money behavior before it becomes obvious on the chart. For MOG and other fast-moving meme coins, that kind of visibility can make the difference between chasing moves and preparing for them.

A premier DeFi analytics platform empowering traders to discover and analyze profitable blockchain wallets, trades and tokens.

