Recovery Factor Calculation for Smart Traders
Master the recovery factor calculation to measure a strategy's resilience. Learn the formula, see DeFi examples, and find top wallets with Wallet Finder.ai.

June 20, 2026
Wallet Finder

July 11, 2026

You've seen this on a chart. A token drifts sideways, volume feels sleepy, and then a few wallets start buying. Price lifts. More traders notice. Slippage worsens, candles stretch, and what looked random suddenly has direction.
Most traders describe that move with loose language. “Strength.” “Narrative.” “Smart money.” Those labels aren't useless, but they often blur the fundamental question. What changed the motion?
Physics gives a cleaner way to think about it. Not as a literal market equation, and not as a promise that price behaves like a billiard ball. It's a mental model. Momentum and impulse help you separate steady movement from the event that caused the movement to change.
That distinction matters in DeFi. If you can tell the difference between ongoing trend and the shove that started it, you stop chasing every candle and start asking better questions about wallets, flows, liquidity, and timing.
A lot of bad trading comes from reacting to the visible move instead of the cause behind it. You see a token rip higher and assume the move itself is the signal. Often it isn't. The signal was earlier, hidden in who bought, how quickly they bought, and whether the market could absorb that pressure.
Physics is useful here because it forces clean thinking. An object in motion doesn't change course for no reason. Something acts on it. In markets, price doesn't explode upward just because a chart “looked ready.” Traders, funds, bots, token releases, liquidations, governance news, bridge flows, and whale entries create the push.
Say you're watching a mid-cap DeFi token. It's been quiet for days. Then buys start clustering across a short window. Liquidity on one pool thins out. Market makers reprice. Momentum builds, and now social feeds call it a breakout.
By the time most traders label the trend, the important event has already happened.
Trading lens: Don't ask only, “Is this moving?” Ask, “What applied the push, and is that push still active?”
That's where the physics analogy earns its keep. It helps you think in two layers:
In DeFi, that means one move can come from very different conditions. A slow grind upward might reflect broad, steady accumulation. A sharp jump might come from a concentrated burst of buying, a short squeeze, or a fast repricing after a catalyst.
Charts show the aftermath. On-chain data often shows the shove.
If you track wallet behavior, transaction clustering, and liquidity conditions, you start spotting potential impulses before they fully show up as trend strength. That doesn't remove risk. It sharpens timing and interpretation.
Here's the practical benefit:
That last point matters most. In physics, a tiny object can move fast without carrying much momentum. In markets, a thin token can print dramatic candles without building durable trend. Price speed alone doesn't tell you how meaningful the move is.
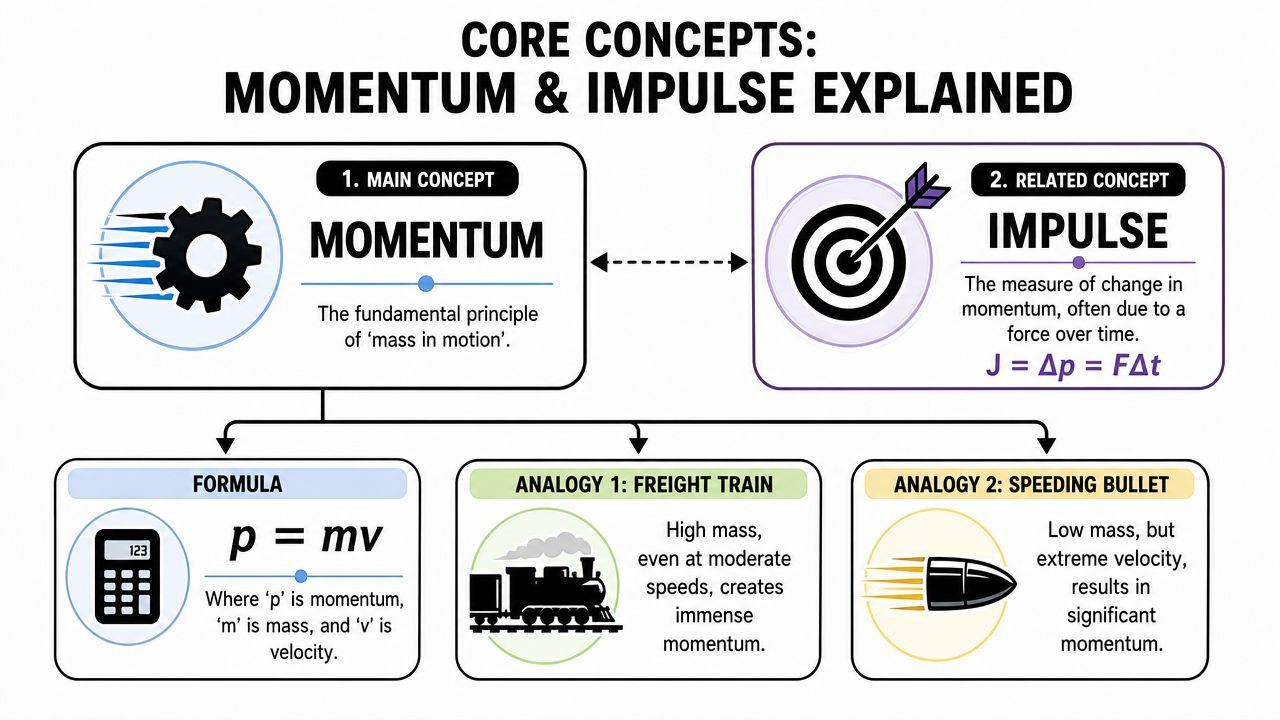
Physics defines momentum as:
p = mv
That reads as momentum equals mass times velocity. In plain language, momentum is mass in motion. The more mass something has, or the faster it moves, the harder it is to stop or redirect.
A freight train and a bicycle can both move forward. But if they're moving at the same speed, the train carries far more momentum because it has far more mass. A small object can also have meaningful momentum if it moves very fast. So momentum isn't just “big things move hard.” It combines how much stuff there is and how fast it's moving.
Many learners hear the formula and stop there. Don't. The concept matters more than the symbols.
Momentum answers a practical question: How difficult is it to change this motion? A heavier object moving steadily resists change. A lighter object moving slowly is easier to stop, start, or redirect.
Two details trip people up:
So momentum isn't just “how fast.” It includes direction and resistance to change.
Now add impulse. Physics defines it as:
J = FΔt
That means impulse equals force multiplied by the time that force acts. A hard shove over a short time can change motion. So can a gentler shove applied for longer.
This is why catching a ball with “soft hands” hurts less than stopping it rigidly. Your hands move backward with the ball, increasing the time over which the ball stops. Same overall change in momentum, lower force at any instant.
Core equation: Impulse = Change in Momentum
J = Δp
That relationship is the center of the whole topic.
If an object's momentum changes, an impulse caused it.
That's the theorem traders should remember too, because the analogy later depends on it. Motion doesn't just become different. Something acts over some span of time to make it different.
A few everyday examples help lock this in:
SituationWhat has momentumWhat provides impulseWhat changesCatching a baseballThe moving ballYour glove and handBall slows to restBraking a carThe moving carFriction from brakes and tiresCar loses forward motionKicking a soccer ballThe ball at restYour foot during contactBall gains motion
The most common confusion is mixing up force and impulse. They aren't the same thing.
A brief punch and a longer push can create similar changes in momentum if the total impulse is similar. That's why time matters.
Another common mistake is treating momentum like energy. They're related, but they answer different questions. Momentum tells you about motion and resistance to change. Energy tells you about capacity to do work.
If you keep just one mental image, use this one: momentum is the moving train, impulse is the push or brake that changes what the train is doing.
The formulas make more sense once you use them. Let's work through two simple examples. The numbers below are just teaching examples, not market claims.

Suppose a car of mass m is moving forward with velocity v. Its momentum is:
p = mv
If the driver brakes until the car stops, the final velocity is zero. So the final momentum is zero too.
The change in momentum is:
Δp = p final - p initial = 0 - mv = -mv
The negative sign tells you the momentum changed opposite to the original direction of motion. The braking system, tire friction, and road together provide the impulse.
What matters conceptually:
If the stopping happens very suddenly, the average force is larger. If the stopping happens over a longer time, the average force is smaller.
A longer stopping time doesn't change the need to remove momentum. It changes how harshly that change happens.
That's the logic behind airbags, padded gloves, and crumple zones.
Now take a ball moving toward a wall. Before impact, it has momentum in one direction. After impact, if it bounces back, the direction reverses.
That's important. A reversal means the change in momentum is larger than if the ball had stopped.
Step by step:
For many learners, the concept of direction often becomes clear. If velocity reverses, momentum reverses too. The wall doesn't just “take away” momentum. It pushes the ball into new momentum in the opposite direction.
If you trade with chart indicators, it helps to compare this to the difference between a slowdown and a reversal. A slowdown is one kind of momentum change. A reversal is stronger. If you want a trading-side parallel, this overview of momentum indicators in crypto trading is a useful companion.
Here's a quick visual explanation before we go further:
The predictable part of physics is what makes the analogy useful later.
ScenarioStarting momentumImpulse directionOutcomeCar brakingForwardBackwardMotion decreases to zeroBall bounceToward wallAway from wallMotion reverses
The big lesson isn't arithmetic. It's causal thinking. Whenever motion changes, look for the impulse. That habit transfers surprisingly well to market analysis.
The ball-and-wall example above has a physics distinction worth carrying forward, since it maps unusually well onto a question traders ask constantly: will this move reverse sharply, or will it just quietly stop?
Physics separates collisions into two broad types. An elastic collision conserves the total kinetic energy of the system, the classic bouncing-ball case, where the object rebounds with force roughly proportional to what it carried into the impact. An inelastic collision loses energy to deformation, heat, or sound, the classic case of a ball of clay hitting a wall and simply sticking there instead of bouncing back.
The market parallel is a genuine distinction, not just a metaphor. A sharp selloff into a strong support level, met by aggressive, well-capitalized buying, behaves like an elastic collision: price absorbs the impact and rebounds with force close to what drove it down in the first place. A selloff into weak, thin, or absent support behaves like an inelastic collision: price simply stops falling without any meaningful bounce, the selling pressure gets absorbed without producing a rebound, and the token often just sits there rather than reversing. Neither outcome is inherently better or worse to trade, but confusing the two, expecting an elastic bounce from what's actually an inelastic stop, is a specific, avoidable way traders lose money buying a "dip" that was never going to snap back with force.
A shaky understanding of the physics creates bad market analogies. So let's clear out a few common mistakes.
People often say an object has “a lot of momentum” when they really mean it's moving fast. Speed matters, but it's only half the story. Mass matters too.
A bowling ball rolling moderately can have more momentum than a tennis ball moving faster. If you focus only on speed, you miss why some moving objects are much harder to stop or redirect.
That's a useful warning for traders too. A fast chart move doesn't automatically mean strong underlying momentum.
These ideas get lumped together because both involve motion. They are not interchangeable.
Momentum tracks mass and velocity. Kinetic energy tracks motion in a different way and doesn't carry direction in the same sense. In practice, they answer different questions. Two objects can create the same intuition of “moving hard” while differing a lot in momentum versus energy.
Noise filter: If you're asking, “How hard is this to redirect?” think momentum. If you're asking a different question about motion's effect, you may be thinking about energy instead.
For this article, momentum is the better tool because we care about change in motion and what caused it.
That's false. A light object moving very fast can still carry substantial momentum. This is one reason the formula matters. It stops you from relying on gut feel alone.
A freight train has huge momentum because of mass. A small projectile can also have major momentum because of velocity. Different paths, same concept.
Students often picture impulse as one sudden smack. That's too narrow.
Impulse can come from a sharp impact, but it can also come from a steady force acting over a longer interval. The key is the total change in momentum produced over time.
Here's the clean version:
Many real systems don't change in one dramatic instant; rather, their evolution occurs through repeated, sustained influence.
That idea will matter when we move into markets, where one whale transaction can act like a punch, but repeated wallet accumulation can act like a sustained push.
One more physics principle extends the analogy further than most trading takes usually go: in a closed system, total momentum is conserved. It doesn't appear from nowhere and doesn't vanish. It transfers between objects.
Markets work the same way structurally, even though the analogy has to bend a little to fit. Every buy has a matching sell. For every wallet gaining exposure, another wallet, or a pool, is giving it up. What we call "market momentum" isn't force being created out of thin air. It's an imbalance in urgency and conviction between the two sides of every trade, buyers willing to pay up versus sellers willing to let go at that price.
This reframes a subtle trading mistake. Traders sometimes talk about a token "gaining momentum" as if buying pressure is summoned from nothing. In reality, a strong upward move means buyers are more urgent, more numerous, or more committed than the sellers willing to meet them at each price level, not that new force appeared unprompted. That's why watching only the buy side of a flow is incomplete. The more useful question is which side is losing conviction faster, since momentum in one direction is really the mirror image of fading resistance in the other. A cluster of aggressive buyers matters less if an equally aggressive wall of sellers is absorbing every purchase without giving ground.
Physics and markets are not the same system. Price isn't a steel ball, and traders aren't particles following fixed laws. But the analogy is still powerful because it gives you a disciplined way to read market behavior.
In physics, momentum reflects how much moving mass is already in motion. In DeFi, a trend has more “market momentum” when movement combines with enough depth, participation, and follow-through that it becomes harder to reverse quickly.

Physics ConceptDefinitionTrading AnalogueOn-Chain ExampleMassHow much matter is involvedLiquidity, market depth, committed capitalDeep pools absorb trades better than thin poolsVelocityRate and direction of motionSpeed and direction of price changeRapid upward repricing across a short windowMomentumMass in motionTrend strength with participation behind itA move that keeps extending because flows support itForcePush that affects motionCapital inflow, outflow, liquidation, catalystA cluster of large wallet buysImpulseChange in momentum over timeEvent or burst that changes trend behaviorA sudden wave of aggressive buys or sells
This framework keeps you from making a common mistake. Traders often see a price jump and call it momentum. Sometimes it's only velocity. The move is fast, but it doesn't have enough depth or support to persist.
A market impulse is any event that meaningfully changes the current motion of price or participation. In DeFi, that can include:
One transaction can matter. A sequence matters more.
The market move you can see is often less informative than the order flow you can't see at a glance.
That's why on-chain analysis is such a natural fit for this analogy. You're not only watching the candle. You're looking for the shove.
Physics has another concept worth adding to the translation table: friction, the resistive force that opposes motion and gradually removes energy from a moving object even without a single dramatic collision.
In DeFi, friction has an obvious analogue: gas fees, slippage, swap fees, and bridge costs. None of these act like an impulse, a sudden, discrete event that reverses direction. They act like friction, a constant, grinding drag that reduces the effective size of every move without ever showing up as a single visible force. A token can have genuine, well-supported momentum, real participation, real conviction, and still deliver a disappointing result to a trader whose realized return got eaten by execution costs stacked across multiple entries and exits.
This matters most for strategies built around chasing repeated impulses, frequent entries and exits designed to capture each new burst of momentum. Every additional round trip adds another dose of friction, and a strategy that looks strong on a chart showing gross price moves can look considerably weaker once gas and slippage are subtracted from each leg. For a closer look at quantifying this specific drag before you commit to a high-frequency momentum approach, this guide on the gas fee estimator covers how to estimate execution cost before it quietly erodes a strategy that looked sound on paper.
Use the model as a checklist, not as a prediction machine.
A move in a very thin market can look dramatic without being durable. Look at where liquidity sits, how easily price is moving, and whether there's enough depth to support continuation.
A single spike can be an impulse. It becomes momentum only if buying, participation, and structure keep carrying the move.
Wallet behavior matters because not all flow is equal. You care about repeat actors, coordinated timing, and whether buying continues after the first visible burst. For traders who study wallet behavior, this guide to behavior pattern recognition in on-chain trading is directly relevant.
Momentum often dies when a counterforce appears. Profit-taking by early wallets, liquidity returning to the other side, or concentrated selling can reverse the move.
You don't need to be dogmatic about one platform. Traders usually combine charting, DEX data, wallet labels, and alerting tools.
One option is Wallet Finder.ai, which tracks DeFi wallets, trades, and tokens across major chains so users can monitor wallet activity, review trading histories, and set alerts around buy and sell behavior. In this framework, tools like that help surface possible market impulses before they're obvious on a plain price chart.
The value of momentum and impulse isn't that it turns markets into physics homework. It gives you a cleaner way to think. Instead of staring at candles and asking whether a move “feels strong,” you ask two sharper questions: What impulse just happened? and Is that impulse building real momentum or only temporary speed?
That changes how you trade DeFi. You become less impressed by isolated candles and more interested in wallet clustering, repeated buys, liquidity conditions, and whether price is moving with support behind it. You stop treating every breakout as equal.
If you want to apply that lens consistently, spend more time on wallet flow and transaction context than on social noise. A solid starting point is learning how traders use on-chain analysis for decision-making to connect transactions, timing, and price behavior.
If you want to put this mental model into practice, try Wallet Finder.ai to monitor wallet activity, spot potential market impulses, and study whether those early signals are turning into tradeable momentum.