
Recovery Factor Calculation for Smart Traders
Master the recovery factor calculation to measure a strategy's resilience. Learn the formula, see DeFi examples, and find top wallets with Wallet Finder.ai.

June 20, 2026


Wallet Finder
June 12, 2026

You buy a small-cap token, watch the chart go vertical, and your wallet suddenly shows a gain that feels life-changing. Then an important question arises: can you successfully turn that OBO position into dollars without getting clipped by slippage, bad routing, stale pricing, or a dead market?
That's the gap between paper gains and real dollars.
With lesser-known tokens, the hard part usually isn't finding a quoted price. It's finding the executable price. A screen can show green while the pool is thin, the spread is ugly, and the route to cashing out takes three separate steps. If you rush the exit, you can give back a large part of the move.
Most crypto traders already think in USD, even when they trade entirely on-chain. That's not arbitrary. The U.S. dollar remains the global benchmark for pricing and settlement, and the IMF reports it accounted for about 58% of global allocated foreign exchange reserves in 2024, according to the Federal Reserve H.10 reference page. That's why most crypto PnL gets measured in dollars, even when the trade path runs through tokens, stables, and multiple chains.
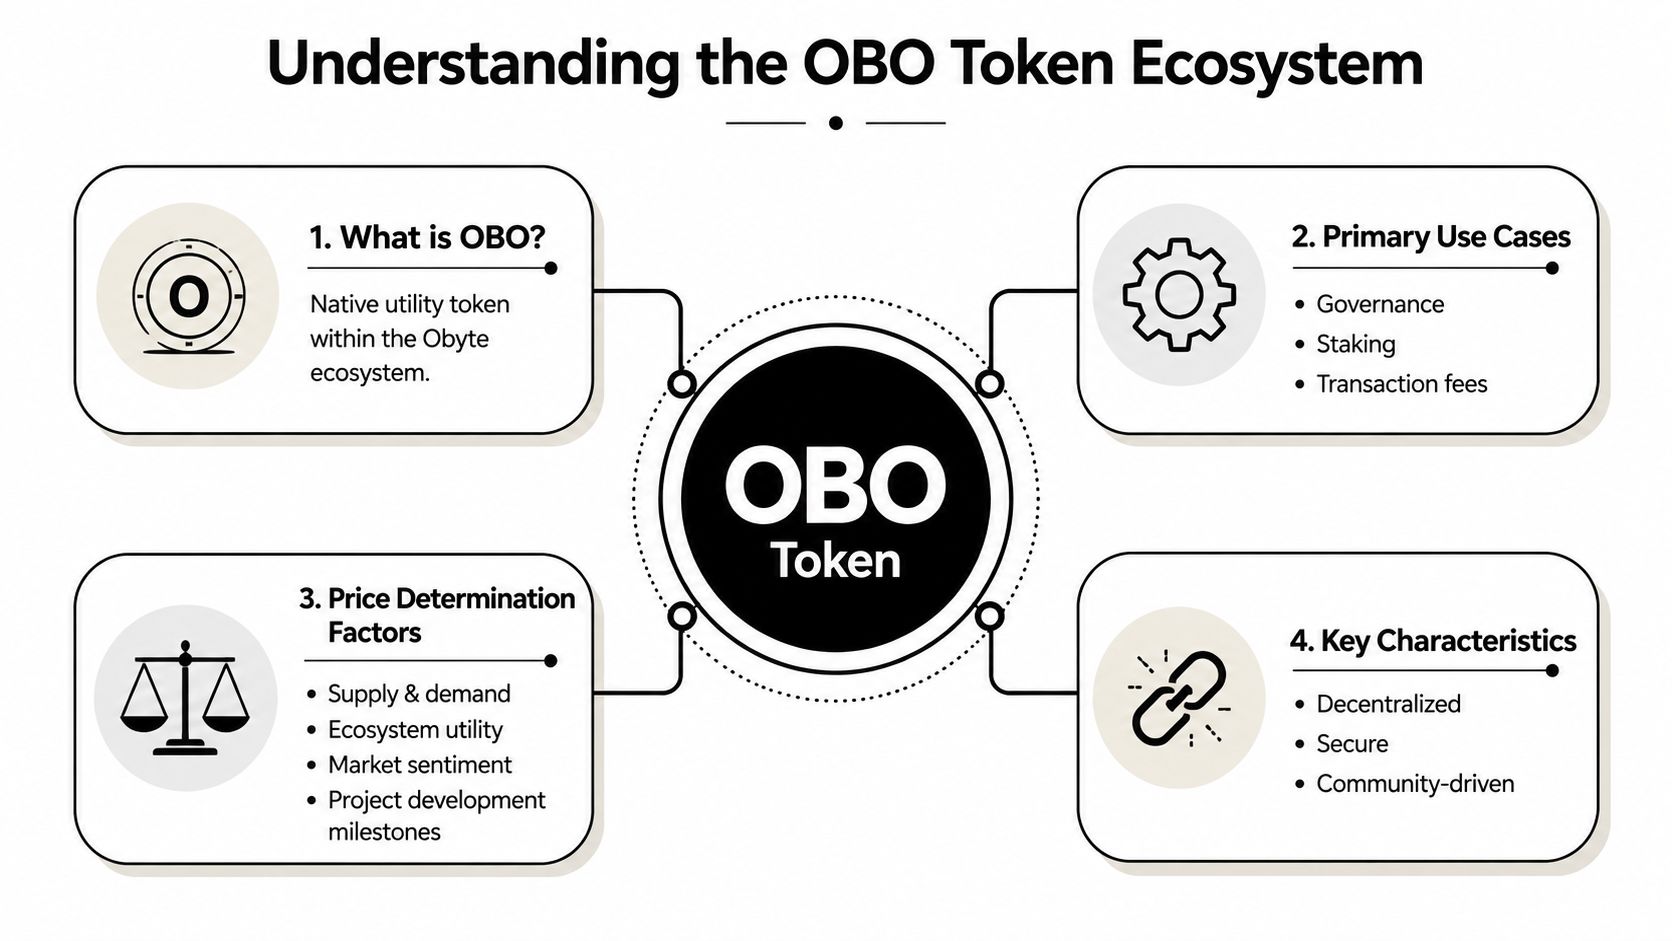
For OBO, that matters even more because smaller assets don't always have clean direct exits. You may see a token quote in a wallet or on an explorer, but that doesn't mean a real buyer is there at size. A practical OBO to USD process starts with identity, then liquidity, then execution.
Practical rule: Don't ask “What is OBO worth?” Ask “What can I sell right now, on this route, after fees?”
The cash-out process is usually one of two things. Either you have a direct exchange listing with enough depth, or you need to unwind in stages, usually from OBO into a stablecoin and then from the stablecoin into bank-withdrawable USD.
That sounds simple. In practice, it's where most mistakes happen:
If you handle those four problems well, OBO to USD becomes manageable. If you ignore them, the chart can be right and the trade can still go wrong.
The first job is basic, but traders skip it all the time. You need to confirm which OBO you own or plan to trade. With obscure tickers, symbol matching is not enough. Contract address is what matters.
CoinBrain lists one OBO at $0.0051, while LiveCoinWatch lists Obolo at $0.000189 and notes the market data was last traded in 2023-02-17, which is why the CoinBrain OBO converter page is useful as a warning, not just a quote source. The same ticker can point to different assets or stale markets.
Before checking any OBO to USD quote, confirm these items:
A lot of losses happen before the trade even starts. Traders search a ticker, click the first result, and route into the wrong asset. That's not market risk. That's process failure.
For smaller tokens, price depends less on “fair value” and more on where liquidity sits.
On a DEX, OBO is usually priced through an automated market maker pool. The quote changes as users buy or sell against the pool. If liquidity is shallow, your own sell order can push the price down while the trade is filling.
On a CEX, price comes from an order book. Buyers and sellers place bids and asks. If there's enough depth, you get cleaner execution. If depth is weak, the book can look tradable until your order starts eating through levels.
Thin markets punish certainty. The quote looks precise, but the execution often isn't.
What works:
What doesn't:
If you only remember one thing here, remember this: for OBO to USD, token identity comes before token price.
A useful OBO to USD quote has two layers. First, the reference price. Second, the executable price. Most traders look at the first and ignore the second.
Reference price is fine for orientation. Executable price is what matters when you're about to sell.
A practical workflow looks like this:
If the token is thinly traded, the quote you want is the one tied to your intended size, not the smallest visible trade.
A clean way to think about it is this:
| Check Type | What It Tells You | What It Misses |
|---|---|---|
| Listed token price | General market reference | Slippage, route quality, stale liquidity |
| Wallet portfolio value | Rough mark-to-market value | Real exit amount |
| DEX aggregator quote | Estimated executable output | Final result can still change before confirmation |
| CEX order book | Immediate tradable levels | Transfer delays and withdrawal frictions |
Spot pricing can fool you because it compresses the whole market into one number. Historical context helps you see whether current price action is stable, stretched, or just erratic.
Reliable USD valuation is built on deeper time series. The OFX overview of historical exchange-rate data notes that OANDA offers up to 31 years of historical rates across 200+ currencies, and OFX publishes more than 20 years of historical exchange-rate data. For crypto traders, the point isn't to compare OBO to fiat pairs directly. The point is that serious valuation always uses range, history, and context, not a single print.
That same mindset helps with tokens. Look at the recent trading pattern, not just the last trade.
For traders building dashboards or monitoring multiple positions, Wallet Finder.ai's article on a crypto price API is a useful reference for structuring price workflows around live data instead of manual tab-hopping.
The price you can realize is always more important than the price you can screenshot.
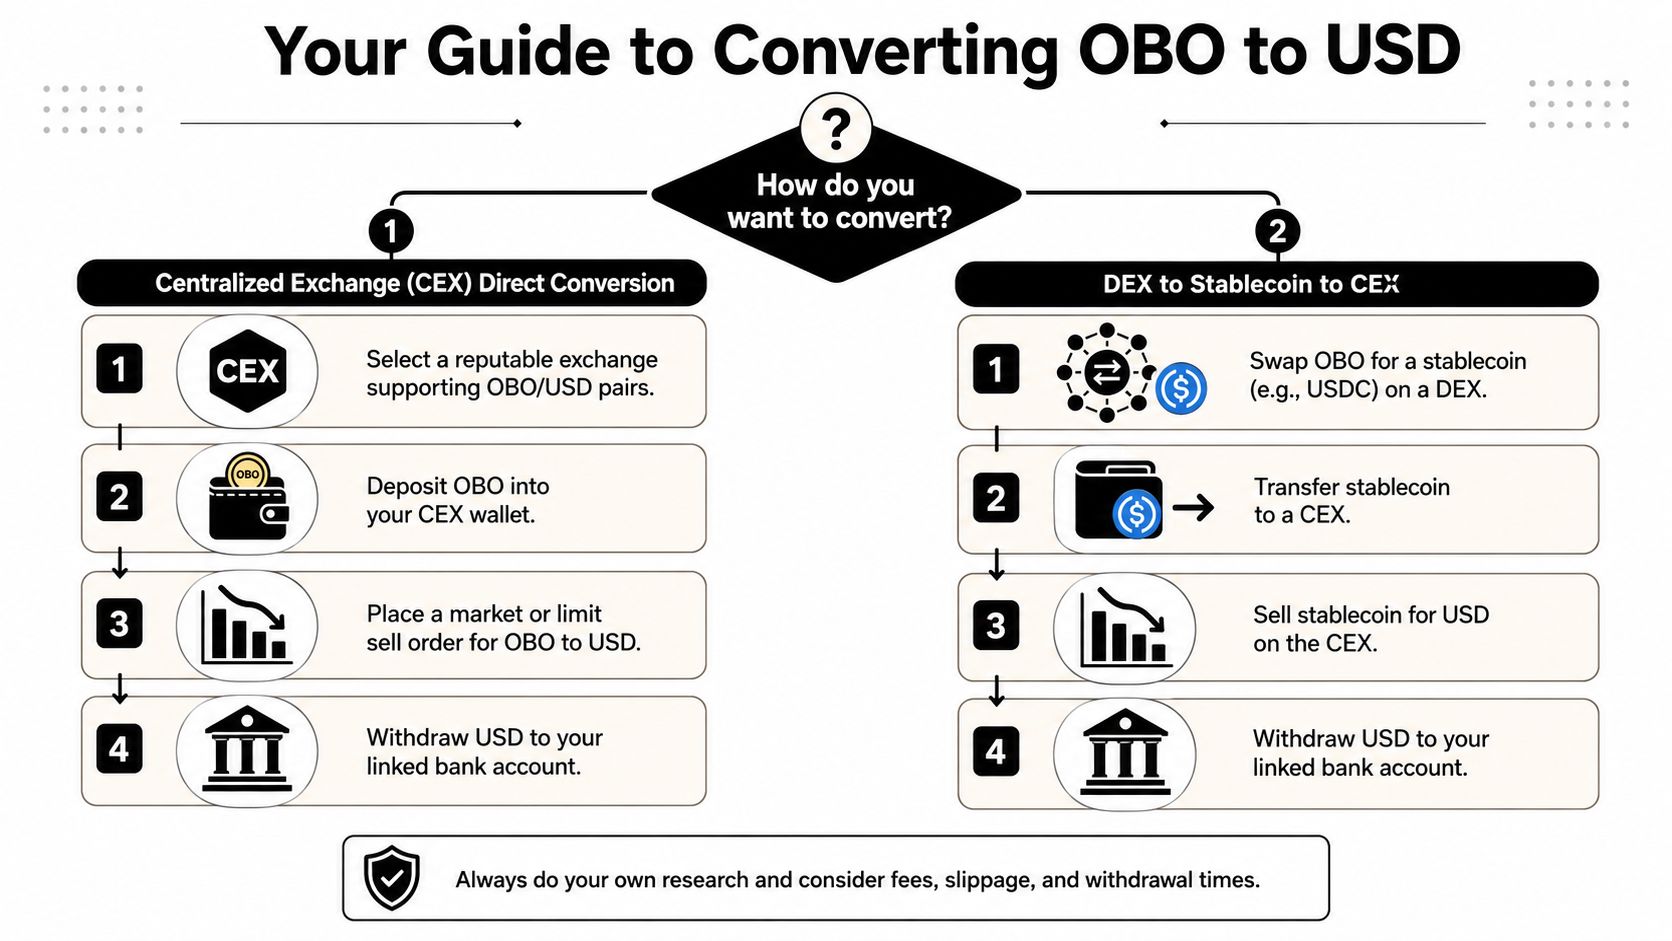
There are two main paths. One is direct and simple if the market exists. The other is more common for small tokens and requires an intermediate stablecoin.
| Method | Speed | Typical Fees | Control/Privacy | Best For |
|---|---|---|---|---|
| Direct sale on a CEX | Fast if listed and funded | Trading fee plus withdrawal-related costs | Lower privacy, more platform dependence | Traders who already use a compliant exchange |
| DEX to stablecoin to CEX | Slower because it has more steps | Network fees, swap fees, then exchange-related costs | Higher wallet control until the fiat off-ramp step | Smaller tokens without a direct USD market |
| DEX plus bridge plus CEX | Slowest and most operationally complex | Adds bridge-related costs and more execution risk | Good wallet control, but more moving parts | Tokens on less-connected chains |
If a real OBO market exists on a centralized exchange, this is usually the least operationally messy route.
This route works well when the exchange has real depth and your account is already verified. It works badly when the exchange supports the ticker but not the exact network you're using.
This is the route most DeFi traders use.
Open a DEX or DEX aggregator on the correct network and simulate the trade. Don't just check the top-line price. Review route details, expected output, and slippage tolerance.
Then:
Once you hold a major stablecoin, transfer it to a centralized exchange that supports fiat withdrawal for that asset and network.
A few practical habits help here:
After the stablecoin arrives:
If the direct OBO market is weak, break the trade into the most liquid path available instead of insisting on a one-click exit.
Some OBO positions live on networks that don't connect cleanly to your preferred off-ramp. In that case, you may need to bridge either OBO or the stablecoin after the initial swap.
That route can work, but every extra step adds a failure point:
If a token is already difficult to price, simplicity beats creativity. The cleanest cash-out path is usually the best one.
A trade isn't finished when the token leaves your wallet. It's finished when you know what you realized in USD after fees.
The distinction is simple:
Use this:
Realized PnL = Total USD received from sale - Total USD cost basis - Total fees paid
That last part matters. Gas, swap costs, bridge costs, and exchange fees all reduce real profit. Ignoring them is how traders overstate wins.
Suppose you bought 10,000 OBO for $100. Later, you sell the full position and receive $500. Across the round trip, you paid $20 in gas and related transaction costs.
The math is:
So your realized PnL is:
$500 - $100 - $20 = $380
That's your net realized profit.
This sounds obvious, but many traders still log the gain as $400 because they subtract entry cost and ignore execution costs. In DeFi, that mistake adds up fast.
After an OBO to USD exit, save:
If you want a deeper framework for tracking closed trades, Wallet Finder.ai has a concise guide to realized profit and loss explaining the accounting side in more detail.
A good journal doesn't just help at tax time. It helps you see whether your exits are efficient, or whether fees keep eating more of the move than you think.
Small-cap exits fail in predictable ways. The mechanics are straightforward. The execution discipline is where traders slip.
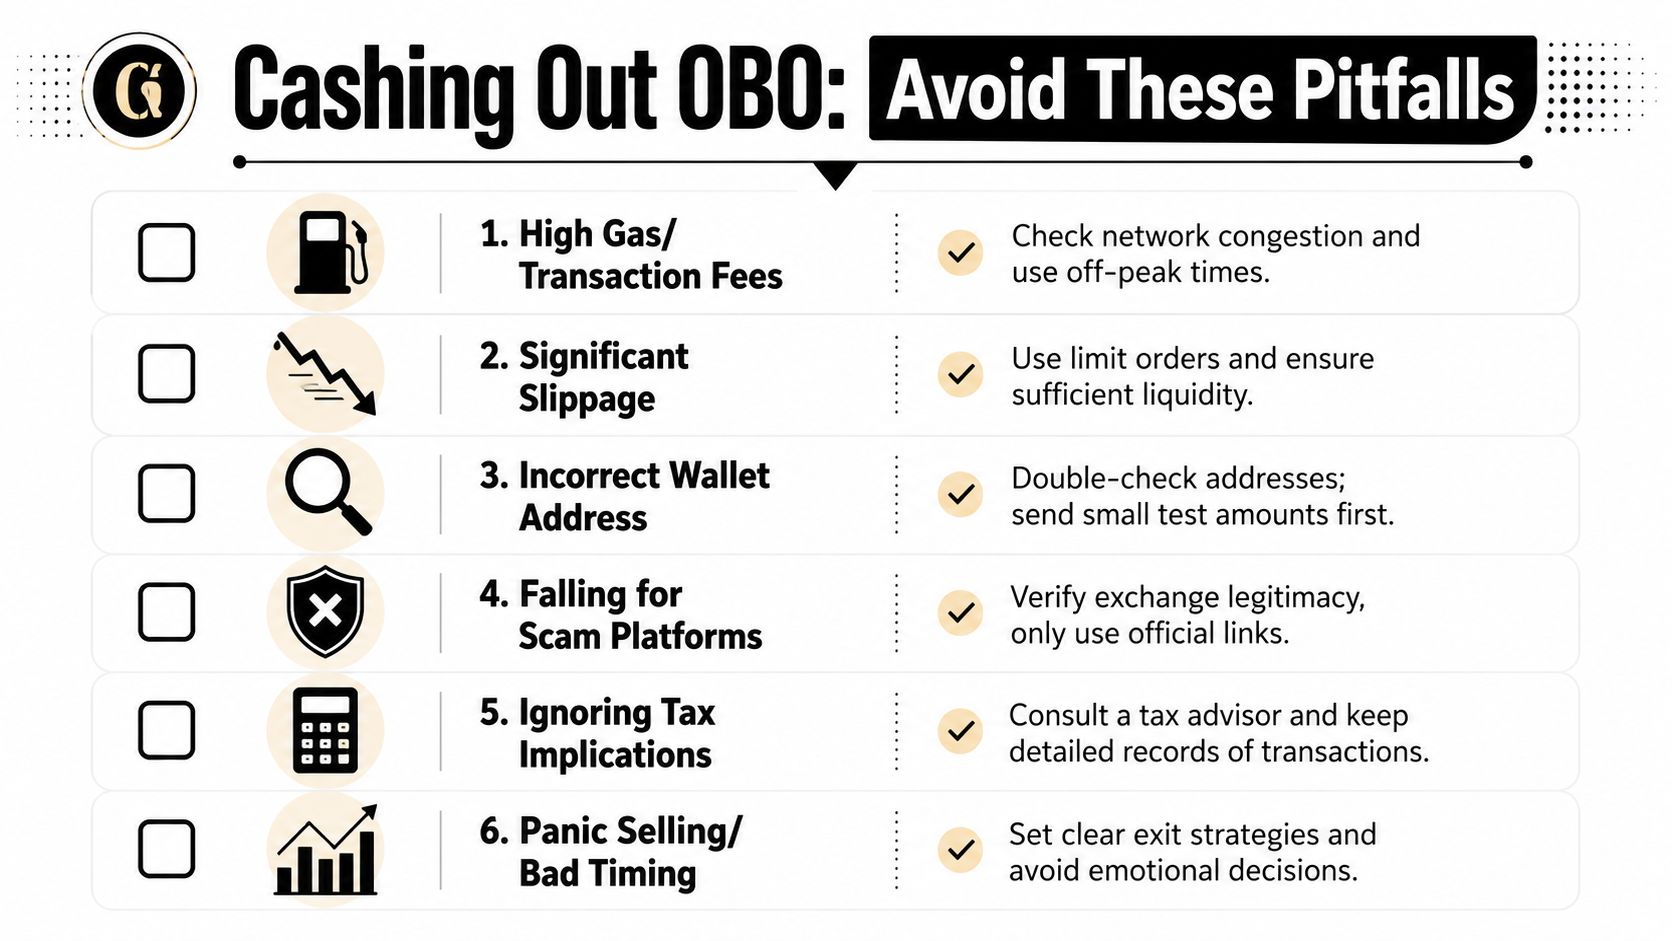
A quoted price is not a promise. If OBO liquidity is thin, your own sell order can move the market against you while it executes.
You avoid this by:
Network fees can turn a good exit into a mediocre one. This is especially true when you're making several transactions in sequence.
Use a checklist before you act:
For thin markets, technical indicators can help you decide whether a market is orderly enough to trade. They are not crystal balls.
Kraken explains that RSI is commonly calculated over 14 bars, with values below 30 often treated as oversold and above 70 as overbought on its guide to crypto technical indicators. For small tokens, the more useful point is practical: erratic RSI or indicator behavior that doesn't line up with volume can signal weak liquidity.
Watch for disagreement between price and participation. If the chart moves but volume doesn't confirm, execution risk usually rises.
A confirmed move with stable participation is more actionable than a random spike.
The most expensive mistakes are often boring:
One practical defense is to treat the exit like a checklist, not a click. Verify address, network, market, and destination before every transfer. Send a test amount when the route is unfamiliar.
Emotional selling is another common problem. If you only decide to sell after the chart starts rolling over, you're reacting, not managing risk. Smaller assets usually punish late decisions more harshly than majors.
You are up on OBO, the chart still looks fine, and then one cluster of early wallets starts selling into strength. By the time that shift is obvious on price alone, your exit is usually worse.
That is a primary use case for Wallet Finder.ai trading signals for smart-money wallet tracking. For low-liquidity tokens like OBO, wallet behavior often changes before retail sentiment does. If the wallets that built the move begin trimming size, rotating out, or sending tokens toward likely exit routes, that can matter more than one more green candle.
A useful exit process starts with context, not hope. Track which wallets entered early, how they normally take profit, and whether selling is isolated or happening across a group with similar timing. One wallet selling can be noise. Several profitable wallets cutting exposure in the same window usually deserves attention.
I watch for behavior, not headlines.
That means checking whether strong wallets are scaling out slowly, fully closing, or only trimming after a sharp move. It also means comparing that activity to current liquidity. If smart wallets are selling and the pool is thin, waiting for confirmation can cost more than acting a bit early. You may leave some upside on the table, but you keep control over execution.
Reactive exits tend to be expensive. A trader who waits for a visible breakdown usually sells after conditions have already worsened. A prepared trader has alerts set, knows the route to stablecoins or exchange deposit, and can act while slippage is still acceptable.
The goal is not to call the exact top. The goal is to sell into order, not into panic.
If you trade names like OBO regularly, your edge is not only finding the token before everyone else. It is recognizing when the wallets that mattered on the way up stop behaving like holders and start behaving like sellers.
If you want a cleaner way to time exits, monitor profitable wallets, and get alerts when tracked traders start selling, try Wallet Finder.ai. It gives you a practical way to turn on-chain behavior into an exit workflow instead of waiting for your OBO position to become a scramble.

A premier DeFi analytics platform empowering traders to discover and analyze profitable blockchain wallets, trades and tokens.

