
Recovery Factor Calculation for Smart Traders
Master the recovery factor calculation to measure a strategy's resilience. Learn the formula, see DeFi examples, and find top wallets with Wallet Finder.ai.

June 20, 2026


Wallet Finder
May 17, 2026

You buy a breakout. The candle looks clean, momentum is obvious, and crypto Twitter is loud. An hour later, the move stalls, drifts sideways, and then unwinds. You didn't read price action wrong. You probably missed what the trade volume means underneath it.
That's the trap. Newer traders often treat volume bars like background noise. Experienced traders don't. They treat volume as the market's footprint. It shows whether a move attracted real participation, whether liquidity was actually there, and whether buyers and sellers agreed enough to keep trading at those prices.
In crypto, that gets trickier. A big number on a centralized exchange screen and a big number on a DEX dashboard can look similar, but they don't tell the same story. One may reflect activity inside a closed venue. The other may be split across pools, chains, and wallets. If you don't separate those two worlds, you'll trust signals that don't deserve it.
A fake rally usually looks convincing at first.
Price pushes through a recent high. Candles expand. Chat rooms fill with breakout calls. You buy because the chart says “go.” Then the move loses steam almost immediately. There was no follow-through, no real bidding behind it, and no depth once early buyers stopped chasing.
That's where volume matters. The bar below the chart isn't just a count. It's evidence of how many units changed hands during that period, and that changes how you should interpret price. A strong move with broad participation tends to behave differently from a move that squeezed through on thin activity.
Think of price as the headline and volume as the attendance. A concert that “sold out” in a tiny room doesn't mean the same thing as a stadium crowd. Markets work the same way. A price move can look dramatic, but if very few traders participated, the move may have far less meaning than it seems.
Practical rule: If a move looks powerful but the participation behind it looks weak, trust the participation.
This is why seasoned traders rarely ask only, “Did price break out?” They ask better questions.
Volume won't predict every reversal. It won't save you from every trap. But it does help you stop treating every fast move as meaningful. In practice, that's one of the biggest upgrades a trader can make.
Trade volume means the total number of shares, contracts, or units of an asset that change hands during a defined period. In stocks, it's counted by shares rather than dollar value, and market activity often clusters around the open and close, as noted in Chase's explanation of how trading volume is measured.
That definition sounds simple, but traders get confused because volume is always attached to a time frame. A five-minute volume bar tells you how much traded in five minutes. A daily bar tells you how much traded in a day. Same concept, different lens.
Treat volume like crowd size at an event.
If a token rises and very few units trade, the “crowd” was small. If the same move happens while a large number of units trade, more market participants were involved. That doesn't automatically make the move good, but it does make it more relevant.
Crypto adds another layer. You're not always looking at one clean venue. Sometimes the number comes from a centralized exchange. Sometimes it comes from on-chain swaps across liquidity pools. Sometimes dashboards combine them. Sometimes they don't.
| Aspect | Centralized Exchange (CEX) Volume | On-Chain (DEX) Volume |
|---|---|---|
| Where data comes from | Exchange-reported trades inside the venue | Blockchain transactions and swaps recorded on-chain |
| What the number reflects | Activity among users trading on that exchange | Activity through pools, routers, and smart contracts |
| Transparency | You see what the exchange publishes | You can inspect wallet and transaction activity directly |
| Comparability | Easier to compare within one venue | Harder to compare because activity may be split across chains and pools |
| Manipulation risk | Reported numbers may need venue-level skepticism | Wallet paths can be inspected, but fragmented routing can distort first impressions |
| Best use | Short-term execution context on a known venue | Deeper behavioral analysis of who traded and how |
The biggest beginner mistake is assuming these are interchangeable. They aren't. CEX volume is venue-centric. On-chain volume is network-centric and often fragmented. A token can look quiet on one DEX while being active elsewhere.
If you want a deeper crypto-specific breakdown, this guide to volume analysis in crypto markets is a useful companion to chart study.
Volume is easy to define and easy to misuse. The number matters less when you don't know where it came from.
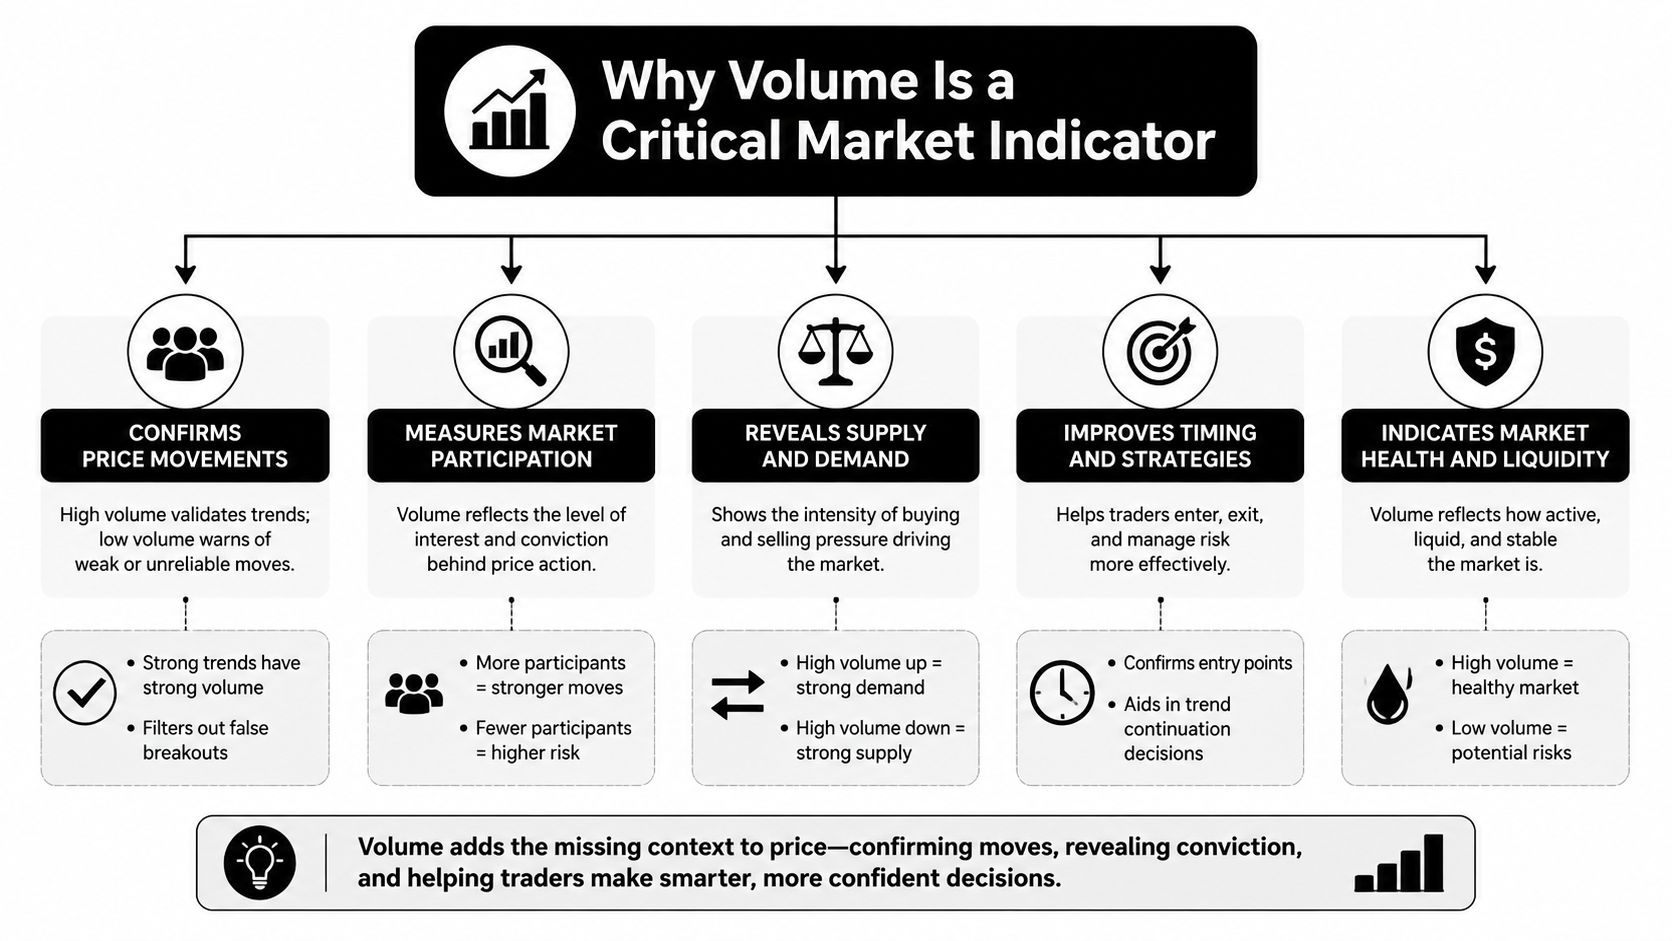
Price tells you where the market moved. Volume helps explain whether that move had enough participation to matter.
That's why traders treat volume as a market indicator rather than a decorative chart add-on. Analysts compare current activity against a recent baseline to judge whether a move is being validated by broader involvement. Schwab notes that above-average or increasing volume during an uptrend suggests commitment, and a valid breakout is often expected to show roughly 1.5x to 2x average daily volume in Schwab's discussion of trading volume as a market indicator.
When more buyers and sellers are active near the same price, orders usually get filled with less disruption. In plain terms, higher participation often means a market can absorb your order more cleanly.
That matters whether you scalp, swing trade, or move size. If volume is thin, even a decent setup can become expensive because your order pushes price further than expected.
Traders often learn this one the hard way. You click buy at one price and get filled somewhere worse. That gap is slippage, and thin activity makes it more likely.
Volume doesn't solve execution problems by itself, but it gives you an early warning. A market with weak participation usually deserves smaller size, wider caution, or no trade at all.
Volume becomes a practical filter here.
A breakout through resistance looks more credible when participation expands with the move. A rally that climbs while activity fades is less convincing. The chart may still rise for a bit, but the support underneath it is weaker.
Here's a useful way to apply it:
A move on low participation is like applause from a nearly empty room. You hear noise, but you don't have consensus.
Volume is strong as a confirmation tool. It's weak as a standalone decision-maker.
Use it with structure, liquidity, and context. Don't use it as a magic green light. The best traders don't ask volume to predict. They ask it to confirm or challenge what price is already suggesting.
Reading volume becomes useful when it changes your behavior. In crypto, that usually means filtering trends, checking breakout quality, and deciding whether a move came from broad participation or from a narrow pocket of activity.

A healthy uptrend usually attracts continued trading interest. If price keeps grinding higher and participation stays engaged, the trend has support.
Trouble starts when price rises but activity dries up. That kind of divergence doesn't guarantee a reversal, but it often tells you the move is getting fragile. In practice, that means tightening risk, avoiding aggressive adds, or waiting for fresh confirmation before entering.
A simple working routine:
Basic volume bars tell you when activity happened. Volume profile helps show where activity clustered by price.
NinjaTrader explains that the Point of Control is the highest-volume price, and the value area typically contains about 70% of traded volume in its guide to volume analysis in futures trading. Traders use those zones as objective support and resistance references because they highlight prices where the market previously accepted value.
That's useful in crypto because many traders make poor entries in the middle of nowhere. Volume profile gives you better reference points:
If price leaves a high-volume area with expanding activity, the move often has better odds than a breakout launched from a random chart level.
On-chain markets let you inspect something CEX dashboards often hide. You can look past the total volume number and ask which wallets created it.
That's where tools that track wallet flows become useful. For example, Wallet Finder.ai's cumulative volume delta article helps frame how buying and selling pressure can be studied with more nuance than a simple volume bar. In practice, many traders combine chart volume with wallet-level behavior to see whether active participation came from random flow or from addresses they already monitor.
That's especially helpful for copy traders. Total volume can tell you something is happening. Wallet-level volume can tell you who is making it happen.
High volume doesn't always mean conviction. Sometimes it means noise. Sometimes it means manipulation. Sometimes it means the same activity is being viewed through an incomplete lens.
That's especially true in crypto, where “trade volume” is often misunderstood as a clean signal even though it can reflect market structure changes and liquidity fragmentation. In DeFi, activity can be split across venues and chains, making volume less comparable than on a single centralized exchange, as explained in this discussion of trading volume and fragmentation.
Wash trading tries to create the appearance of real demand. The goal is simple. Make a market look active enough that outside traders trust the move.
You won't always catch it perfectly, but some patterns deserve suspicion:
When volume spikes, don't ask only whether it's high. Ask whether it's believable.
If you want a wallet-first process for suspicious surges, this walkthrough on analyzing wallet volume spikes is a practical place to start.
Don't treat volume as proof. Treat it as a claim that needs verification.
Basic chart platforms show raw volume well enough. Serious crypto analysis usually needs more context than that.
The most useful tools do more than print bars under candles. They help you decide whether the activity is tradeable.
A practical setup should include:
For on-chain traders, one option is Wallet Finder.ai, which tracks blockchain wallet activity across major ecosystems and lets users monitor trades, wallets, and token flows with filters and alerts. Used alongside charting platforms, block explorers, and DEX analytics, that kind of tooling helps answer the underlying question behind every volume spike: was this broad participation, concentrated flow, or manufactured noise?
The edge isn't in seeing more volume. It's in seeing which volume deserves your attention.
If you want to turn raw on-chain activity into something you can trade, Wallet Finder.ai gives you a way to track wallet behavior, inspect token flows, and set alerts around the addresses and trades you care about most. That can make volume analysis less about guessing from a chart and more about following the footprints behind the move.

A premier DeFi analytics platform empowering traders to discover and analyze profitable blockchain wallets, trades and tokens.

