
Recovery Factor Calculation for Smart Traders
Master the recovery factor calculation to measure a strategy's resilience. Learn the formula, see DeFi examples, and find top wallets with Wallet Finder.ai.

June 20, 2026


Wallet Finder
May 20, 2026
You pull up ICP on one tab, CoinMarketCap on another, Coinbase on a third, and the numbers don't line up. The price looks crushed versus the launch era, but the project still sits in large-cap territory depending on which dashboard you trust. That gap is where a lot of bad trades start.
For ICP, market cap matters more than the headline token price. A cheap-looking coin can still carry a heavy valuation if supply is large, and a market cap figure can mislead if the platform is using a different supply base than the one you assumed. If you're trading rotations, trying to judge whether ICP has room to rerate, or deciding whether to copy wallets accumulating into weakness, you need to know what the number actually represents.
ICP tends to confuse traders because the chart and the valuation story don't feel like they belong to the same asset. Coinbase reports an all-time high price of $630.00 on May 10, 2021, and notes the token is now about 99% below that peak. In the same Coinbase dataset, ICP still shows a current market cap of about $2.83B based on a price of $5.20 and a total supply of 540,818,885 ICP, while circulating supply is listed around 541 million tokens. You can verify those figures on Coinbase's Internet Computer price page.
That creates the core puzzle. Traders see a brutal long-term drawdown and assume ICP is now a small, forgotten asset. It isn't. It still screens as a meaningful crypto asset by absolute size, even though its launch-era valuation has been compressed hard.
Starting with price is the wrong first move for an asset like ICP.
A token can trade far below its historic high and still hold a valuation that affects liquidity, ranking, exchange attention, and position sizing. For traders, that means icp coin market cap isn't just a descriptive metric. It's a filter for what type of opportunity you're dealing with.
Practical rule: When an asset has a dramatic launch spike and a long decline, check market cap before you decide it's “cheap.”
The useful question isn't whether ICP once traded much higher. The useful question is whether today's valuation leaves room for expansion, or whether the market is already assigning a substantial value to the network despite weak sentiment.
One good way to frame that is to pair current valuation with context from this breakdown of the price of ICP. Price tells you where traders last agreed. Market cap tells you how much value the market is assigning to the whole network right now.
If you only remember one thing, remember this. There isn't one market cap that answers every trading question.
Circulating market cap tells you what the market is valuing the tokens that are actively in circulation. Fully diluted valuation, usually shortened to FDV, looks forward and asks what the project would be worth if all possible tokens were already out.

Circulating market cap is the number traders usually care about for near-term execution. It relates more directly to float, liquidity, and rank.
FDV matters when you want to understand future dilution risk. If more tokens can enter the market over time, then a stable circulating market cap can hide a changing supply picture underneath.
Current listings for ICP cluster around roughly $1.37B to $1.40B market cap at about $2.48 to $2.52 per token with circulating supply near 551M to 553M tokens, based on the market summary discussed on Binance's Internet Computer price page. That same summary also notes that CoinStats places ICP's past implied valuation at roughly $226.5B at its $410.19 all-time high, versus about $1.32B now. The drawdown is massive, but the more useful trading question is whether current valuation reflects durable usage or merely lower expectations plus supply redistribution.
| Metric | Circulating Market Cap | Fully Diluted Valuation (FDV) |
|---|---|---|
| What it measures | Value of tokens already circulating in the market | Value if all possible tokens were circulating |
| Best use | Shorter-term trading, liquidity analysis, rank comparison | Dilution analysis, longer-horizon valuation work |
| Main question answered | How large is ICP right now in tradable terms? | How expensive could ICP be if supply expands? |
| What can distort it | Disputed circulating supply figures | Unclear future issuance path or unlock assumptions |
| Trader mistake | Treating it as a complete valuation picture | Treating it as current tradable float |
Use circulating market cap when you're deciding whether ICP belongs in a large-cap, mid-cap, or smaller rotation bucket. Use FDV when you're judging how much future supply could lean on price if sentiment weakens.
That distinction gets sharper when you compare market cap with a proper valuation workflow. A useful primer is how to calculate coin value, especially if you want to separate headline price moves from actual network valuation changes.
Traders who ignore FDV often mistake stable price action for healthy valuation. The float can change while the chart looks quiet.
If you've ever checked ICP on three platforms and seen three different market cap numbers, you weren't looking at bad data. You were looking at different methodologies.
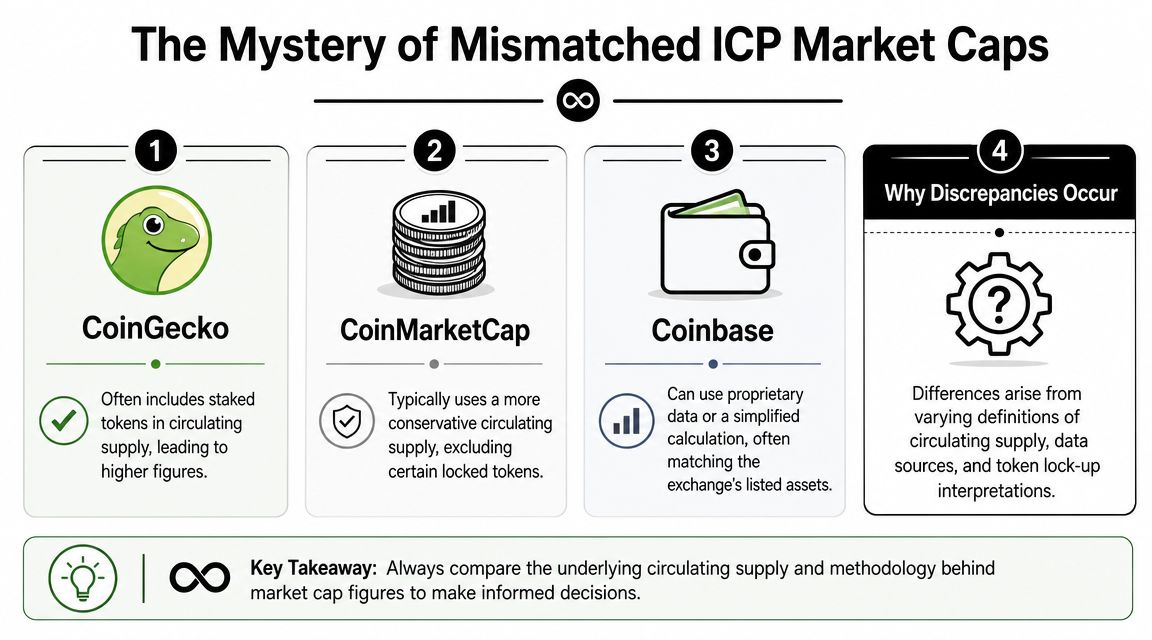
Across major providers, ICP's market cap is consistently reported in the low single-digit billions, but the exact figure varies. CoinGecko lists Internet Computer with a market capitalization of BTC26,601.0302 and ranks it #48, while Coinbase shows about $2.83B, Kraken shows $1,378,692,624, and Crypto.com plus TradingView both cluster near $1.37B. CoinMarketCap similarly reports a live market cap of about $1.395B with a circulating supply of 552,919,129 ICP, and a ranking of #50, as summarized on CoinGecko's Internet Computer page.
Here's a useful explainer if you want a visual summary before going deeper:
Many traders waste time trying to find the “correct” ICP market cap figure. That's not the primary task. The task is to understand which figure matches your use case.
If you're comparing rank and sector positioning, consistency matters more than perfection. Pick one primary dashboard and stick to it. If you're modeling dilution risk, inspect how that platform defines supply before you trust the result.
A market cap number is only as useful as the supply policy behind it.
Use a simple decision rule:
| Trading need | Best approach |
|---|---|
| Ranking ICP against other coins | Use one platform consistently |
| Checking tradable float | Prioritize circulating supply methodology |
| Planning larger entries | Compare market cap with order-book conditions |
| Evaluating long-term valuation | Add FDV and supply mechanics |
What doesn't work is mixing figures from different platforms in the same thesis. If you use Coinbase for price, CoinMarketCap for supply, and a third site for rank, you can manufacture a story that isn't real.
For traders, market cap is not a badge. It's a live read on how much value the market is assigning to ICP at a given moment, and whether that valuation is being reinforced by real network demand.
ICP is unusual because utility and valuation connect more directly than in many token-only narratives. CoinMarketCap describes Internet Computer as a decentralized cloud blockchain hosting full-stack applications fully onchain, and notes that ICP tokens are burned to power computation as well as used for governance. CoinMarketCap's latest update also highlights 284 billion total transactions, a milestone that points to substantial usage rather than purely speculative turnover, as noted in CoinMarketCap's latest ICP updates.
A rising market cap means one of two broad things. Price is rising, supply assumptions are changing, or both. The more important question is whether the network is giving that move support.
For ICP, traders should care about this sequence:
That doesn't mean every rise in activity is bullish for price. It means ICP deserves a different framework than a token whose valuation depends mostly on exchange speculation.
Desk note: On ICP, I'd rather see moderate price action backed by credible network demand than a fast squeeze with no improvement in utility signals.
A practical ICP workflow includes three layers:
| Layer | What to watch | Why it matters |
|---|---|---|
| Valuation | Market cap and supply trend | Shows whether the network is being rerated |
| Participation | Exchange liquidity and trading conditions | Helps judge slippage and conviction |
| Utility | Transaction growth and application activity | Tests whether demand is fundamental or just cyclical |
A lot of traders stop at the first layer. That's where false confidence creeps in. If market cap rises while utility is flat and liquidity thins out, the move can be harder to trust. If market cap stays subdued while network use improves, that can be more interesting than the chart first suggests.
Market cap can tell you where ICP sits in the market. It can't tell you who's building positions before a move becomes obvious. That's where wallet-level analysis matters.
CoinMarketCap lists ICP at about $2.48 with a circulating supply of roughly 552.9 million tokens, producing a market cap around $1.37 billion. That means every $0.10 move in ICP's spot price changes network market cap by about $55.3 million, which is material for rank changes and for liquidity-sensitive traders. The same market summary notes that market-cap-based screening should be paired with order-book depth and turnover rather than used on its own, especially for an asset that can reprice quickly during broad selloffs. Those figures come from CoinMarketCap's Internet Computer market page.

Suppose ICP starts climbing in market cap after a long basing phase. That tells you capital is rotating in. It still doesn't answer four practical trading questions:
That's why macro valuation needs a micro execution layer.
Start with the macro screen. If ICP's market cap is improving relative to its recent range, put it on your active watchlist.
Then shift to wallet behavior:
Find wallets with a history of good timing
Look for addresses that consistently enter before broad attention arrives, not wallets that only chase visible breakouts.
Check whether accumulation is repeated
One buy can be noise. Multiple entries across time usually matter more.
Look at position behavior, not just token selection
Entry pacing, adds into weakness, and disciplined exits tell you more than a single profitable trade.
Track whether wallet activity agrees with market-cap expansion
If both trend in the same direction, the thesis is stronger. If valuation rises while stronger wallets fade exposure, caution makes sense.
| Approach | What works | What fails |
|---|---|---|
| Macro screening | Using market cap to identify rerating candidates | Treating rank changes as a full thesis |
| Execution timing | Waiting for wallet accumulation to confirm | Buying just because ICP moved up the rankings |
| Risk control | Checking liquidity before copying trades | Assuming large-cap status removes slippage risk |
| Position management | Letting wallet behavior refine entries and exits | Copying a wallet without understanding its style |
Market cap shows the stage of the move. Wallet behavior helps identify the actors driving it.
For copy traders and quant teams, that combination is stronger than either signal alone. A rising icp coin market cap says the asset deserves attention. Wallet-level activity helps decide whether that attention should turn into a trade.
Most traders don't need a complicated framework. They need a repeatable one. The goal is to track ICP the same way every time so your conclusions stay comparable.
![]()
Choose a single data provider as your anchor. CoinGecko, CoinMarketCap, and Coinbase are all commonly used, but mixing them mid-analysis creates confusion.
Your primary source should be the one you use for:
If you pull data programmatically, it helps to understand how providers structure and refresh their feeds. This guide to the CoinGecko API documentation is useful if you're building your own dashboard or automating comparisons.
Many avoidable errors stem from superficial analysis. Don't just read the market cap number. Read how the platform gets there.
Check:
A market cap figure is not independent data. It's a calculation built on supply assumptions.
Before placing a trade or publishing a thesis, compare your primary source against one or two other major platforms. You're not trying to force a perfect match. You're looking for a discrepancy large enough to change your decision.
Use this quick checklist:
| Check | What you want to see |
|---|---|
| Price alignment | Similar live price range across platforms |
| Supply alignment | No major surprise in circulating supply treatment |
| Rank alignment | Reasonable consistency in relative position |
| Interpretation | Same broad conclusion, even if exact numbers differ |
If the numbers diverge sharply, slow down. Re-check the supply basis before you assume the market moved.
Consistency beats false precision. A clean process produces better decisions than chasing the newest number on the screen.
Wallet-level research is what turns valuation awareness into trade timing. Wallet Finder.ai helps traders track profitable on-chain wallets, study complete trading histories, and monitor buy and sell activity in real time so you can pair macro market-cap analysis with the actual wallet behavior moving markets.

A premier DeFi analytics platform empowering traders to discover and analyze profitable blockchain wallets, trades and tokens.

