
Recovery Factor Calculation for Smart Traders
Master the recovery factor calculation to measure a strategy's resilience. Learn the formula, see DeFi examples, and find top wallets with Wallet Finder.ai.

June 20, 2026


Wallet Finder
April 21, 2026
Most traders look at XEN and ask whether the next pump is coming. The better question is who is moving it. XEN went from an initial detected exchange rate of about $0.0000015 to an all-time high of $0.75 on October 9, 2022, then later fell to $5.96E-9 in February 2026 according to CoinLore historical data. That isn’t normal price discovery. It’s a stress test for anyone trading thin, reflexive crypto markets.
That kind of chart breaks most standard playbooks. Discounted cash flow is useless here. Narrative-only trading is worse. If you want to understand the xen crypto price, you need to read structure, liquidity, and wallet behavior together.
XEN’s launch behavior tells you almost everything you need to know about the asset. It attracted attention because the upside looked absurdly large, then punished anyone who treated the first move as proof of durable value. Traders who caught the early expansion had a momentum trade. Traders who arrived late often became exit liquidity.

The counterintuitive part is that XEN can still be interesting precisely because it has been so destructive. Instruments with unstable supply, fragmented liquidity, and strong community narratives often produce repeatable short windows of opportunity. Those windows are hard to capture with static charts alone.
A lot of traders make the same mistake. They search for a single fair value, or they rely on exchange candles without watching the flows behind them. That’s the wrong frame for XEN. It behaves more like a sentiment amplifier inside a low-liquidity environment.
Practical rule: Treat XEN as a trading environment, not an investment thesis, unless you have a very clear reason for holding through extreme drawdowns.
XEN’s price history combines traits from fair-launch tokens, memecoins, and low-float speculative plays, even though its mechanics are different from a standard meme token. That mix produces moves that feel irrational unless you map them to participation, sell pressure, and wallet concentration.
For active traders, the useful lens is this:
If you're building a data workflow, a good starting point is using tools and feeds built around crypto price APIs for trading systems, then pairing that with wallet-level observation instead of relying on headline predictions.
XEN only makes sense if you start with its issuance model. Price is not driven by a fixed supply story or a venture token release schedule. It reacts to participation, claim behavior, gas costs, and how quickly newly minted tokens reach the market.
The fair-launch structure is the first thing traders need to get right. XEN launched without a presale, without venture allocations, and without a team overhang waiting to hit the bid. That shifts the risk analysis. Instead of tracking insider vesting, traders need to watch wallet growth, claim schedules, and clusters of holders that can turn future supply into immediate sell pressure.
Fair launch does remove one common crypto risk. There is no private-round inventory sitting in the background with a known incentive to distribute into retail strength.
But fair launch is not the same as low-risk. Open access widens participation, and with XEN that can widen future supply at the same time. In practice, that creates a market where narrative can attract users, users can create more issuance, and that issuance can later weigh on price if enough wallets claim and sell into thin liquidity.
That trade-off is why wallet-level tracking matters more here than in a standard token. The wallets that claim size, bridge tokens to exchanges, or rotate into liquidity pools often matter more than headline sentiment.
XEN changes the trader's job. The edge comes from reading participation cycles and wallet behavior before that supply shows up on the chart.
Minting XEN functions as a digital claim on future tokens. A user interacts through an Ethereum wallet, pays gas, and starts a waiting period before the tokens can be claimed.
That delay is one of the model's defining features. Supply does not appear all at once. It arrives in waves tied to user behavior.
For traders, three mechanics matter most:
Many traders get trapped when they see community growth and read it as pure demand. With XEN, participation can be bullish for attention and bearish for later supply if the same wallets are likely to monetize quickly.
The useful way to trade XEN is to separate narrative from mechanics. Fair launch helps explain why the project got attention. It does not explain where the next tradable move comes from.
The better workflow is practical:
| Trading lens | What it means in practice |
|---|---|
| Fair launch | Reduces insider overhang, but does not prevent broad retail distribution |
| Open participation | Grows reach and future supply at the same time |
| Delayed claim model | Creates identifiable windows where sell pressure can emerge |
| Ethereum gas conditions | Changes the cost of minting and can alter user activity |
| Wallet clustering | Helps identify whether supply is diffuse or controlled by a smaller group of active sellers |
I treat XEN as a flow-driven asset. The strongest signals usually come from on-chain behavior before they become obvious on price charts. If a cluster of smart wallets starts accumulating after a heavy claim period, that is worth more than a generic social media spike. If large claimers begin transferring out while liquidity is thin, the setup usually favors caution.
That is the primary edge in XEN. Traders who track who is minting, who is claiming, and which wallets consistently move size have a better chance of catching the moves that matter.
XEN’s chart only makes sense if you treat it as a supply event with trading windows, not as a standard trend asset. Traders who tried to read it like a clean momentum coin usually got chopped up. The bigger edge came from spotting when wallet behavior and liquidity conditions lined up for short, tradable bursts.
The broad arc is clear. XEN opened with launch-driven speculation, spent a long period repricing lower as supply hit the market, and then settled into a thin-liquidity regime where sharp percentage moves still appeared from a much weaker base. The historical milestones cited earlier from CoinLore capture that path without changing the core takeaway. XEN has been capable of extreme upside, but it has also shown how fast open distribution can turn into persistent sell pressure.
| Metric | Value (USD) | Date |
|---|---|---|
| Initial detected exchange rate | $0.0000015 | October 2022 |
| All-time high | $0.75 | October 9, 2022 |
| 2023 close | $0.0000004 | June 2023 |
| 2024 peak | $0.0000008 | 2024 |
| 2024 average and close | $0.0000002 | 2024 |
| All-time low | $5.96E-9 | February 2026 |
The launch phase rewarded speed more than conviction. XEN ripped higher in a way that drew in momentum traders, airdrop-style speculators, and DeFi users chasing asymmetry. Those early candles looked powerful on the chart, but they were also fragile because price discovery was happening before the market had a stable view of future circulating supply.
That setup matters. In tokens with aggressive early attention, traders often mistake reflexive buying for durable demand. XEN showed the difference quickly.
A vertical move can create profit. It can also create inventory for later sellers.
The next phase was the harder lesson. Price kept falling, and the decline outlasted the initial narrative. Traders who anchored to the top often treated each rebound as confirmation of a bottom. In practice, many of those bounces were just relief moves inside a broader distribution cycle.
On-chain context starts to matter more than the candle itself. If claims rise, transfers to exchanges increase, and large wallets distribute into thin liquidity, a green week does not mean much. I usually treat that combination as a warning that price strength may be exit liquidity rather than the start of a durable reversal.
That distinction separates trading from hoping.
Once XEN moved into a lower-liquidity phase, the chart changed character. The market still offered violent percentage swings, but the driver was no longer broad participation. It was short bursts of speculation, uneven depth, and wallet concentration.
That is why historical analysis for XEN should not stop at price levels. The better question is who was active before each move. If a small cluster of wallets accumulates after a heavy claim period and tokens stay off exchanges, that can support a sharp rally. If those same wallets begin transferring out into weak books, the move often fades fast.
For active traders, the practical read is simple. XEN’s history favors event-driven setups over passive holding. The strongest signals usually appear when you line up three things at once: claim-related supply pressure, exchange transfer behavior, and whether the wallets that moved size in prior runs are back in the market.
The xen crypto price doesn’t move on one variable. It reacts to a tug-of-war between supply creation, deflationary pressure, Ethereum network conditions, and trading access. If you leave any one of those out, your read is incomplete.
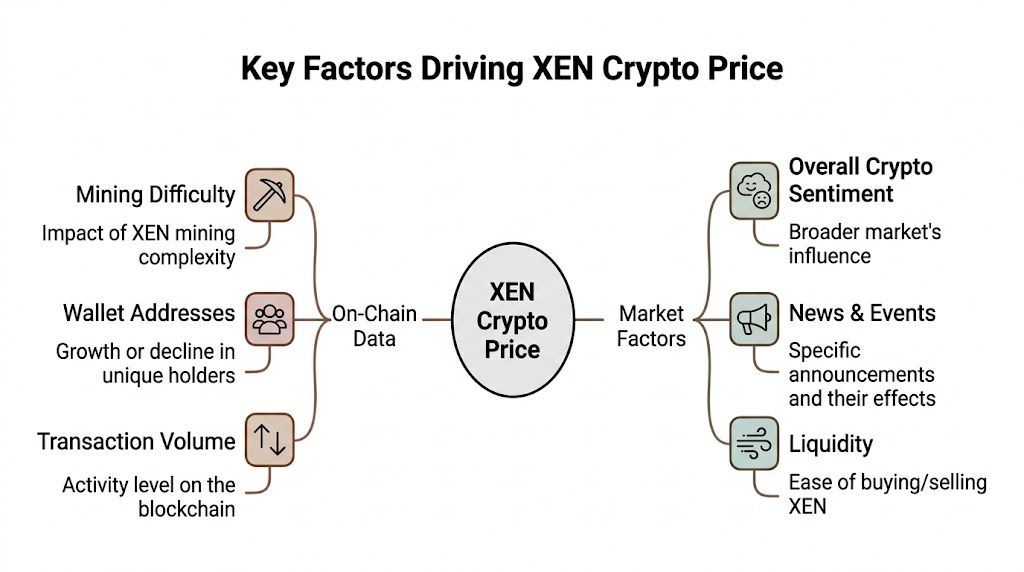
A useful way to think about XEN is as a token where mechanics create pressure and traders create acceleration. The mechanics shape the background. Market participants decide when that background suddenly matters.
XEN has a protocol-driven supply model, and that’s a double-edged sword. On one hand, there are no VC dumps in the usual sense. On the other, open participation can translate into persistent token creation and eventual selling.
That’s why emerging deflationary burns matter. According to Binance’s XEN price page, XEN’s protocol-driven supply and emerging post-minting-era burns create a dynamic that differs from hyped memecoins with no mechanics, and the same source notes a recent 11.78% 24h gain amid broader market dumps.
The practical takeaway is simple. Traders should watch whether the market is fixated on issuance or on reduction in available supply. The dominant narrative can change quickly.
Ethereum gas fees influence whether smaller participants engage or sit out. If gas is high, marginal minting activity can slow. If gas falls, activity can reawaken. For a token whose identity is tied to participation, that’s not a side detail. It’s part of the pricing engine.
This doesn’t mean lower gas automatically creates a bullish market. It means lower gas can alter the balance between participation and pressure. That distinction matters.
Low-liquidity assets don’t need huge demand to move. They need concentrated demand at the right time. They also don’t need broad panic to fall. A few aggressive sellers can do the job.
Three forces usually combine here:
The most dangerous mistake in low-liquidity trading is assuming the chart alone shows conviction. Sometimes it only shows that there weren’t many sellers for a few hours.
The technical picture for XEN is conflicted, which is exactly why traders keep getting mixed signals. The long-term structure remains weak, but short-term indicators can still flash tradeable strength.
According to Intellectia’s XEN technical page, XEN trades significantly below its 200-day moving average, which is a bearish long-term signal. The same source says its 20-period VWMA at $0.00000008 is generating buy signals, suggesting possible algorithmic accumulation at depressed levels.
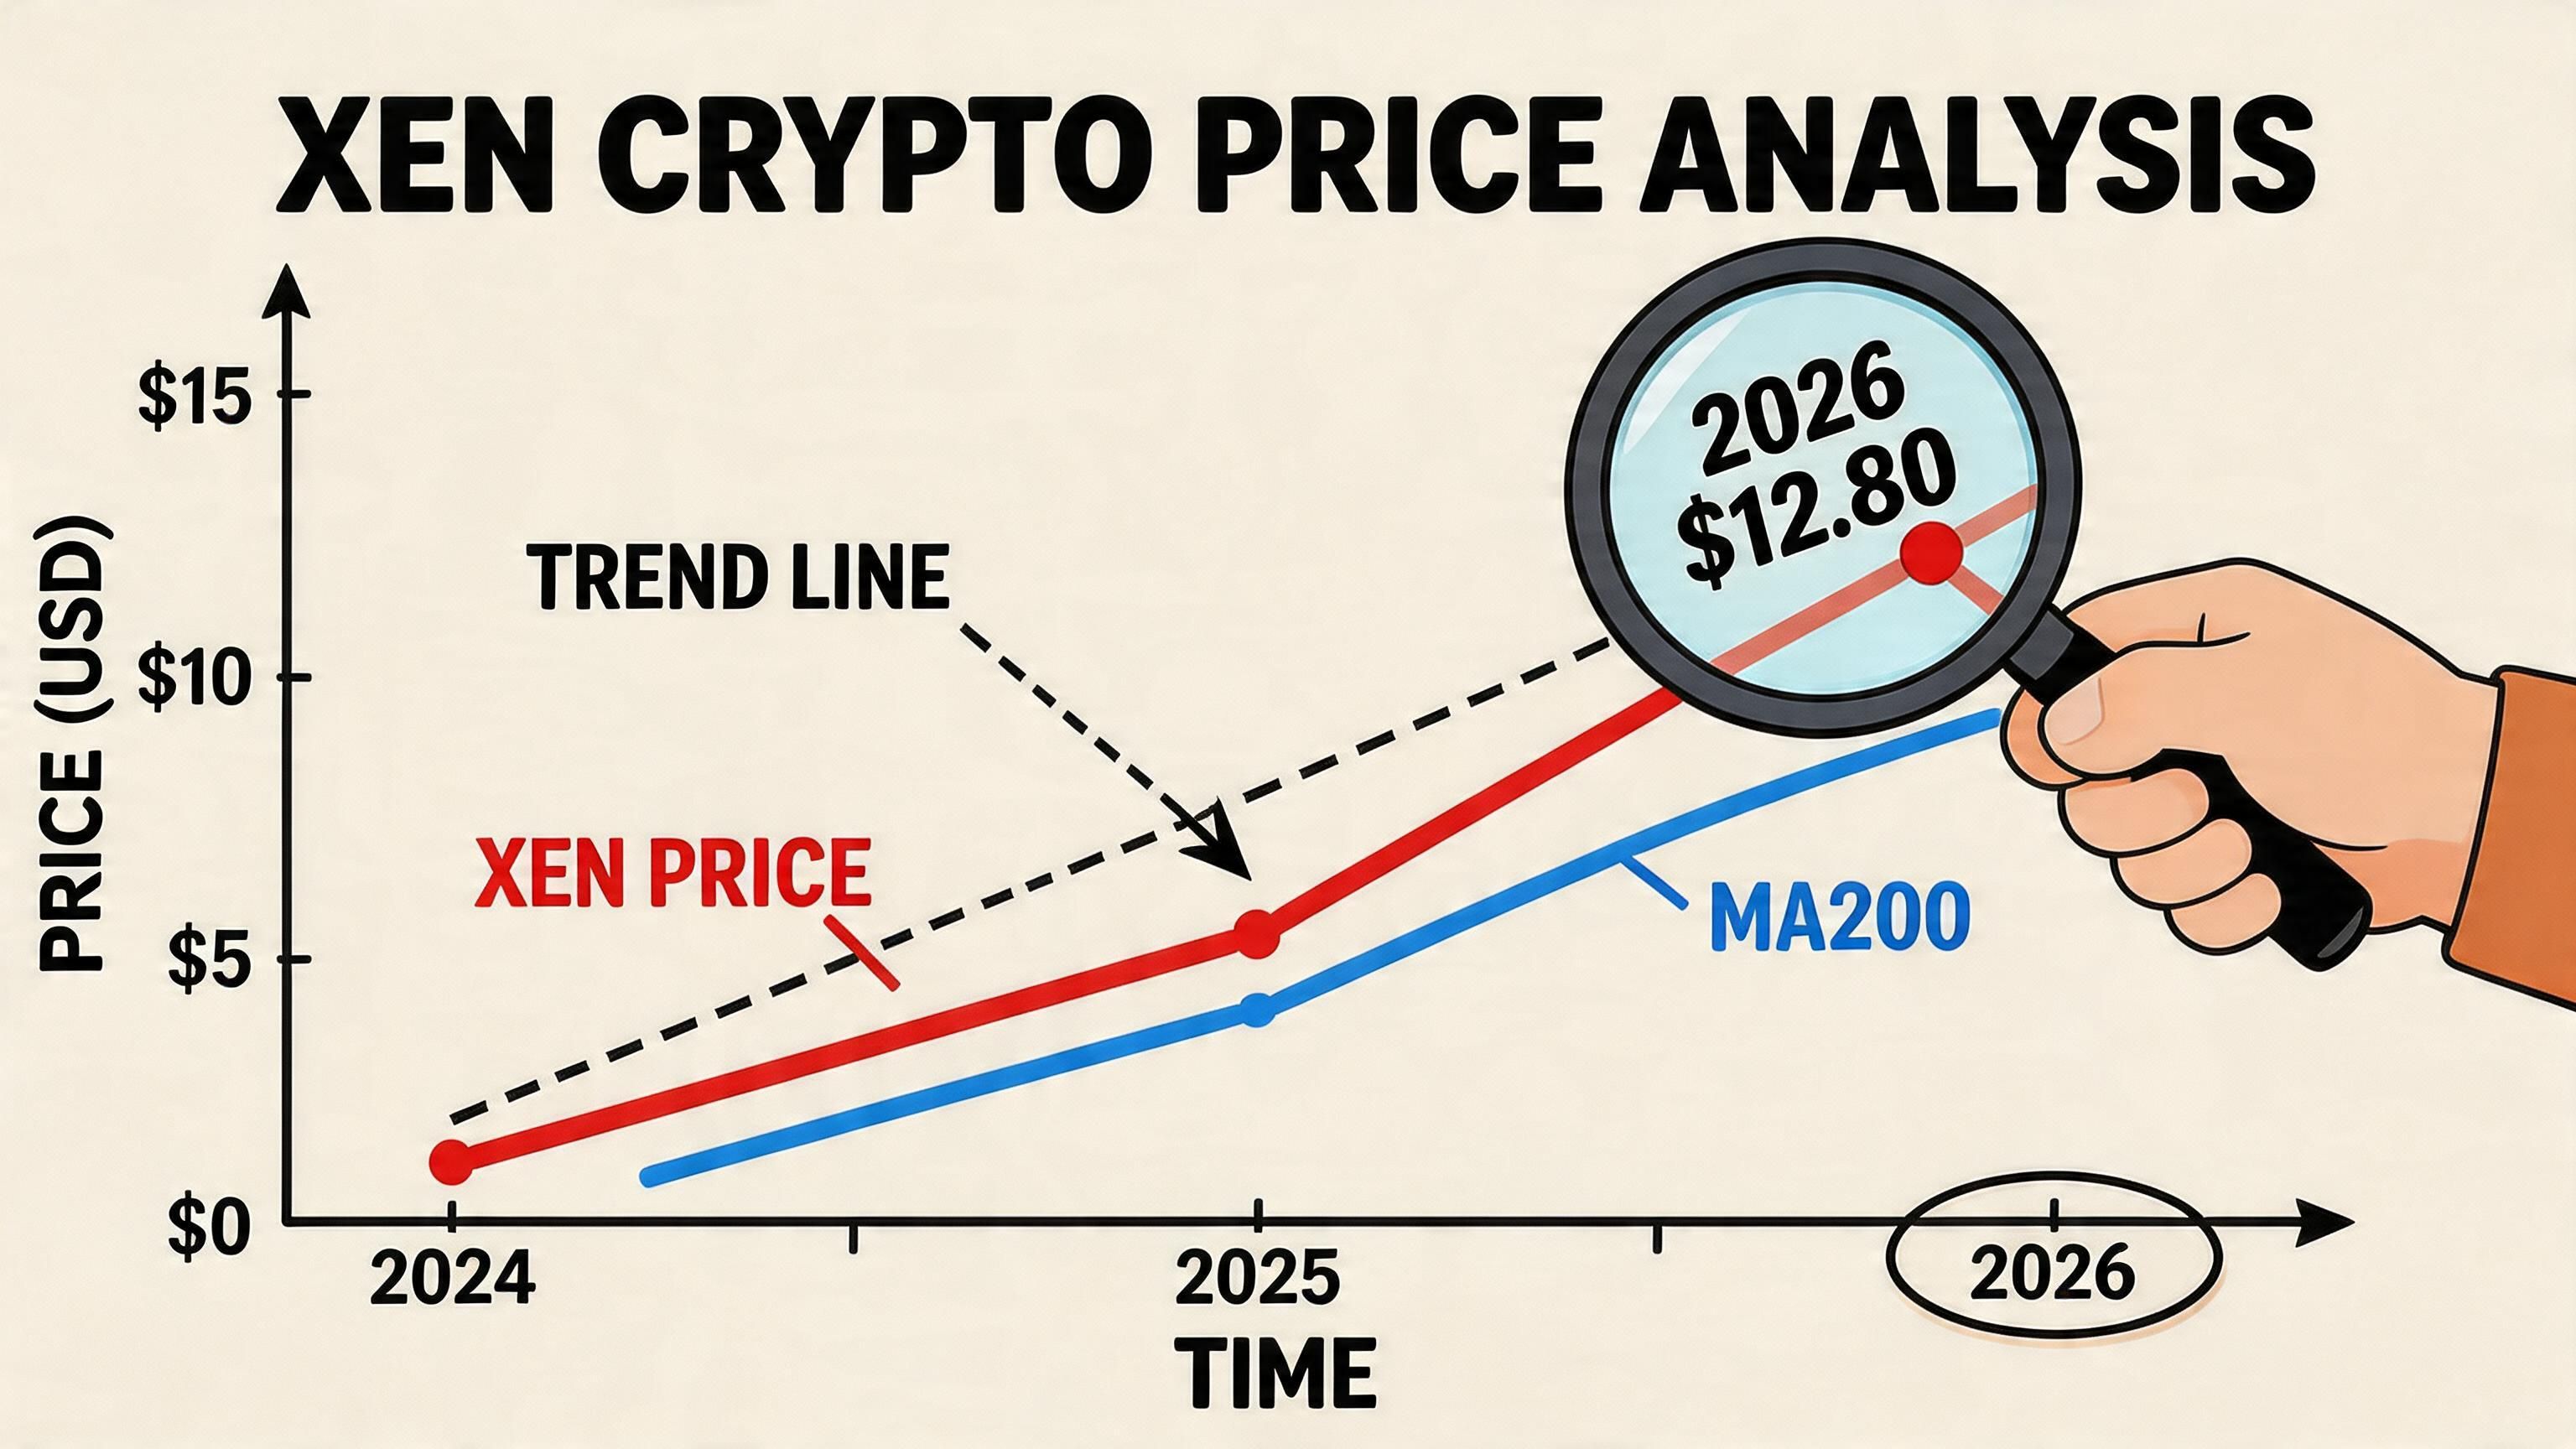
A token below its long-term moving average hierarchy usually hasn’t repaired its larger trend. That tells swing traders to stay careful with position sizing and not confuse a bounce with structural reversal.
This is especially true in names that have already gone through a prolonged collapse. In those conditions, many rallies are reflexive, not foundational.
Short-term traders don’t need a perfect macro chart. They need a reason to believe a local dislocation can mean-revert. If the VWMA is flashing buy conditions and the market starts reacting, there may be room for tactical trades even inside an ugly long-term structure.
That’s where confirmation matters more than prediction. I’d rather see proof of entry pressure and cleaner follow-through than make a bold target call based on one indicator.
A practical checklist looks like this:
For traders refining execution, these crypto indicators for better entries and exits are more useful when paired with wallet observation than when used alone.
Most XEN analysis online focuses on prediction pages. That’s not where the edge is. In a token with thin liquidity and sharp reaction to concentrated activity, the edge comes from tracking who is buying, who is selling, and whether those wallets have a history of good timing.
That isn’t theory. According to 3Commas analysis on XEN, XEN has low 24h volumes between $99K and $720K and a circulating supply over 200 Trillion, making it highly susceptible to whale-induced price swings. The same source highlights the gap in standard price predictions, which often ignore top holders’ PnL and entry timing.
If you’re serious about trading XEN, your workflow should answer a few direct questions before you take a position:
| Question | Why it matters |
|---|---|
| Which wallets bought before the latest move? | Early entries often matter more than public sentiment |
| Did those wallets sell strength or keep adding? | This separates conviction from short-term flipping |
| Are profitable wallets clustering around the same zone? | Clustered behavior often reveals key levels |
| Is the move broad or concentrated? | Concentrated moves can reverse faster |
A good process starts with token discovery. Pull up XEN inside an on-chain wallet intelligence platform and identify wallets with repeated profitable behavior, not just one lucky trade. You want consistency, not noise.
Then review wallet history in context. A wallet that bought XEN profitably once during a market-wide rebound is less interesting than a wallet that repeatedly entered before local expansions and reduced into strength.
Use this sequence:
Don’t copy a wallet just because it’s large. Size alone can be misleading. Some large wallets are passive, some are market-making related, and some can absorb drawdowns that smaller traders can’t.
What you want is evidence of decision quality:
Follow timing, not fame. A quiet wallet with repeatable entry discipline is more useful than a famous address that only looks smart in hindsight.
This method changes how you trade XEN. Instead of buying because the chart already moved, you watch for accumulation before the move becomes obvious. Instead of relying on prediction pages, you measure what skilled participants are doing in real time.
That doesn’t eliminate risk. XEN is still volatile and still capable of whiplash. But it gives you a better framework for handling a token whose price can be pushed around by relatively few actors.
If you want a hands-on starting point for building that process, this guide to using a smart money tracker is the right place to begin.
Not exactly. It shares speculative traits with memecoins, especially in how quickly sentiment can move price, but its protocol-driven supply and fair-launch design give it a different structure. That difference matters when you’re analyzing sell pressure and participation cycles.
Volatility. CoinCodex’s XEN market data shows a 14-day RSI of 56.66, 7-day performance of +70.83%, and measured volatility of 6.73%. That mix tells traders the market can move hard in either direction without establishing durable trend control.
Usually not as a default. In instruments like this, range-trading logic is often more practical than assuming a clean sustained trend will hold.
Watch wallet activity, liquidity conditions, and whether strong hands are accumulating or distributing. In low-liquidity assets, those factors often matter more than broad social sentiment.
Yes. Its fair-launch structure changes where dilution and sell pressure come from. The risk isn’t mainly private-round token releases. It’s ongoing market behavior from participants and holders.
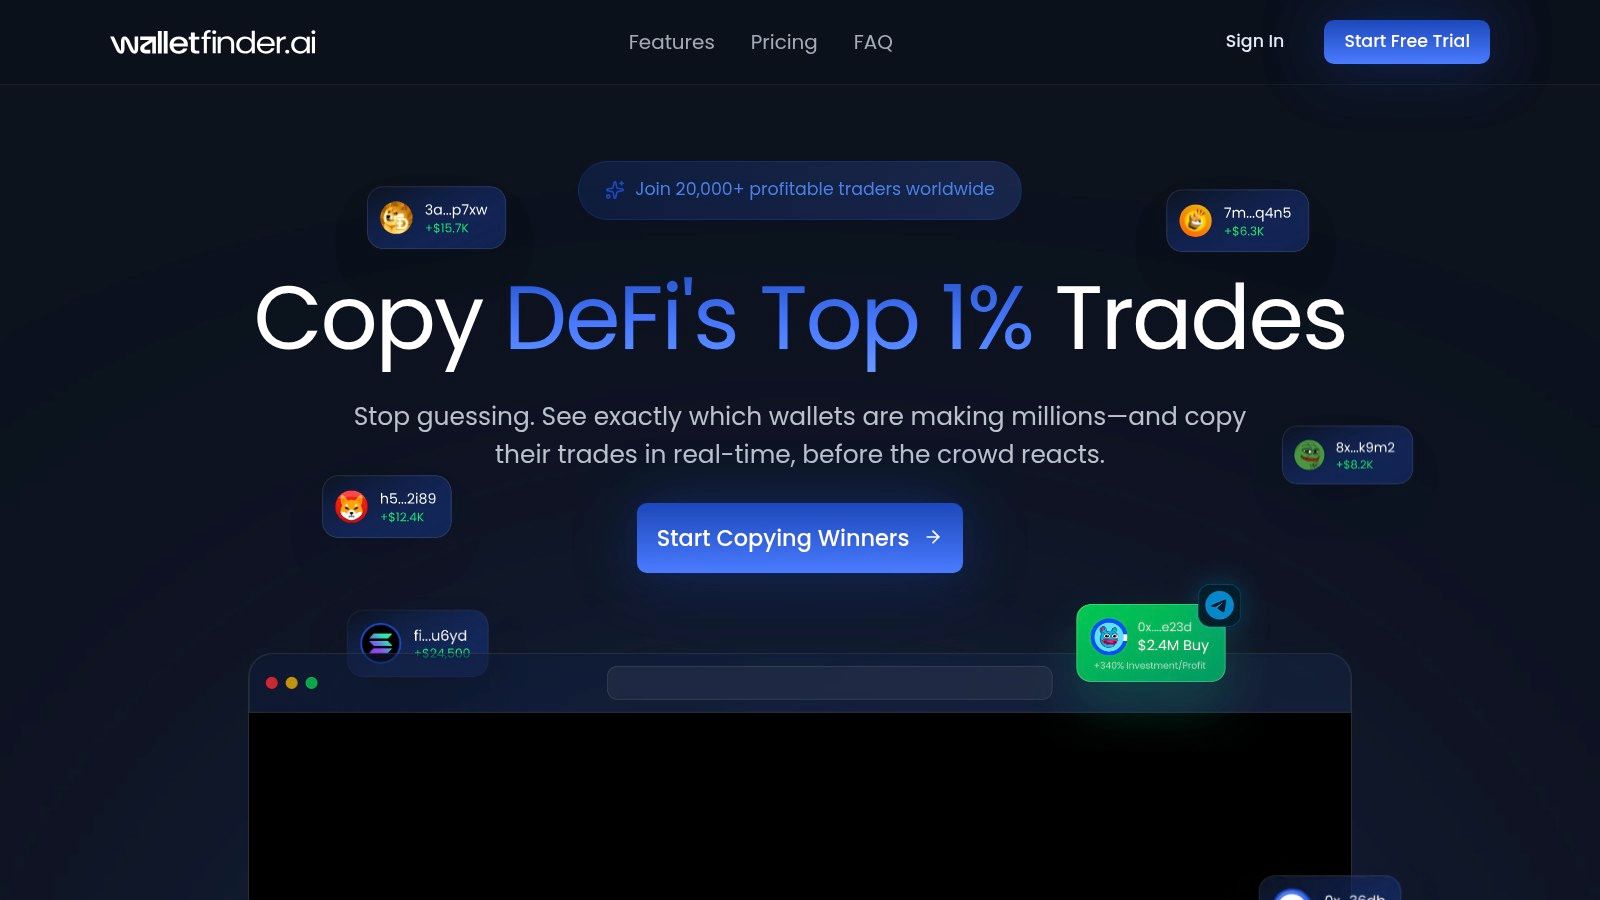
Wallet Finder.ai helps traders turn on-chain behavior into decisions they can act on. If you trade volatile tokens like XEN, use Wallet Finder.ai to discover profitable wallets, inspect full trading histories, monitor entry and exit timing, and get alerts when smart money starts moving.

A premier DeFi analytics platform empowering traders to discover and analyze profitable blockchain wallets, trades and tokens.

