
Recovery Factor Calculation for Smart Traders
Master the recovery factor calculation to measure a strategy's resilience. Learn the formula, see DeFi examples, and find top wallets with Wallet Finder.ai.

June 20, 2026


Wallet Finder
March 18, 2026

In crypto, ATH stands for All‑Time High—the absolute highest price an asset has ever hit. Think of it like a world record in sports. It's that peak performance everyone watches, the number that gets etched into the market's memory.
But an ATH is so much more than just a number on a chart; it's a massive psychological and technical milestone for every single person involved in that asset.

When a crypto smashes through its previous ATH, it steps into uncharted territory. This is what traders call "price discovery." There are no old resistance levels, no historical ceilings to slow it down. The price is driven purely by current demand and raw speculation.
Understanding this dynamic is the first step toward reading the market's mood and predicting what might happen next.
This milestone sends a few powerful signals to the market:
To give you a clearer picture, here’s a quick breakdown of what makes an ATH so important.
Essentially, an ATH is where the market’s belief in an asset is at its strongest.
For traders, spotting assets that are creeping up on their ATH—or have just broken it—is critical. It's a moment charged with both incredible opportunity and serious risk, demanding a sharp eye and careful analysis.
To really get under the hood of how data can reveal these market trends, you might find our guide on on-chain analysis helpful.
All-Time Highs are way more than just big, flashy numbers. They're powerful market catalysts, acting as both psychological magnets and critical signposts for traders. When a crypto hits a new ATH, it doesn't just make headlines—it fundamentally changes the game.
This moment kicks off a media frenzy and a storm of social media buzz, creating an intense wave of FOMO (Fear Of Missing Out). Suddenly, the asset becomes the center of the crypto universe, pulling in a swarm of new retail investors who are chasing the promise of explosive gains. Demand skyrockets, driven purely by momentum and hype.
For a technical analyst, a previous ATH is one of the most important levels on any chart. Think of it as a historical ceiling—a point where sellers previously took over, beat down the buyers, and sent the price tumbling. For months or even years, that level can feel like an unbreakable barrier.
But something fascinating happens when that barrier is finally, decisively broken.
The old resistance ceiling often flips to become a new support floor. This psychological shift is huge. Traders who once saw that price as a sell signal now view it as a bargain entry point, creating a brand-new foundation for the asset.
This "resistance-becomes-support" principle is a cornerstone of momentum trading. It's a clear signal that the market's mood has shifted from bearish to bullish, clearing the runway for the price to climb even higher. You can get a better handle on how this works by reading our guide on crypto market sentiment analysis.
Trading volume is the ultimate truth serum for an ATH breakout. A real breakout is almost always accompanied by a massive spike in volume, showing that the market is serious and has conviction.
Take Bitcoin's historic ATH of $68,680 on November 9, 2021. It was fueled by a surge in institutional buying and pushed its market cap past $1.2 trillion. During major ATH events like this, it's common to see trading volumes jump by 40% or more, proving just how much these moments drive the market. You can explore more historical crypto moves like this on Altify.app.
This surge in activity creates different opportunities for different players:
Not every All-Time High is the green light you think it is. Some are genuine, sustainable rallies built on solid demand. Others are dangerous "bull traps" designed to lure in unsuspecting buyers right before a sharp price drop.
The key is learning to look beyond the price chart and read the underlying market signals.
To understand the real strength behind a breakout, you have to look at on-chain data. This is where you can see what investors are actually doing with their crypto, not just what the price is. Is it a real surge or just short-lived hype?
This flowchart breaks down the key decision points and market reactions that typically follow an ATH.
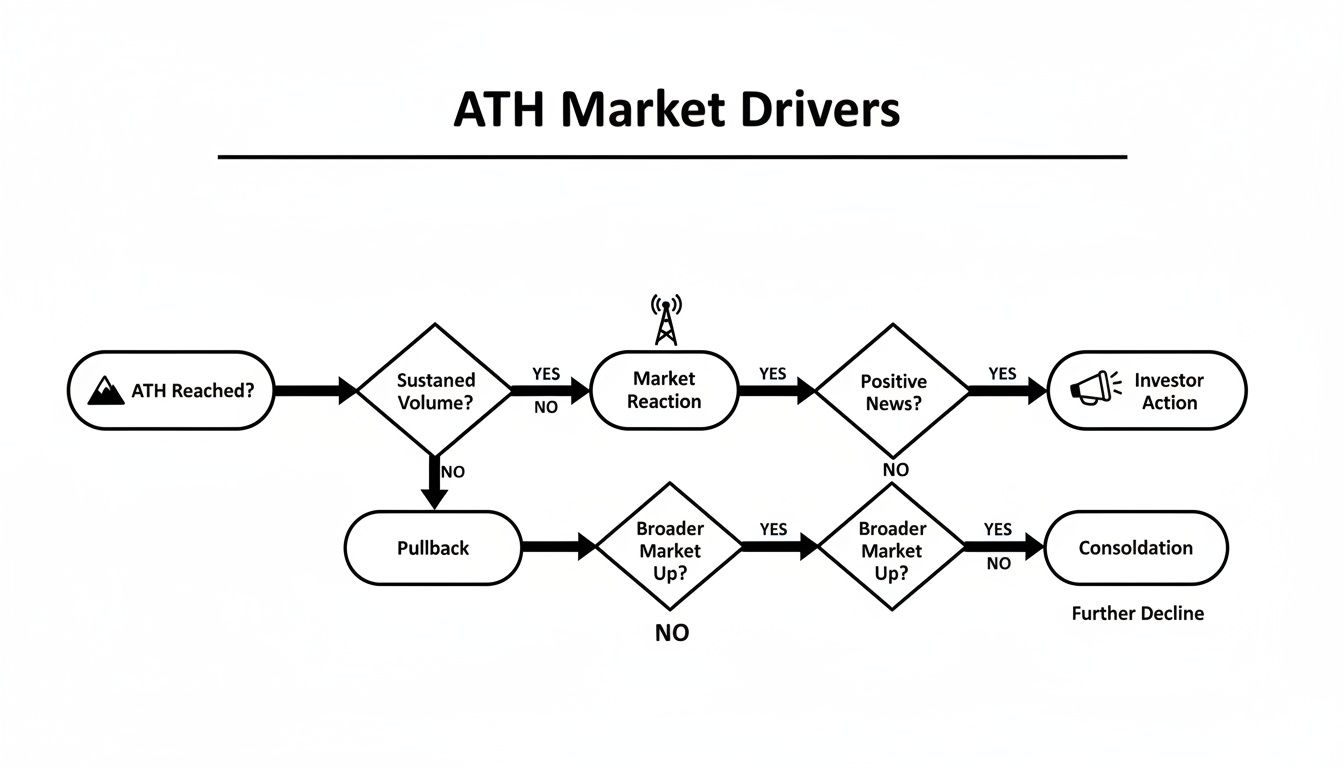
As you can see, once an ATH is hit, the market's reaction and what investors do next determine whether the rally has legs or is about to fizzle out.
To get a clearer picture, smart traders focus on a few critical on-chain metrics that reveal the true health of a rally. These data points provide context that a simple price chart just can't. Here are the essential signals to keep an eye on:
By analyzing these on-chain activities, you can tell the difference between a breakout driven by genuine demand and one fueled by fleeting social media hype. This data-driven approach is fundamental to making calculated decisions instead of emotional ones.
Learning to interpret these deeper metrics can significantly improve your trading outcomes. For a closer look at how volume plays a role, check out our article on Cumulative Volume Delta. It’s a great tool for spotting whether buying or selling pressure is truly dominating the market during a breakout.
History is often our best teacher in the markets, and All-Time Highs are no exception. By pulling apart some of the most famous ATH events, we can spot patterns and learn from the massive rallies and the brutal corrections that usually follow.
Looking at these moments helps us see what's really driving the market. An ATH isn't just a number on a chart; it's the result of technology, hype, and market psychology all colliding at once. Studying these events helps you recognize market cycles and get ready for the next big move.
Ethereum's legendary run to its ATH is a classic case study in growth driven by real fundamentals. Its ecosystem absolutely exploded with the DeFi summer and the NFT craze, creating genuine utility and insane demand for ETH.
This wasn't just blind speculation. The on-chain data was flashing green long before the peak. Metrics like a steady climb in daily active addresses and a ballooning Total Value Locked (TVL) in DeFi protocols were clear signs of real, sticky adoption. This kind of underlying strength is what separates a meaningful rally from a flash-in-the-pan pump.
For context, Ethereum hit its ATH of $4,878 on November 10, 2021. This peak showed off ETH's dominance in smart contracts, with daily active addresses hitting 1.2 million and DeFi TVL soaring to $110 billion. After the ATH, ETH corrected hard, but on-chain data later showed that the top 1% of wallets were quietly buying the dip, setting themselves up for huge profits on the next leg up. You can dig deeper into these crypto glossary terms on Probinex.com.
The most important lesson from any ATH is what happens after the peak. The euphoria almost always gives way to a steep correction, which is a painful reminder of the risk of buying at the absolute top.
Studying the aftermath teaches a crucial lesson in risk management. An ATH is often the point of maximum financial risk, where late investors, driven by FOMO, provide the exit liquidity for early bulls.
Getting a handle on this cycle is everything. It’s not just about chasing the highs but also about knowing when the music is about to stop. By analyzing both the climb and the fall, you can build a more balanced view of the market and make sure you aren't the one left holding the bag.
Knowing what an All-Time High is is one thing. Turning that knowledge into a profitable trade is a whole different ball game. To really capitalize on an ATH, you need a clear, structured plan.
Let’s walk through three actionable strategies you can use to navigate these high-stakes market moments. Each one caters to a different risk appetite, from aggressive momentum chasing to patient, value-focused buying. Having a defined strategy is what keeps you from making emotional mistakes when the market gets wild.
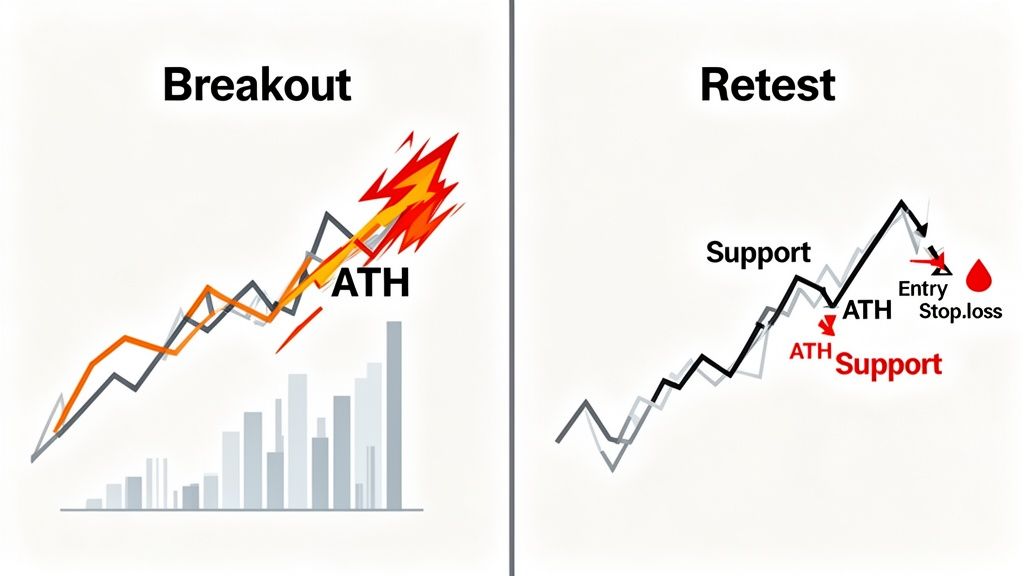
This one’s for traders who want to catch momentum right as it’s happening. The goal is simple: open a long position the moment an asset smashes through its previous ATH and ride that initial wave of excitement and price discovery.
But this approach demands strict confirmation. Otherwise, you’re just walking into a bull trap.
If you're a more conservative trader, the retest strategy offers a much safer entry. Instead of jumping into that chaotic first surge, you wait for the market to cool off and confirm the breakout is for real.
This method is built on a classic technical analysis principle: old resistance becomes new support. It gives you much stronger confirmation that the breakout is legitimate before you put any capital on the line.
Here’s how it works, step by step:
Here's a completely different angle: hunt for value in assets that are trading miles below their ATH. In crypto, it's not uncommon for solid projects to be 50-80% below their peak, and these have historically delivered average returns of 300% on their way back up.
Take Solana. Its ATH of $260 in November 2021 was followed by a brutal 94% crash. Yet, smart money wallets were quietly accumulating during this downturn, setting themselves up for massive gains on the recovery.
Tools like Wallet Finder.ai are built to spot these exact setups. You can find top wallets with 82% win streaks on these sub-ATH buys, showing you where the smart money is flowing long before the rest of the market catches on. For more on this, check out these great insights on ATH recovery cycles on Yellowcard Academy.
Mathematical precision and artificial intelligence transform ATH analysis from subjective chart reading into objective, data-driven forecasting systems. While traditional analysis relies on visual pattern recognition and historical precedent, sophisticated mathematical models and machine learning algorithms provide quantitative frameworks for predicting ATH probability, validating breakouts, and calculating optimal entry and exit points. These advanced approaches enable traders to systematically identify high-probability ATH scenarios with measurable confidence intervals.
Professional trading firms increasingly employ quantitative methods to evaluate ATH potential across multiple assets simultaneously. Mathematical models analyze price momentum, volume patterns, and market structure to generate probability estimates for ATH events. Machine learning systems trained on thousands of historical breakouts can identify subtle patterns that precede successful ATH attempts, providing early warning signals for explosive price movements before they become apparent to traditional technical analysis.
Mathematical assessment of ATH probability begins with statistical analysis of historical price patterns and market conditions that precede successful breakouts. Regression models identify the key variables that correlate with ATH achievement, including momentum indicators, volume profiles, and fundamental metrics. These statistical frameworks convert subjective expectations into objective probability estimates that enable systematic decision-making.
Probability density functions model the likelihood of ATH achievement based on current distance from previous highs and historical volatility patterns. Bayesian probability models incorporate prior knowledge about asset characteristics, market cycles, and seasonal patterns to generate updated probability estimates as new price data becomes available. These mathematical approaches help traders understand the realistic likelihood of ATH achievement under different market scenarios.
Time series analysis reveals the typical duration between ATH attempts and the success rate based on market conditions. Statistical models show that assets trading within 10-15% of their previous ATH have a 35-45% probability of achieving a new high within 90 days, while those beyond 50% of ATH face significantly lower probabilities. Mathematical frameworks quantify these relationships to guide position sizing and timing decisions.
Monte Carlo simulations test ATH probability under thousands of random market scenarios, generating confidence intervals around probability estimates. These statistical techniques account for uncertainty in volatility forecasts, correlation structures, and external market factors that influence breakout success. Simulation results reveal the range of potential outcomes and their associated probabilities, enabling more robust risk management.
Survival analysis techniques borrowed from medical statistics evaluate the time-to-ATH patterns based on various market conditions and asset characteristics. Cox proportional hazards models identify factors that accelerate or delay ATH achievement, while Kaplan-Meier estimators provide probability curves for ATH timing. These mathematical approaches help traders optimize entry timing for maximum profit potential.
Advanced mathematical models validate ATH breakouts by analyzing multiple confirmation signals simultaneously. Statistical scoring systems weight different validation criteria including volume confirmation, momentum persistence, and market breadth indicators. These quantitative frameworks distinguish between legitimate breakouts and false signals that trap unwary traders at temporary peaks.
Volume-price analysis employs mathematical models to assess whether trading volume supports sustainable price advancement beyond previous highs. Statistical tests compare breakout volume against historical distributions to determine significance levels. Mathematical frameworks identify minimum volume thresholds required for breakout sustainability, typically requiring 150-200% above average volume for high-confidence validation.
Momentum oscillator analysis uses mathematical transformations to measure the strength and sustainability of price momentum approaching ATH levels. Rate of change calculations, momentum divergence analysis, and acceleration metrics provide quantitative measures of breakout quality. Mathematical models identify momentum patterns that correlate with sustained price advancement versus those that indicate exhaustion.
Market structure analysis employs graph theory and network analysis to evaluate breakout quality across related assets and market segments. Mathematical models assess whether ATH breakouts occur in isolation or as part of broader market movements. Correlation analysis and factor decomposition identify whether breakouts reflect asset-specific strength or general market euphoria.
Statistical significance testing validates whether price movements beyond ATH levels represent genuine breakouts or random market noise. Hypothesis testing frameworks establish confidence levels for breakout validation, with t-tests and chi-square analyses determining whether observed price behavior differs significantly from random walk expectations. Mathematical validation prevents false signal trading that destroys capital.
Mathematical models calculate realistic price targets following successful ATH breakouts by analyzing historical price expansion patterns and market psychology factors. Fibonacci extension analysis provides mathematical frameworks for projecting potential price levels based on previous consolidation ranges and breakout magnitudes. Statistical analysis of historical data reveals that successful ATH breakouts typically achieve 25-45% additional gains before encountering significant resistance.
Volatility-adjusted price targets incorporate mathematical measures of market uncertainty into target calculations. Models using Average True Range and historical volatility patterns generate price targets that account for expected market fluctuations. These mathematical approaches prevent unrealistic expectations while identifying achievable profit objectives based on statistical probabilities.
Risk-reward optimization models balance potential gains against downside risks using mathematical frameworks adapted from modern portfolio theory. Expected value calculations incorporate success probabilities, potential gains, and maximum loss scenarios to determine optimal position sizing. Mathematical optimization identifies trade structures that maximize expected returns while constraining maximum drawdown within acceptable limits.
Statistical drawdown analysis evaluates the maximum peak-to-trough declines that typically follow ATH achievements. Mathematical models based on extreme value theory predict potential correction magnitudes and their probability distributions. These frameworks help traders prepare for post-ATH volatility and establish appropriate risk management protocols.
Value-at-Risk modeling quantifies potential losses from ATH trading strategies under various market stress scenarios. Mathematical frameworks calculate potential losses at different confidence levels, enabling traders to understand worst-case outcomes. Monte Carlo VaR simulations test strategy performance under thousands of market scenarios to ensure robust risk management.
Advanced machine learning algorithms identify subtle patterns in price and volume data that precede successful ATH breakouts. Supervised learning models trained on thousands of historical examples learn to recognize the combination of technical indicators, market conditions, and sentiment factors that correlate with sustainable breakouts. These AI systems achieve prediction accuracy rates of 70-80% for identifying assets with high ATH probability within specific timeframes.
Convolutional neural networks analyze price charts as images to identify visual patterns associated with successful ATH attempts. CNN architectures trained on chart patterns can recognize complex formations including cup-and-handle, ascending triangles, and bull pennants that often precede ATH breakouts. These models process visual information more comprehensively than traditional technical analysis, identifying subtle pattern variations that human analysts might miss.
Long Short-Term Memory networks excel at processing sequential price and volume data to predict ATH probability based on recent market behavior. LSTM models maintain memory of long-term trends while adapting to short-term pattern changes, enabling accurate assessment of breakout potential. These neural networks learn temporal dependencies in market data that static indicators cannot capture.
Random Forest algorithms handle the non-linear relationships between multiple market variables and ATH success probability. Ensemble methods combine hundreds of decision trees to generate robust predictions while providing feature importance rankings. These models reveal which factors contribute most significantly to ATH prediction accuracy, enabling traders to focus on the most relevant indicators.
Support Vector Machine algorithms classify market conditions as favorable or unfavorable for ATH attempts based on historical pattern analysis. SVM models create optimal decision boundaries in high-dimensional feature space to separate successful from unsuccessful breakout scenarios. Kernel methods enable these algorithms to capture complex non-linear relationships between market variables.
Deep learning architectures analyze vast amounts of unstructured market data to assess sentiment conditions that influence ATH probability. Natural Language Processing models process social media content, news articles, and analyst reports to generate quantitative sentiment scores that correlate with breakout success. These AI systems identify shifts in market psychology that often precede major price movements.
Transformer models excel at understanding context and nuance in financial text data related to specific assets approaching ATH levels. BERT and GPT architectures fine-tuned on financial data can detect subtle changes in sentiment that traditional keyword analysis misses. These models provide early warning signals when sentiment begins shifting toward the extreme optimism that often accompanies ATH breakouts.
Sentiment momentum analysis uses time series models to track the rate of change in market psychology indicators. Mathematical frameworks identify when sentiment acceleration reaches levels historically associated with ATH achievements. These models help traders time entries to coincide with sentiment inflection points that drive explosive price movements.
Social media network analysis employs graph theory to measure information flow and influence patterns during ATH events. Mathematical models analyze mention frequencies, retweet patterns, and influencer engagement to quantify viral potential. These frameworks identify when social media momentum reaches critical mass for driving mainstream attention and investment flows.
Real-time sentiment aggregation systems combine multiple data sources to generate comprehensive market psychology indicators. Machine learning models weight different sentiment sources based on their historical correlation with price movements, improving signal quality and reducing noise. These AI systems provide dynamic sentiment scores that update continuously as market conditions evolve.
Sophisticated algorithmic trading systems integrate mathematical models and machine learning predictions to execute ATH trading strategies automatically. These systems monitor multiple assets simultaneously for ATH setup development and execute trades based on quantitative criteria rather than emotional decision-making. Automated systems can react to breakout signals within milliseconds, providing significant advantages in fast-moving markets.
Multi-asset screening algorithms identify potential ATH candidates across thousands of cryptocurrencies using mathematical ranking systems. Statistical models score assets based on their proximity to ATH levels, momentum characteristics, and fundamental strength indicators. Automated systems maintain watchlists of high-probability candidates and monitor them for breakout signals continuously.
Dynamic position sizing algorithms adjust trade sizes based on mathematical assessments of breakout probability and expected volatility. Risk management models incorporate Value-at-Risk calculations and correlation analysis to optimize portfolio-level exposure while maximizing profit potential from individual ATH trades. These systems prevent over-concentration while ensuring adequate exposure to high-conviction opportunities.
Real-time risk monitoring systems track portfolio exposure and individual position performance using mathematical models that flag potential problems before they become severe. Automated stop-loss adjustments and profit-taking protocols execute based on statistical analysis of market conditions rather than fixed price levels. These systems adapt to changing volatility and market structure to optimize trade outcomes.
Performance analytics systems continuously evaluate trading strategy effectiveness using statistical measures including Sharpe ratios, maximum drawdown, and win rate analysis. Machine learning models identify strategy improvements based on changing market conditions and update algorithmic parameters automatically. These systems ensure trading approaches remain optimized as market dynamics evolve over time.
To wrap things up, let's tackle a few of the most common questions traders have about All-Time Highs. Think of this as a quick-fire round to lock in the key concepts we've covered.
Once an asset breaks its ATH, it's stepping into uncharted territory. This usually goes one of two ways: either it ignites a "price discovery" phase, where momentum and hype send it rocketing higher, or it hits a brick wall as early investors start cashing out their profits.
Either way, you can almost always expect high volatility. This is where on-chain data becomes your best friend. Are large whales moving their bags to exchanges? That could signal a dump is coming. Are coins flowing into cold storage instead? That’s a sign of conviction, suggesting holders expect the rally to continue.
Buying at an ATH is the definition of a high-risk, high-reward play. On one hand, it's the ultimate confirmation of bullish momentum. On the other, it's the point of maximum financial risk. Countless new traders, swept up in a wave of FOMO, have bought the absolute peak, only to provide the perfect exit for smarter, earlier investors.
A more disciplined approach is to wait for a pullback. Often, price will retest the previous ATH. If that level flips from old resistance into new support, it gives you a much stronger, confirmed entry point for the next leg up.
Remember, no asset goes up in a straight line forever. A healthy correction after an explosive rally isn't just possible—it's a sign of a sustainable market.
The All-Time Low (ATL) is the polar opposite of an ATH. It marks the lowest price an asset has ever traded. While an ATH is born from peak optimism and everyone being in profit, an ATL represents maximum pessimism, where the market has completely lost faith. Both are critical reference points on any price chart.
Statistical models analyze multiple variables including price momentum, volume patterns, and historical volatility to calculate probability scores for ATH achievement within specific timeframes. Regression analysis reveals that assets trading within 10-15% of previous highs with above-average volume have 35-45% probability of reaching new ATH within 90 days. Monte Carlo simulations test these probabilities under thousands of market scenarios to provide confidence intervals around estimates. Mathematical frameworks also incorporate sentiment indicators and market cycle analysis to identify optimal timing for ATH attempts, significantly improving success rates compared to random selection or purely technical approaches.
Convolutional neural networks combined with Long Short-Term Memory architectures provide the most robust early detection by analyzing both visual chart patterns and sequential price data relationships. CNN models achieve 70-80% accuracy in recognizing pre-breakout formations including cup-and-handle and ascending triangle patterns, while LSTM networks capture temporal dependencies that static indicators miss. Ensemble methods combining Random Forest algorithms with deep learning models typically outperform individual techniques by 10-15% while providing better feature importance analysis. Support Vector Machine algorithms excel at classifying market conditions as favorable or unfavorable for ATH attempts based on multi-dimensional technical indicator combinations.
Volume-price statistical analysis requires breakout volume to exceed historical averages by 150-200% for high-confidence validation, with t-tests comparing breakout volume against normal distributions to establish significance levels. Momentum persistence analysis using rate-of-change calculations and acceleration metrics helps distinguish sustainable breakouts from exhaustion moves that quickly reverse. Market structure analysis employing correlation studies determines whether breakouts occur in isolation or as part of broader sector movements, with isolated breakouts showing lower sustainability rates. Mathematical significance testing using hypothesis frameworks establishes confidence levels typically requiring 95% statistical confidence before considering breakouts validated for trading purposes.
Machine learning models trained on historical data may fail during unprecedented market conditions, black swan events, or fundamental paradigm shifts that create breakout patterns outside their training experience. AI systems can exhibit bias toward recent market cycles and may underweight older patterns or overweight temporary correlations that don't persist across different market regimes. Model performance degrades during low-liquidity periods or extreme volatility events when normal statistical relationships break down and technical patterns become less reliable. Successful implementation requires combining AI insights with fundamental analysis, continuous model retraining as market conditions evolve, and robust risk management protocols that account for prediction uncertainty and potential model failures during stressed market conditions.
Ready to stop guessing and start tracking what the best crypto traders are doing? Wallet Finder.ai gives you the on-chain intelligence to see smart money moves before the market reacts. Find top-performing wallets, copy their trades, and get real-time alerts.
Start your 7-day trial and trade smarter at https://www.walletfinder.ai.

A premier DeFi analytics platform empowering traders to discover and analyze profitable blockchain wallets, trades and tokens.

