
Recovery Factor Calculation for Smart Traders
Master the recovery factor calculation to measure a strategy's resilience. Learn the formula, see DeFi examples, and find top wallets with Wallet Finder.ai.

June 20, 2026


Wallet Finder
June 16, 2026
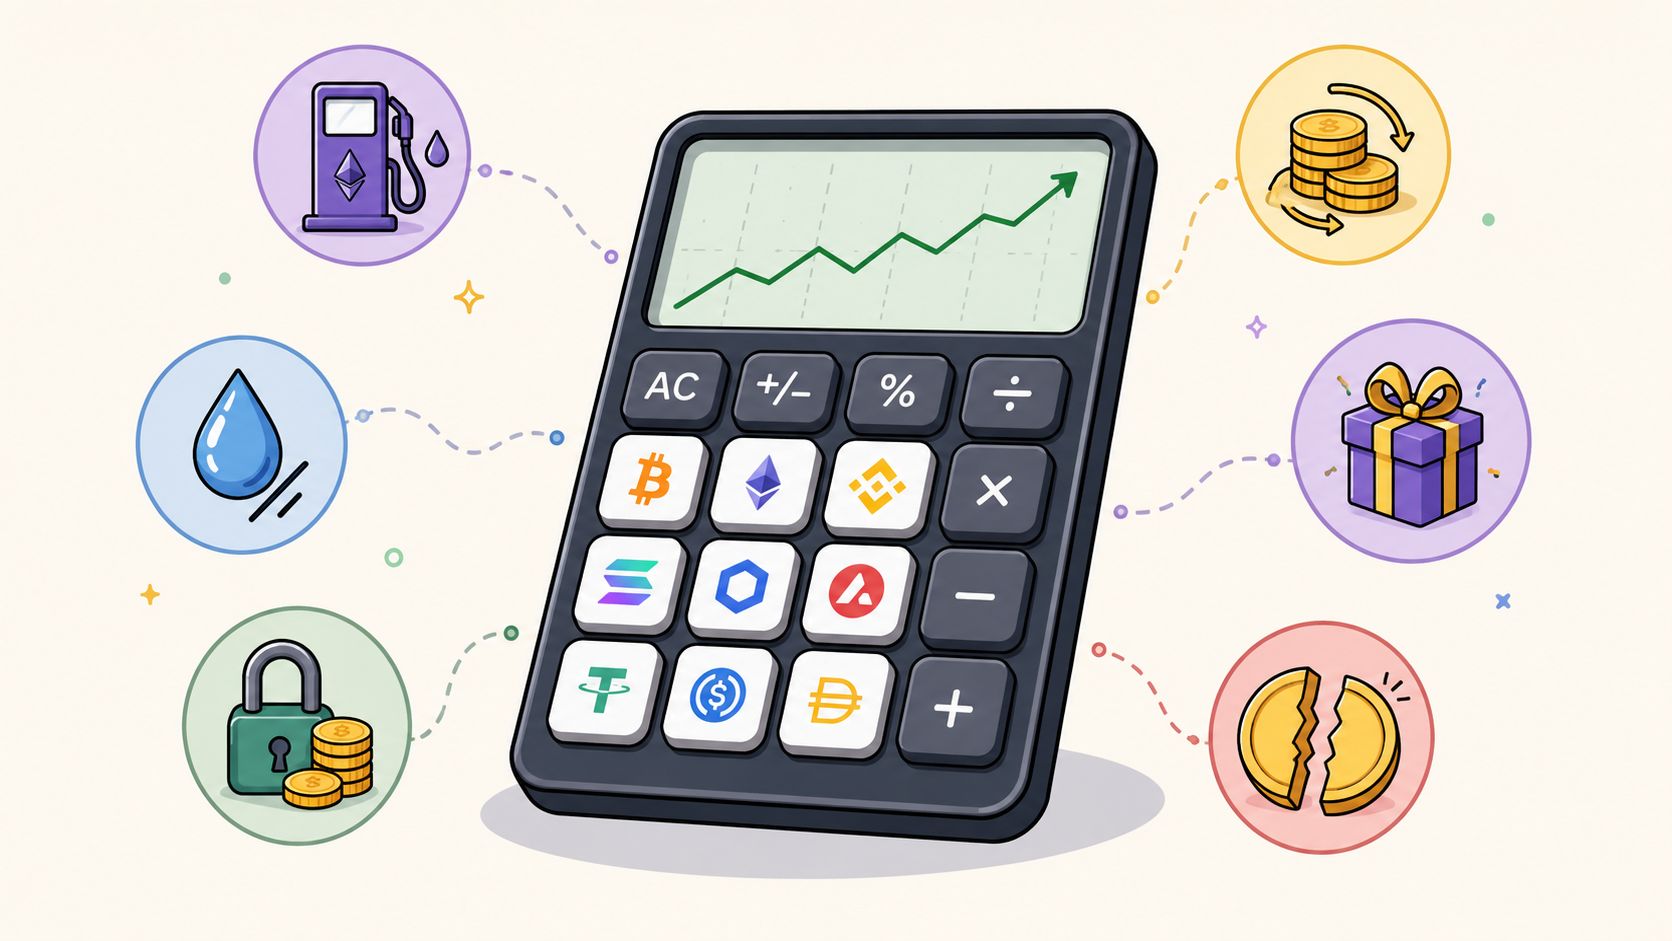
You open a crypto return calculator, plug in your buy price and your current price, and get a nice green number. Then you look at your wallet and think, that can't be right.
You paid gas to bridge. You swapped on a DEX and ate slippage. You moved part of the position into staking, claimed rewards, got a random airdrop, and sold only a slice of the bag. If you provided liquidity, you may also be carrying impermanent loss that never shows up in a basic ROI widget. The calculator says profit. Your actual wallet activity says the answer is messier.
That's the core problem with most crypto return calculator tools. They're built for a clean before-and-after trade. Real crypto portfolios rarely stay clean for long, especially in DeFi.
You buy a token, add more on a pullback, move part of it into a farm, claim rewards two weeks later, and sell a quarter after a strong move. A simple profit calculator still wants one entry price and one exit price. That mismatch is why the number on the screen often has little to do with the PnL in your wallet.
Basic calculators reduce trading to a clean round trip. DeFi rarely stays clean. Once a position passes through bridges, swaps, staking contracts, LP pools, and partial exits, your return depends on a chain of transactions, each with its own cost and timing.
The first mistake is treating headline gain as usable profit. A token can be up from your first buy while your net result is flat or negative because the position was built in stages, trimmed in stages, and chipped away by execution costs.
This gap usually becomes obvious after a period of active onchain trading. The wallet balance, token balances, and cash flows stop lining up with the neat number from a basic calculator because the calculator ignored the path you took to get there.
That path matters. If you paid to bridge, lost value on slippage, earned rewards in a second token, and exited only part of the position, then your return is not one percentage. It is a ledger problem.
Practical rule: If a calculator cannot show how it treated fees, slippage, partial disposals, rewards, and multiple entries, use the output as a rough reference, not a decision-grade PnL figure.
Simple ROI tools still have a place for quick checks. They break down fast for active DeFi wallets, where profit is shaped less by a single price move and more by the accumulated effect of every transaction.
Before criticizing a crypto return calculator, it helps to define what these tools usually measure.
ROI is the simplest metric.
(Current Value - Initial Investment) / Initial InvestmentIt tells you whether a position is up or down relative to what you put in.
PnL usually means profit and loss in absolute terms.
Current Value - Cost Basis for unrealized PnLAPY shows yield on assets that generate returns through staking, lending, or vault strategies. In practice, APY is useful for understanding expected yield mechanics, but it doesn't tell you your full portfolio result when token prices, entry timing, and fees move around.
A visual summary helps:
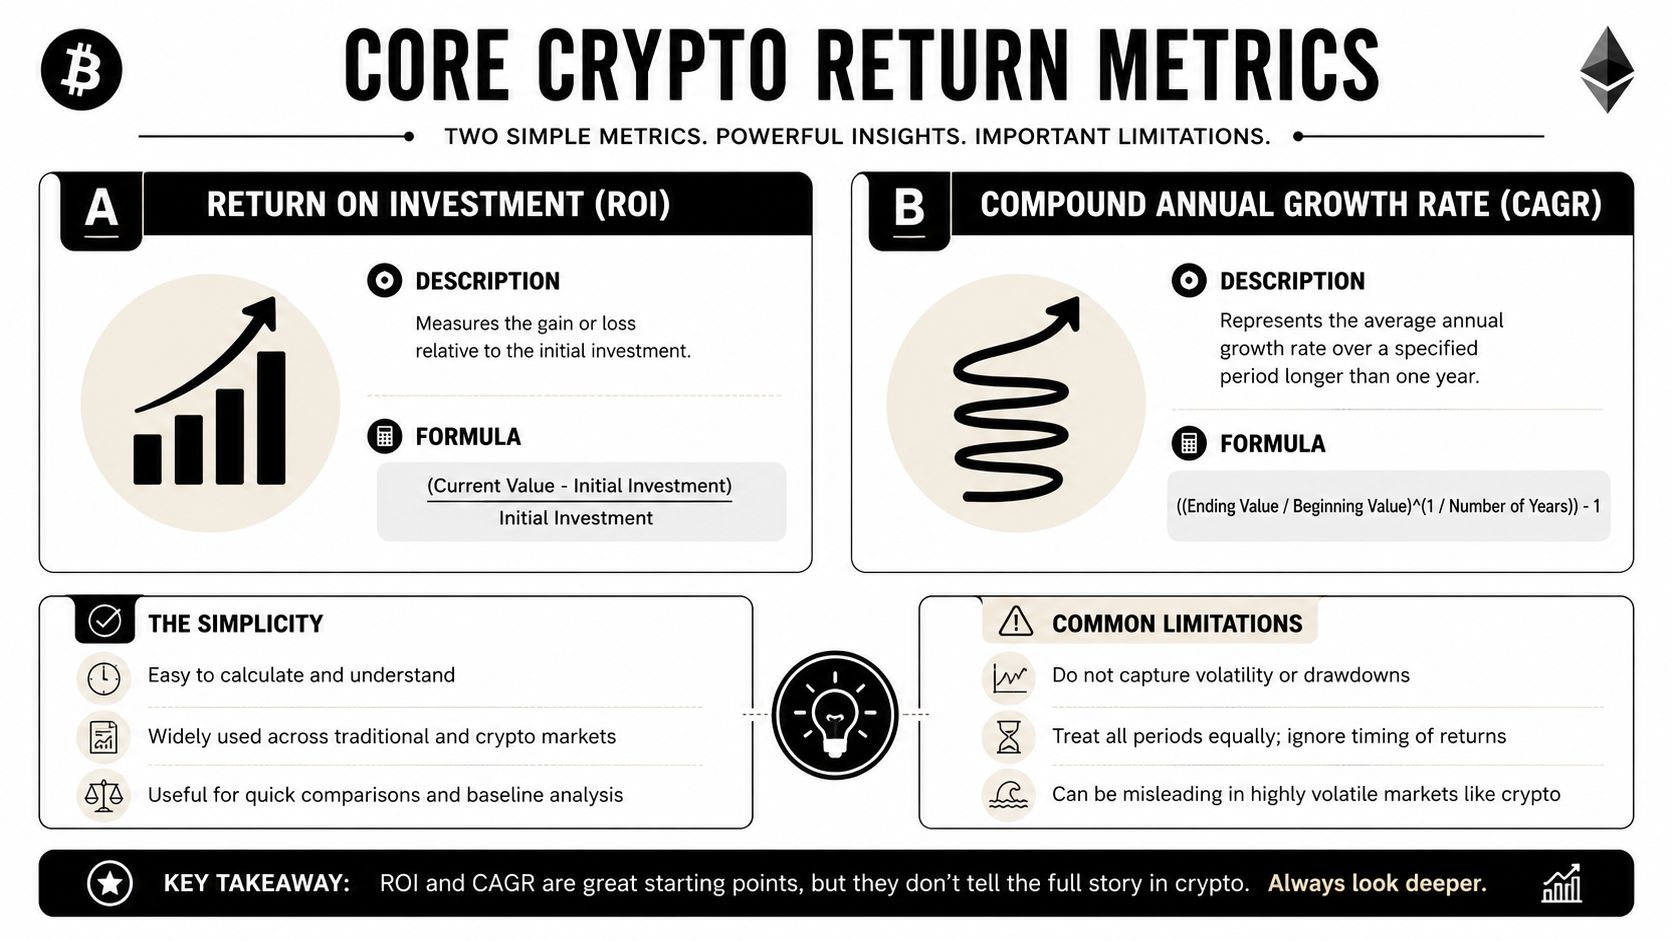
These metrics are fine as labels. The problem is how people use them.
A basic ROI calculator assumes your strategy can be reduced to a single entry and a single exit. That's rarely how people build positions. They average in. They trim into strength. They buy after a dip. They rebalance after a run.
Most pages present a single entry price and exit price, but many users follow strategies like DCA or SIP. A simplistic calculator can overvalue one lucky entry, while a more useful benchmark is a strategy-aware backtest that compares lump-sum, DCA, and staggered exits on the same asset history, as acknowledged by CoinStats in its crypto return calculator context.
Here's a simple comparison of why the same asset can produce very different interpretations:
| Scenario | What a simple calculator sees | What actually matters |
|---|---|---|
| Lump-sum buy and full exit | One clean ROI number | Fine for a simple trade |
| DCA across multiple dates | One average entry, if you calculate it manually | Timing path matters, not just endpoint |
| Partial sells | Often ignored | Realized gains differ from remaining unrealized PnL |
| Staggered exits | Usually flattened into one sale | Exit timing changes outcome materially |
A calculator that only rewards the best single entry can make an average strategy look worse than it was, or make a lucky trade look more repeatable than it is.
For active traders, the right question usually isn't “What's the return if I bought once and sold once?” It's “What did this strategy produce after the path, not just the endpoint?” That's a different class of tool.
You swap into a token, bridge to another chain, stake it for yield, claim rewards twice, then unwind part of the position a week later. The token is up, but your PnL often is not.
DeFi adds friction at every step, and simple calculators flatten all of it into one entry price and one exit price. That misses the costs that decide whether a trade was good, mediocre, or a slow leak.
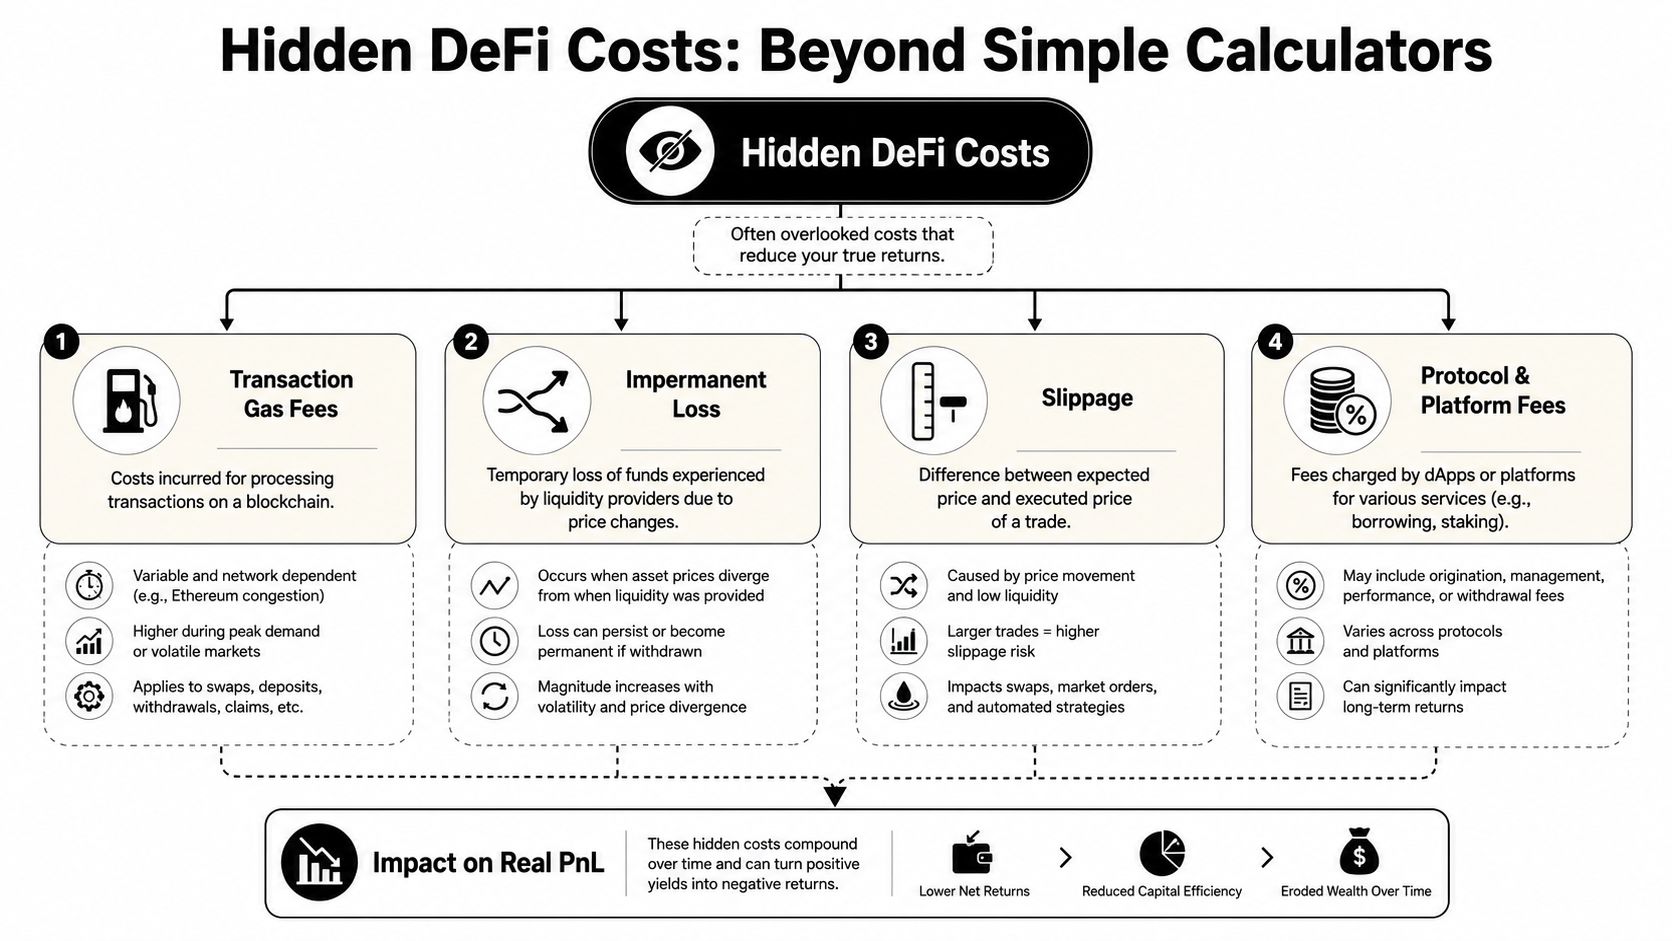
On-chain fees are rarely a single deduction. They stack across the full lifecycle of a position.
A trader who pays gas five times on a medium-sized position can give up a meaningful share of the return before price is even part of the story. Cost basis and net proceeds both move, so the result changes on both sides of the ledger.
If gas is one of your biggest blind spots, a dedicated gas fee estimator for DeFi transactions is a better planning tool than guessing from memory after the fact.
The quote on a DEX is only a starting point. Your fill depends on pool depth, volatility, your order size, and what happens in the block before execution.
That difference gets ignored constantly. Traders remember the displayed price, then record that number in a spreadsheet, even though the wallet received less on entry or less on exit. In thin pools, that gap can matter more than the headline move in the token itself.
This gets worse in memecoins, low-liquidity pairs, and fast markets where execution quality is part of the trade, not an afterthought.
Extra tokens feel like pure upside until you try to track them properly.
Staking rewards, farming incentives, rebases, and airdrops all create new acquisition events. Each one needs a timestamp, amount, source, and a consistent basis method if you want clean realized and unrealized PnL later. Miss one claim or one auto-compound cycle, and the position history stops lining up.
A practical way to classify them:
If you cannot trace how a token entered the wallet, you usually cannot measure its return with confidence.
That reconciliation problem shows up fast once assets move between wallets, exchanges, vaults, and tax tools.
A short walkthrough of these hidden frictions is worth watching before you trust any oversimplified result:
LP positions fool a lot of traders because the wallet balance can grow while the strategy still underperforms a simple hold.
Impermanent loss is the performance gap between providing liquidity and holding the underlying assets separately over the same period. If one asset runs hard, the pool keeps rebalancing you out of the winner and into the laggard. Trading fees and incentives can offset that, but they do not erase it by default.
Basic ROI tools do not model that comparison. They also do not show how gas, slippage, and reward claims interact with LP returns. Real DeFi PnL needs event-level tracking across every wallet action. That is the only way to separate price gains from execution drag, fee leakage, and LP rebalancing.
Let's walk through a realistic manual example. No big numbers, just the structure. That's enough to show why spreadsheets get painful quickly.
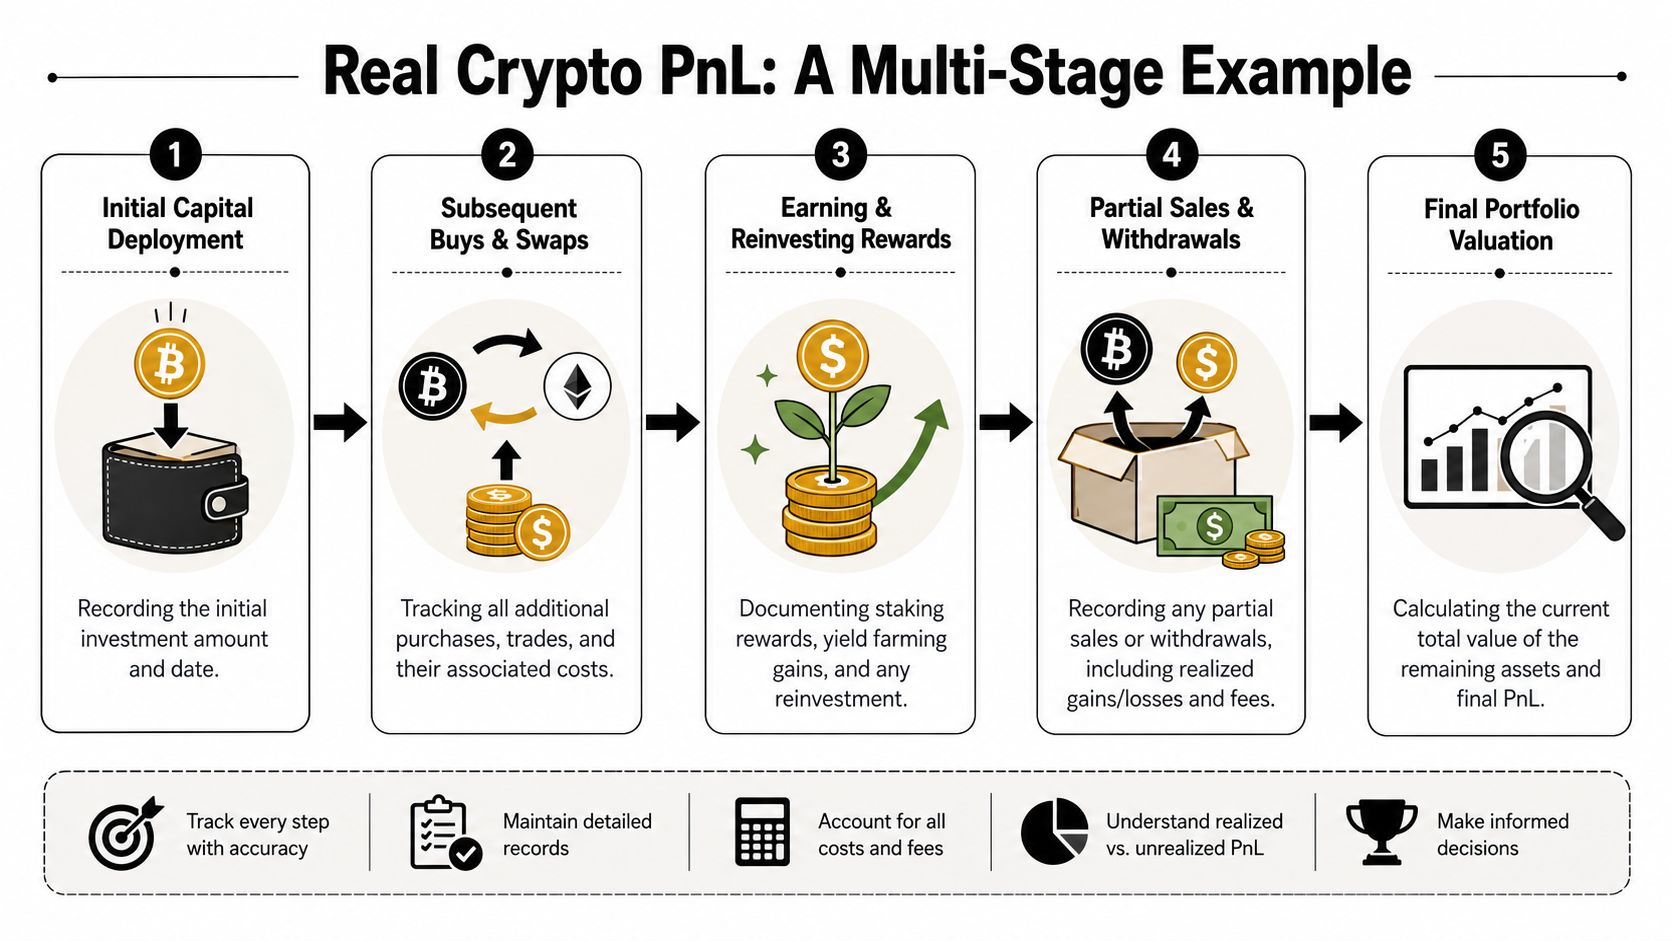
Assume a trader does the following:
That sounds manageable until you try to calculate both realized and unrealized PnL correctly.
Start with the initial ETH purchase. Your first task is to record the acquisition cost and any fees tied to obtaining the position. That forms the opening cost basis.
Next, you move part of that ETH into a staking or LP strategy. At this point, many traders stop treating the position cleanly because the asset leaves the “simple hold” bucket. But from a tracking perspective, you now need to log:
Then rewards arrive. If you claim them, that creates a new asset receipt event. If you auto-compound them, you now have another layer, because the reward was earned and then redeployed.
An airdrop makes it even more awkward. The token wasn't purchased in the same way as the original ETH position, but if you later sell it, you still need a transaction history that explains where it came from and when.
Finally, you sell only a portion of your ETH. That means you must allocate basis to the sold amount and leave the rest attached to the unsold amount. At this stage, most manual sheets start breaking apart.
The hard part isn't the formula. The hard part is assigning the right history to each piece of the position after several on-chain events.
Use a ledger-style table, not a single ROI cell.
| Date | Action | Asset | Amount | Cost/Proceeds (USD) | Fees (USD) | Adjusted Cost Basis |
|---|---|---|---|---|---|---|
| Buy | ||||||
| Transfer / Bridge | ||||||
| Stake / Deposit | ||||||
| Claim Reward | ||||||
| Receive Airdrop | ||||||
| Partial Sell |
This is the minimum needed to rebuild the position later.
If you're averaging entries over time, an average price calculator for crypto positions helps with one narrow part of the job. It does not replace full PnL tracking, but it does reduce one common source of error.
Manual calculation usually goes wrong in one of four places:
A simple crypto return calculator won't save you here. At best, it gives you a quick directional estimate. Once the position passes through DeFi, you need a transaction ledger and a consistent method.
Good tracking habits matter more than a prettier dashboard. If the raw data is messy, the return calculation will be messy too.
Most traders wait until they need taxes, a performance review, or a post-mortem on a bad month. By then, they're reverse-engineering activity from wallet explorers and exchange exports. That's slow, and it leads to bad assumptions.
One of the best habits is using different wallets for different jobs.
That simple separation makes analysis easier. You can tell whether the PnL came from directional trades, yield farming, or random token drift.
A transaction history without labels turns into archaeology.
Use notes, exports, or tracker tags for things like bridge, transfer, reward claim, LP deposit, and internal wallet movement. The goal isn't bureaucracy. The goal is preventing future-you from guessing.
A dedicated DeFi portfolio tracker for multi-wallet activity is useful because it keeps these actions visible in one place instead of scattering them across explorers and exchange histories.
Summaries are helpful for a quick glance. They're terrible for reconciliation.
Keep:
Clean records don't just help with taxes. They help you figure out which strategies actually worked and which ones only looked good on a chart.
The traders who stay sharp over time usually aren't better because they memorize more formulas. They're better because they maintain cleaner inputs.
At some point, a manual crypto return calculator stops being a calculator problem and becomes a data problem.
The issue isn't that you don't know the ROI formula. It's that your real portfolio includes swaps, fees, partial exits, wallet transfers, token approvals, LP positions, and strategy changes across chains. You need a system that ingests activity as it happens and turns it into usable analysis.
That's where a platform-level approach changes the game.

A serious PnL and wallet analysis tool should help you:
That last point is where most generic portfolio apps fall short. They can tell you what happened in your wallet. They usually can't help you discover who is trading well on-chain, how they size positions, when they enter, or whether their results look repeatable.
If you copy trade, research smart money, or study high-performing wallets, return calculation isn't only about your portfolio. It's also about benchmarking other traders.
You want to know whether a wallet's performance came from one lucky entry or from a repeatable pattern across multiple trades. You want to see if they average in, cut quickly, rotate aggressively, or hold through volatility. A basic ROI widget can't answer any of that.
A dedicated analytics engine can.
The practical benefit is clarity. Instead of juggling spreadsheets, explorers, and rough estimates, you get a cleaner view of wallet history, PnL behavior, and strategy quality in real time.
A simple crypto return calculator is fine for a simple question. Buy once, sell once, no side activity. That's not how most serious crypto portfolios behave.
Once you add DeFi, the clean formula breaks. Gas changes cost. Slippage changes execution. Rewards and airdrops create new events. Partial sells split basis. LP positions introduce trade-offs that a headline ROI number can't see.
That's why the gap between “my calculator says I'm up” and “my wallet doesn't feel up” shows up so often. The calculator is answering a narrower question than the one that matters to you.
The practical fix is straightforward:
If you trade actively, copy wallets, or rotate through DeFi, this isn't optional. Better return analysis leads to better risk decisions, better strategy review, and fewer false positives from lucky entries.
If you want to move beyond rough ROI snapshots, Wallet Finder.ai gives you a stronger way to analyze real on-chain performance. It helps you track wallets, study full trading histories, inspect PnL behavior, and discover profitable wallets, trades, and tokens across major ecosystems so you can stop guessing and start working from actual wallet data.

A premier DeFi analytics platform empowering traders to discover and analyze profitable blockchain wallets, trades and tokens.

