
Recovery Factor Calculation for Smart Traders
Master the recovery factor calculation to measure a strategy's resilience. Learn the formula, see DeFi examples, and find top wallets with Wallet Finder.ai.

June 20, 2026


Wallet Finder
June 17, 2026
A wallet can look brilliant for months, then hand back most of its gains in a few ugly sessions. That's the part many DeFi traders learn too late. The equity curve looks smooth enough on social posts, the realized wins look impressive, and the copied entries feel smart until the strategy hits stress.
What matters then isn't the screenshot. It's how deep the strategy falls, how long it stays underwater, and whether you still have the nerve and capital to stick with it. That's where drawdown analysis stops being theory and starts becoming survival.
A rising PnL chart hides a lot. It hides the path. It hides the pain between peaks. It hides whether the trader made money cleanly or only by absorbing repeated air pockets that would've forced most followers out at the worst moment.
I've seen traders fixate on total return and ignore how that return was earned. That's backwards. In crypto, two wallets can finish in roughly the same place while taking very different roads. One compounds through controlled pullbacks. The other survives only because it happened to catch a late winner after a stretch of brutal underwater trading.
A wallet with a flashy top-line gain can still be a bad copy-trading candidate if its history includes:
PnL is a summary. Risk lives in the path.
If you're already looking at realized gains and wallet performance, pair that with a proper profit and loss analysis workflow. A gain without context is marketing. A gain with drawdown context is decision-useful.
A wallet isn't safe because it finished green. It's safer only if it stayed survivable on the way there.
The question isn't "Did this wallet make money?"
The question is "What did it demand from the person following it?"
If the answer is repeated panic, forced exits, and long recovery waits, then the PnL chart is flattering a strategy difficult to maintain through live conditions. Drawdown analysis corrects that distortion. It tells you the historical worst pain, the time profile of that pain, and whether the wallet's style fits your capital preservation rules.
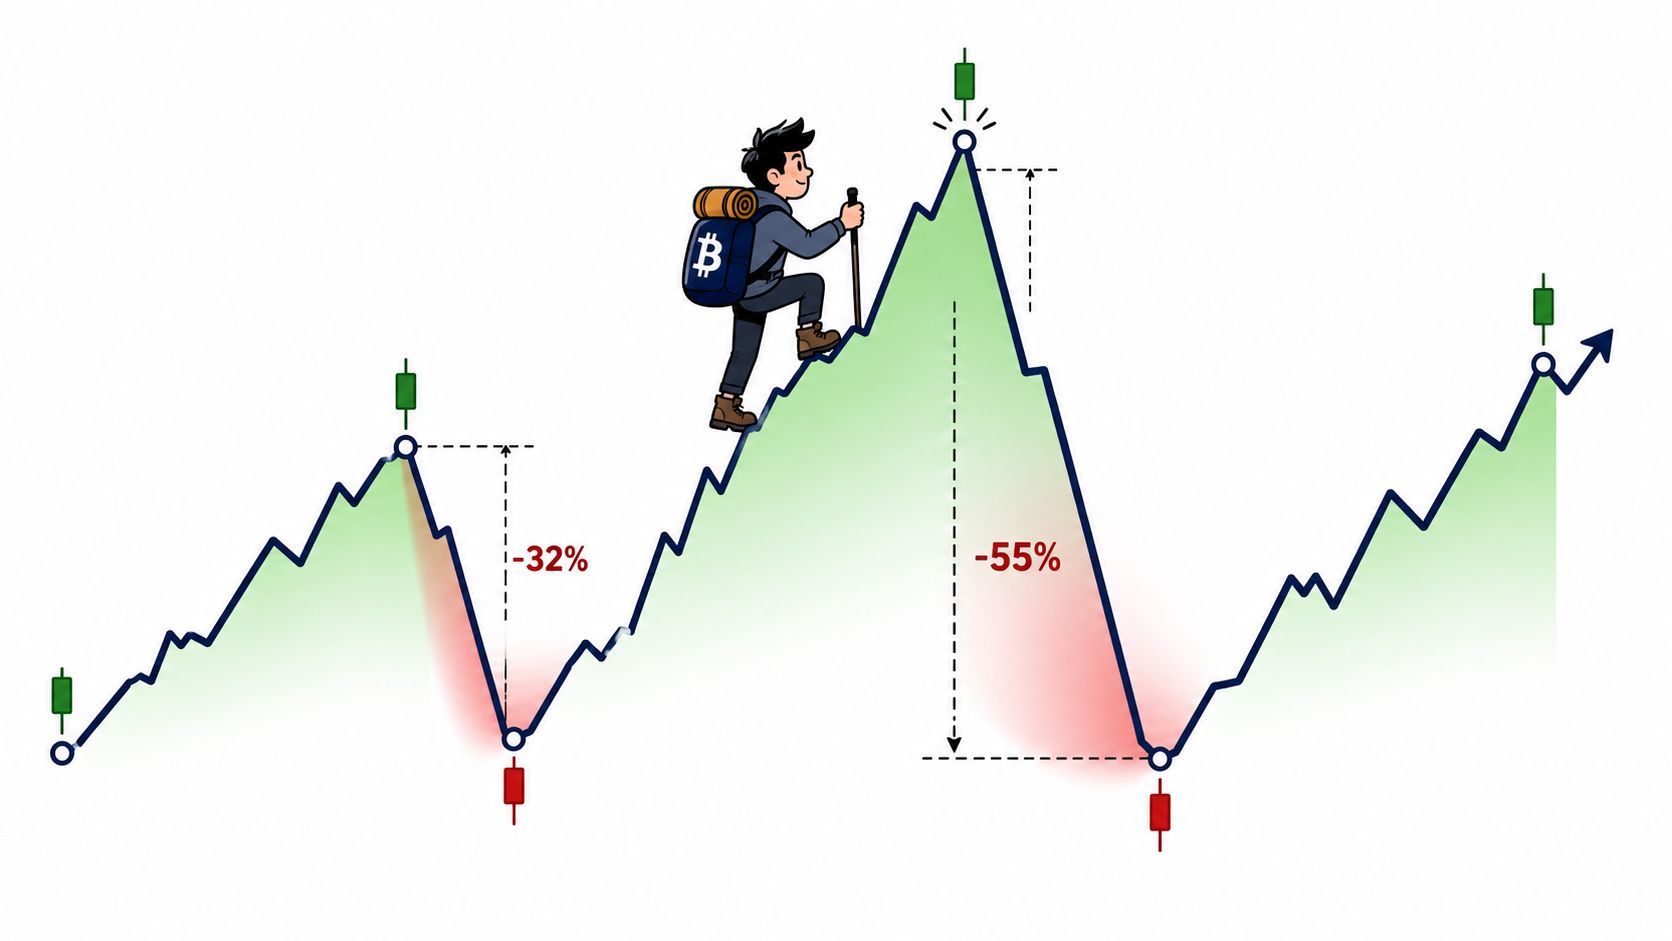
Drawdown analysis is easiest to understand if you think like a mountain climber. Your portfolio climbs to a summit, drops into a valley, and then either climbs back to the old summit or finds a new one later. The key risk question is simple. How deep was the valley, and how long were you stuck in it?
Core definition: Maximum drawdown is the historical worst-case pain a strategy imposed from a prior high to a later low.
That last point matters because maximum drawdown is the largest observed decline from a portfolio's peak to its subsequent trough, and it's measured over a specific period, not as some timeless property of the strategy. In practice, a 25% maximum drawdown means the asset fell one-quarter from its highest recent value. Robeco's explanation also highlights Morgan Stanley's recovery framing: about four in five stocks with a 0–50% drawdown eventually regain their prior peak, while only about one in six stocks that fall 95–100% do so (Robeco on maximum drawdown and recovery odds).
Most traders stop at the size of the drop. Professionals don't.
A complete drawdown analysis also looks at the shape of the event:
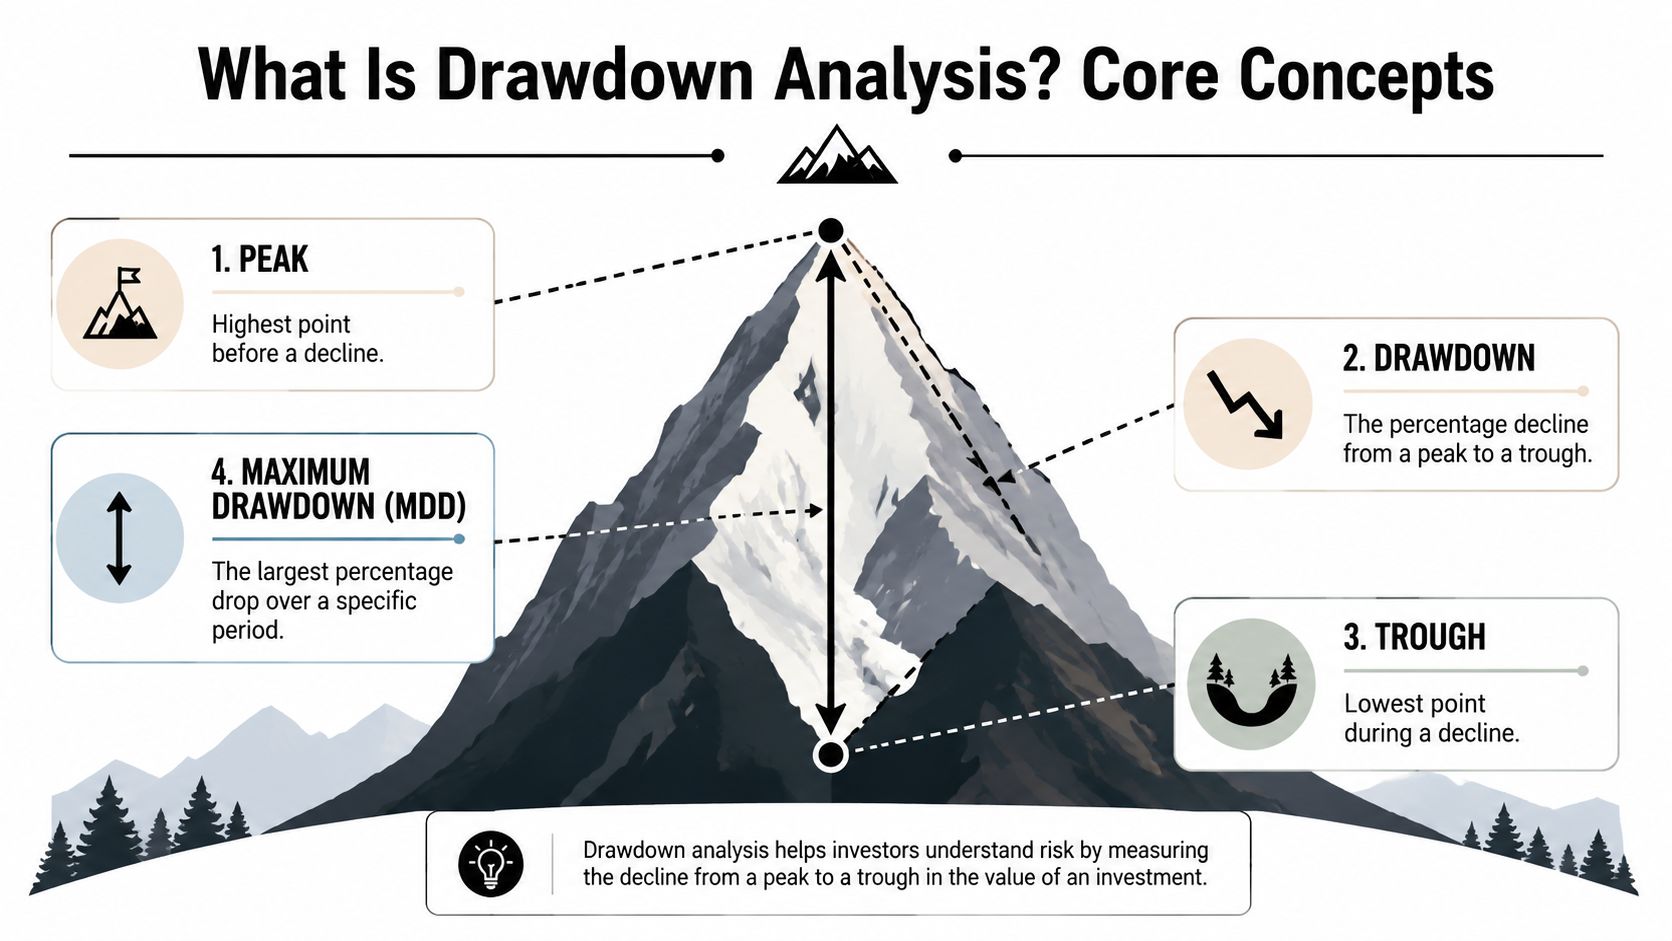
| Term | What it tells you | Why it matters in trading |
|---|---|---|
| Current drawdown | How far below the latest peak you are now | Helps judge live stress, not just history |
| Drawdown length | How long the portfolio stayed underwater | Shows how much patience the strategy demands |
| Recovery period | How long it took to reclaim the old peak | Reveals whether losses heal fast or linger |
| Path or cadence | How the losses arrived over time | Distinguishes grind-downs from sudden breaks |
This matters more on-chain than in textbook portfolio examples. Wallets don't trade in neat monthly intervals. They rotate fast, size inconsistently, and can look stable until a bad sequence hits an illiquid market.
If you're evaluating a wallet to follow, maximum drawdown is your first filter, not your final answer. It tells you the worst historical hole. Duration and recovery tell you what kind of person has any chance of surviving that hole without making a bad decision in the middle of it.
Drawdown analysis gets useful when you stop treating it as a label and start calculating it directly from a wallet equity series. You don't need institutional software for that. You need a clean sequence of portfolio values over time and a few straightforward formulas.
Use these in order:
Running peak
Track the highest portfolio value seen so far.
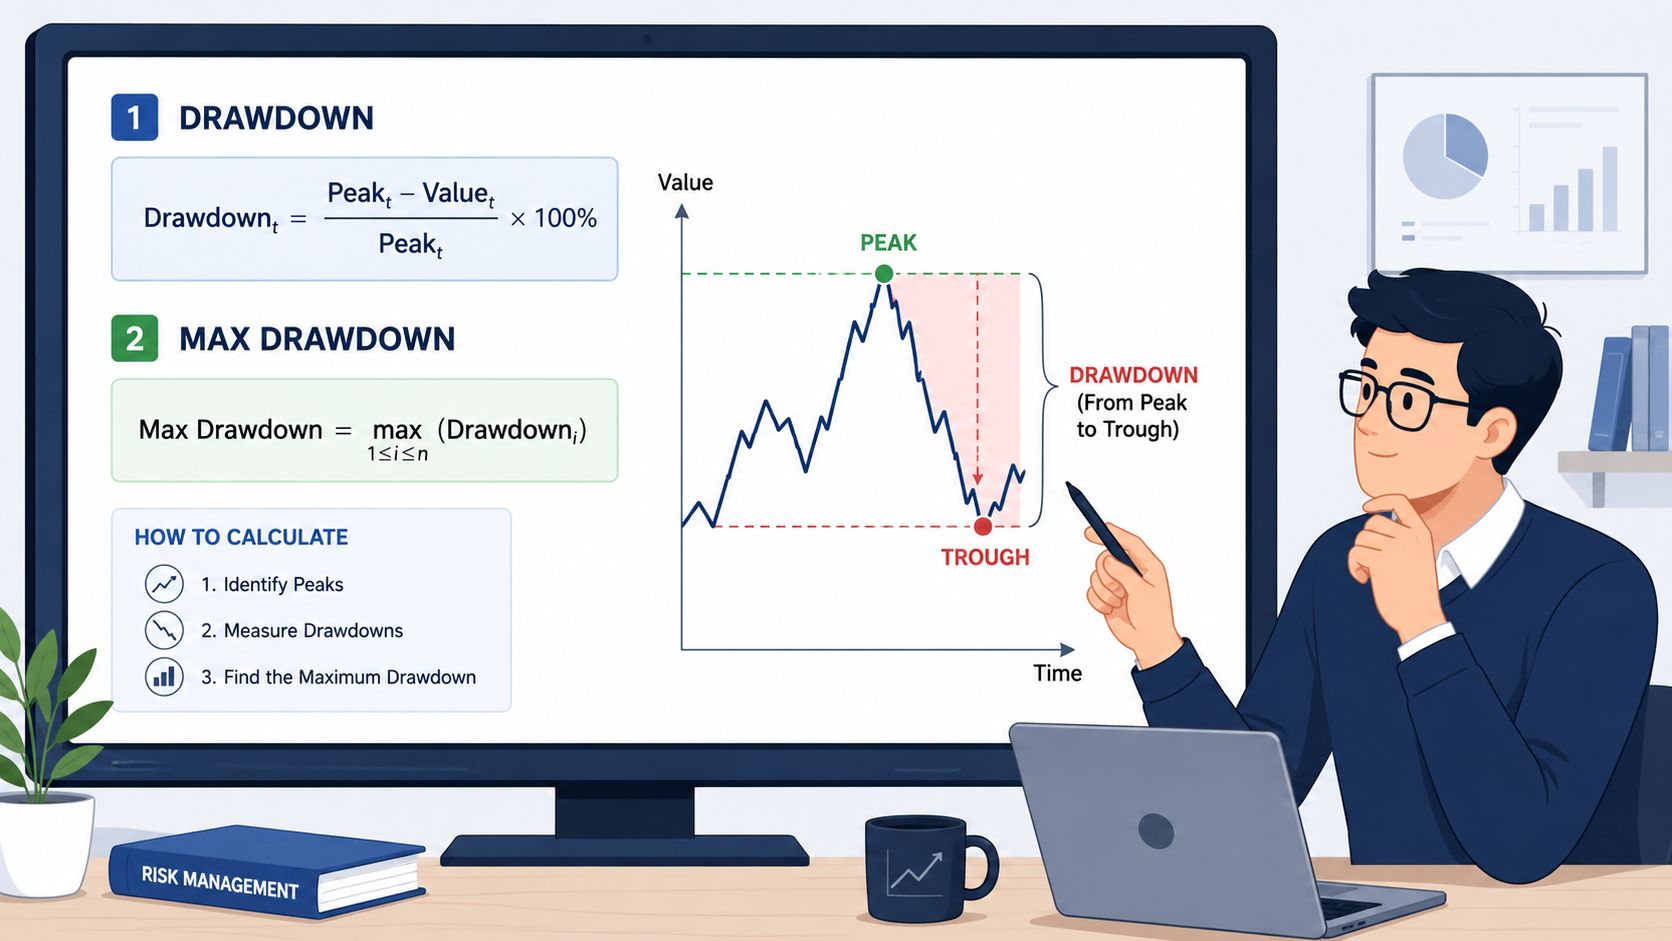
Drawdown at each point
Drawdown = (Current Value - Running Peak) / Running Peak
Maximum drawdown
Maximum drawdown = the minimum value of the drawdown series
That gives you the worst peak-to-trough decline over the sample. But a real risk review shouldn't stop there.
Two Sigma's Venn notes that useful drawdown work includes current drawdown percentage, drawdown length, and recovery period, and that traders often pair drawdown with CAGR and volatility to judge whether returns were earned efficiently or by tolerating large hidden losses (Two Sigma Venn on drawdown use cases).
If you export wallet-level portfolio values into a pandas Series called equity, this is enough to compute the core metrics:
import pandas as pd# Example equity curveequity = pd.Series([100, 108, 112, 105, 98, 101, 95, 99, 115, 110])# Running peakrunning_peak = equity.cummax()# Drawdown seriesdrawdown = (equity - running_peak) / running_peak# Maximum drawdownmax_drawdown = drawdown.min()# Current drawdowncurrent_drawdown = drawdown.iloc[-1]# Drawdown lengthunderwater = drawdown < 0drawdown_groups = (underwater != underwater.shift()).cumsum()drawdown_lengths = underwater.groupby(drawdown_groups).sum()max_drawdown_length = drawdown_lengths.max()print("Max Drawdown:", max_drawdown)print("Current Drawdown:", current_drawdown)print("Max Drawdown Length:", max_drawdown_length)This code won't tell you whether the strategy is good. It will tell you whether the strategy's pain profile is tolerable.
For non-linear DeFi returns, a useful companion metric is the Calmar Ratio, which is:
Calmar Ratio = Annualized Return / Maximum Drawdown
I like it for wallet evaluation because it penalizes strategies that post strong returns only by surviving brutal drops. Sharpe can still help, especially if you're comparing volatility-adjusted performance, but Calmar is often easier to interpret when returns are lumpy, concentrated, and path-dependent. If you want a volatility-focused comparison point, use a Sharpe ratio calculator for trading performance alongside drawdown metrics rather than instead of them.
A short explainer helps if you want to see the mechanics visually.
Practical rule: Never trust a high-return wallet until you've seen the return divided by the pain it took to get there.
What works is calculating drawdown from a time series that reflects actual portfolio value changes. What doesn't is estimating risk from isolated trade screenshots, win rate, or average winner size. Those metrics can all look healthy while the equity curve hides a strategy that's one bad regime shift away from a severe break.
A drawdown figure isn't good or bad by itself. It becomes meaningful only when you map it to strategy style, follower behavior, and recovery demands.
A stablecoin carry strategy and a hyperactive memecoin wallet shouldn't be judged by the same tolerance band. But the same principle applies to both. The deeper the drawdown, the harder it becomes to keep following the plan without overriding it at exactly the wrong time.
Most traders overestimate their tolerance in calm markets. They say they can handle volatility, then a hard down-leg hits and they stop copying, cut size, or revenge trade into a bounce. That behavior turns a temporary drawdown into a permanent impairment because they no longer participate in the recovery.
Deep drawdowns also distort judgment. You stop evaluating whether the strategy still has edge and start asking how fast you can get back to even. That mindset usually leads to worse decisions.
A strategy only works for you if you can actually hold it through its normal pain.
Use this as a decision aid, not as a universal law. Different DeFi niches produce different path profiles.
| Risk Profile | Typical MDD Range | Implication for Traders |
|---|---|---|
| Conservative | Shallow | Usually easier to stick with. Better fit for capital preservation and steady mirroring. |
| Moderate | Noticeable but controlled | Often acceptable if returns are consistent and the strategy recovers in a reasonable way. |
| Aggressive | Deep and uncomfortable | Requires strong conviction, smaller sizing, and strict rules for when to reduce exposure. |
| Extreme | Severe | Usually unsuitable for most copy traders, even if total return looks attractive on paper. |
Don't ask only whether the wallet recovered. Ask better questions:
Interpretation is where most copy traders go wrong. They compare headline gains and skip the survivability test. The more realistic approach is to assume you won't perfectly mimic the original trader's emotional control. Size your risk around that truth.
Drawdown analysis becomes much more valuable when you're evaluating a live wallet history instead of a generic portfolio chart. That's especially true in copy trading, where the core decision isn't "Was this trader profitable?" It's "Can I follow this trader through the way they lose?"
Most commentary treats drawdown as a static report card. For active management, that's too limited. CFA Institute research argues that traditional drawdown analysis misses benchmark-relative behavior, and Western Asset notes that an underwater graph helps reveal the cadence of losses over time, which matters when judging manager behavior rather than just the single worst drop (CFA Institute digest on active return drawdown framing).
Start with the wallet's historical equity behavior, not its best trade.
Pull the wallet history
Export or reconstruct a time series of wallet value or cumulative PnL from its trades.
Mark each local peak
You need the running high-water mark. Every drawdown starts from there.
Measure each underwater phase
Note the decline, the time spent below the peak, and whether the wallet recovered cleanly or chopped sideways.
Compare loss cadence
A wallet that drops in controlled steps behaves very differently from one that suddenly cascades.
Check consistency against your own execution reality
If the wallet trades illiquid names or rotates too fast for you to mirror, the historical drawdown is probably understated relative to your live experience.
Suppose two wallets are both profitable over the sample.
The first wallet compounds with smaller pullbacks, shorter underwater stretches, and fewer periods where you would've felt forced to override the strategy. The second wallet ends with a higher top-line return but gets there through repeated violent drawdowns and ugly recoveries.
For most copy traders, the first wallet is the better candidate.
Why? Because copy trading isn't a trophy for picking the mathematically highest ending number. It's an execution problem. The best wallet for a follower is usually the one that preserves behavior under stress. If the second wallet repeatedly pushes followers into panic, missed fills, or discretionary exits, then its posted return is less relevant than its inability to be mirrored consistently.
The biggest miss is treating wallet selection like a leaderboard exercise.
Use drawdown analysis to separate:
A wallet history isn't just a list of wins and losses. It's a behavioral stress test. Read it that way.
Maximum drawdown is a good start. It's not a full risk framework. If you stop at one worst-case number, you miss the pattern of losses that usually matters more in live trading.
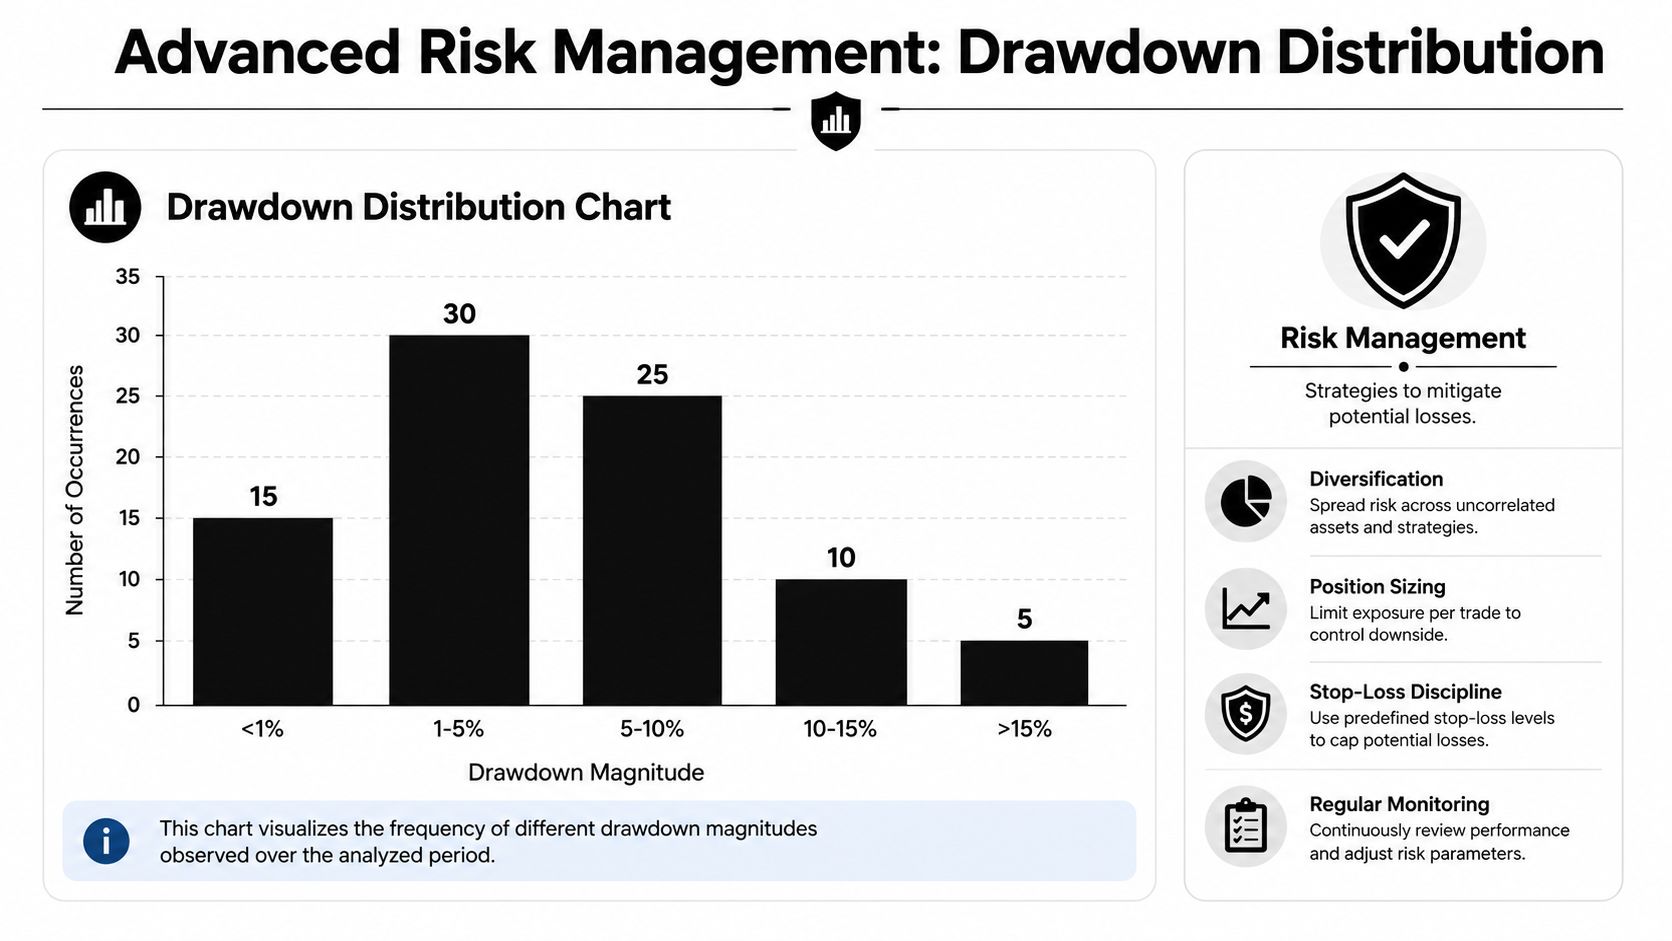
A drawdown distribution chart shows all historical drawdowns, not only the biggest one. That's useful because some strategies suffer one freak event and then trade cleanly, while others repeatedly produce medium-sized damage that grinds followers down.
A distribution view helps answer questions like:
That picture is often more actionable than maximum drawdown alone.
Depth matters. Speed matters too.
A useful analogy comes from geotechnical engineering, where rapid drawdown is treated as a multi-stage problem because stability changes with the speed of the event. For DeFi traders, the lesson is direct: a slow, grinding loss has different liquidity and recovery implications than a liquidation-style collapse of the same size, so the right question isn't only "how much?" but also "how fast?" (Rocscience tutorial on rapid drawdown).
A wallet that loses slowly gives you options. A wallet that breaks fast often takes those options away.
The best drawdown controls are set in advance. Not during a crash.
A practical framework looks like this:
If you want a broader framework for turning those thresholds into execution rules, this guide to risk management for active traders pairs well with drawdown work.
What doesn't work is improvising after the pain starts. Traders who haven't defined a kill switch in advance usually replace process with hope. Hope isn't risk management.
Drawdown analysis isn't an academic extra. It's the part of performance analysis that tells you whether a strategy is built to survive.
The traders who last in crypto don't just chase upside. They study the path, the underwater time, the recovery pattern, and the speed of losses. They know a wallet can be profitable and still be a terrible copy-trading candidate if its drawdown profile is too violent to follow in real life.
Use maximum drawdown as the first gate. Then go deeper. Check duration, recovery, cadence, and whether the strategy's pain profile fits your own behavior under pressure. If it doesn't, the wallet isn't wrong for everyone. It's wrong for you.
That mindset changes how you allocate capital. You stop rewarding flashy curves and start backing survivable ones. That's a much better way to stay in the game long enough to compound.
If you want to apply these ideas to real on-chain histories, Wallet Finder.ai makes it easier to inspect wallet performance, review trading behavior, and compare candidates before you mirror them. Use it to look past headline returns and focus on the part that decides long-term results: how a wallet behaves when things go wrong.

A premier DeFi analytics platform empowering traders to discover and analyze profitable blockchain wallets, trades and tokens.

