
Recovery Factor Calculation for Smart Traders
Master the recovery factor calculation to measure a strategy's resilience. Learn the formula, see DeFi examples, and find top wallets with Wallet Finder.ai.

June 20, 2026


Wallet Finder
June 14, 2026
Your crypto portfolio probably didn't start as a portfolio. It started as a series of trades.
A little ETH for conviction. A layer-2 token because the ecosystem looked early. A governance token from a protocol you personally use. A memecoin position that was supposed to be tactical and is now somehow one of your biggest exposures. Then those positions spread across wallets, chains, and exchanges until the whole thing became hard to judge as one system.
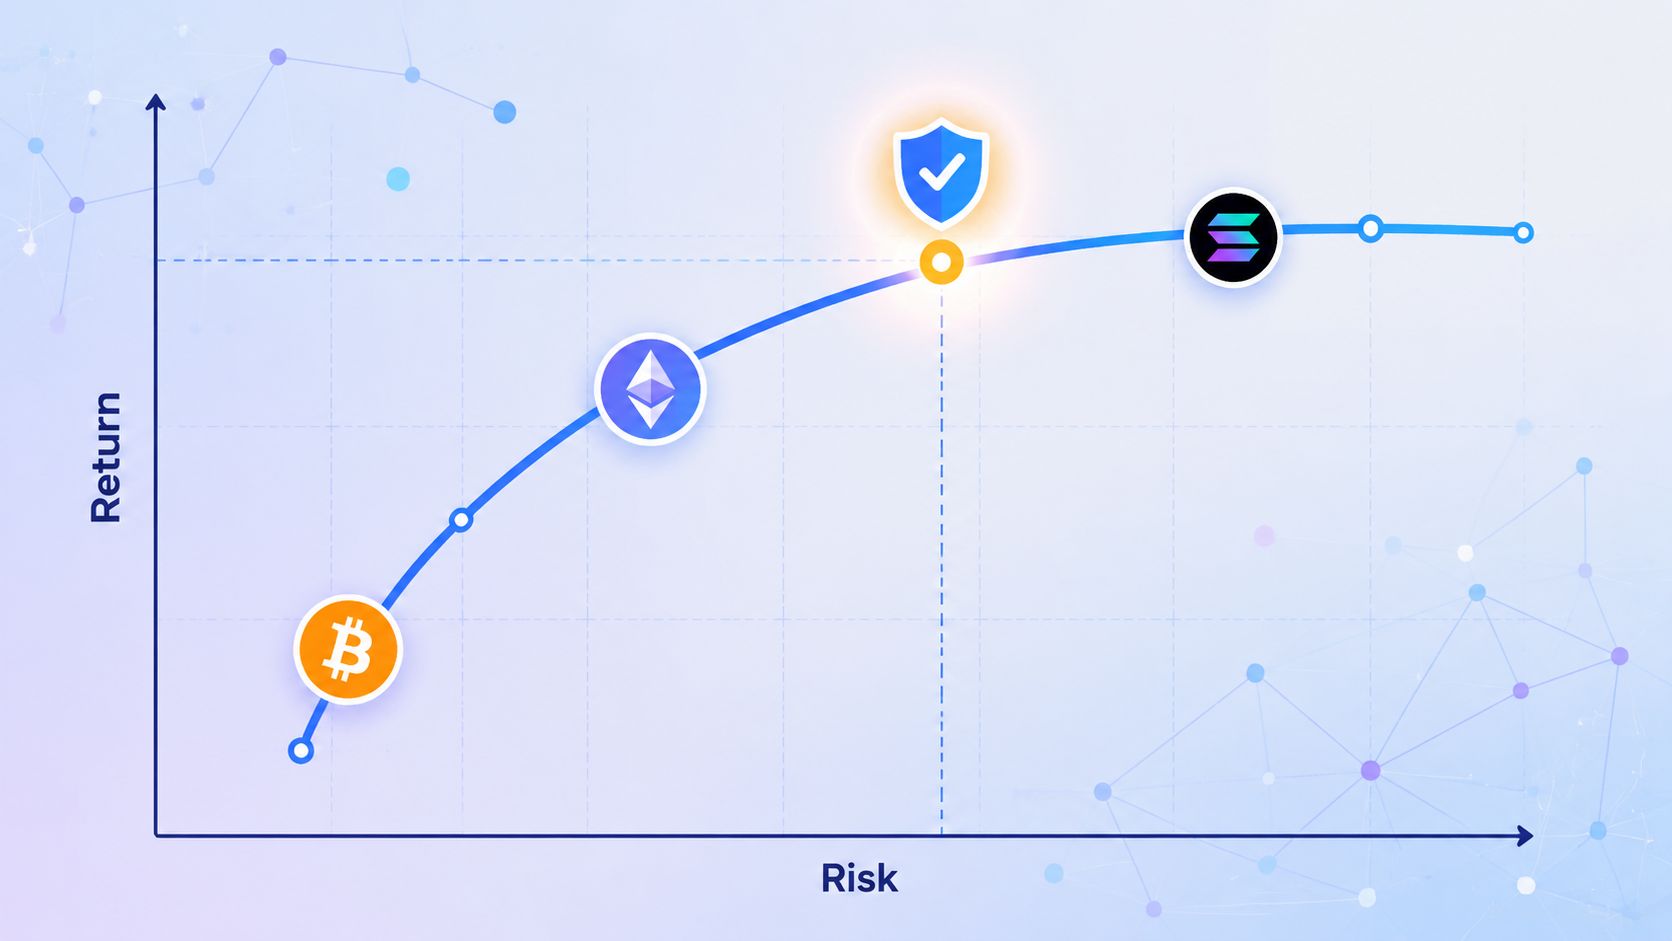
That's where efficient frontier analysis becomes useful. It gives you a structured way to turn a pile of token bets into a portfolio you can evaluate, compare, and improve. In traditional finance, the framework became foundational after Harry Markowitz introduced modern portfolio theory in 1952, showing that investors can evaluate portfolios with mean return, standard deviation, and correlation. The efficient frontier itself is the set of portfolios with the highest expected return for a given level of risk or the lowest risk for a given return, with risk measured as standard deviation of returns, as outlined in this efficient frontier overview.
In DeFi, the hard part isn't getting exposure. The hard part is understanding what exposure you already have.
A trader might think they're diversified because they hold BTC, ETH, a few perpetual DEX tokens, some restaked assets, and a basket of smaller names on Solana and Base. Then they map the return series and realize most of those positions still lean on the same risk regime. When market liquidity dries up, correlations tighten, and the portfolio behaves like one oversized beta trade.
Efficient frontier analysis is useful because it forces specific questions:
That last point matters. In practice, plenty of crypto portfolios are inefficient because they were built incrementally, not designed.
Practical rule: If a portfolio was assembled one trade at a time, assume it needs to be rebuilt as a portfolio at least once.
The classic model works well when you use it as a decision framework, not as a prophecy engine.
It works for comparing candidate allocations, spotting hidden concentration, and testing whether adding a token improves the total mix. It does not work well when traders treat historical averages as truth, ignore liquidity, or assume a token with a short trading history deserves the same confidence as an established asset.
For DeFi, the practical workflow is simple:
That last step is where most toy models fail. A mathematically elegant allocation can still be unusable if the token is thin, structurally reflexive, or exposed to smart contract and bridge risk.
At its core, efficient frontier analysis is a ranking system for portfolios.
You start with a set of assets. For each possible combination of weights, you estimate expected return and risk. The frontier is the curve containing the portfolios that are non-dominated. For any target risk, it gives the highest-return portfolio in that class. For any target return, it gives the lowest-risk portfolio in that class, as described in Yale's introduction to the geography of the efficient frontier.
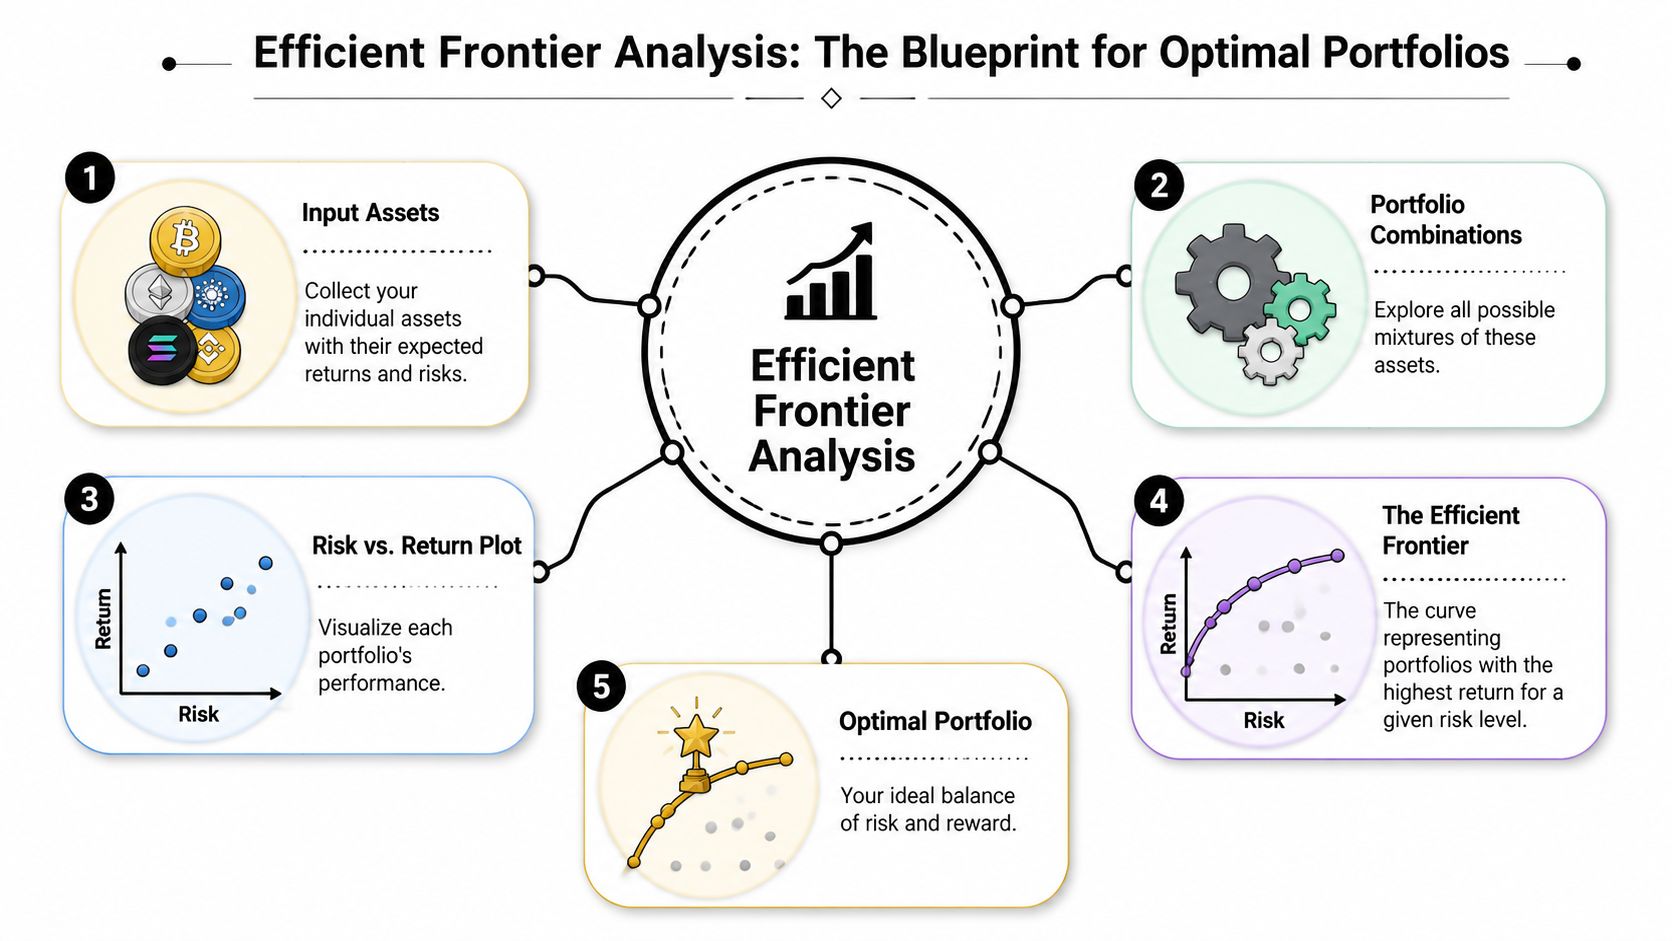
The framework rests on three technical inputs:
| Input | What it means in practice | Why it matters in crypto |
|---|---|---|
| Mean return | Your estimate of average asset return over the chosen period | Crypto trends are regime-dependent, so this estimate is fragile |
| Standard deviation | The volatility of the asset's returns | This is the basic risk measure in the model |
| Correlation | How one asset's returns move relative to another's | This determines whether diversification is real or cosmetic |
Those three inputs are enough to build a usable risk-return map. That's one reason the model has stayed relevant for decades in portfolio construction.
Think of the frontier as a menu, not a signal.
It doesn't tell you there is one perfect portfolio. It shows the best available combinations from the assets you chose. One portfolio on the curve might lean toward lower volatility. Another might accept much more variance for higher expected return. Both can be efficient. The choice depends on what kind of drawdown and uncertainty you can live with.
For crypto traders, risk is messy. Standard deviation doesn't capture smart contract exploits, governance attacks, delistings, peg failures, or liquidity vanishing during stress. But it still gives you a common language for comparing assets that would otherwise be judged only by narrative.
The frontier is useful because it reduces a noisy universe of token combinations into a small set of trade-offs you can actually inspect.
If every token moved in lockstep, there would be little point in portfolio construction. The curve exists because assets don't move identically.
Even in crypto, where correlations can spike during panic, return relationships still vary. Some assets react more to layer-specific activity. Some are tied to exchange flows. Some respond to stablecoin liquidity or protocol revenue expectations. Those differences create the bend in the frontier. Diversification is what gives the curve shape.
A practical implication follows. Adding more tokens doesn't automatically improve the frontier. You only improve it when the new asset changes the portfolio's return and co-movement profile in a favorable way.
Crypto portfolio work then becomes more operational than theoretical.
Your holdings are rarely sitting in one brokerage account with clean ticker symbols. They're spread across wallets, chains, and formats. Some assets are spot tokens, some are LP receipts, some are wrapped representations, and some no longer trade cleanly enough to include. Before you optimize anything, you need a dataset you trust.
The first job is to build a holdings inventory from actual wallet activity.
That means identifying every wallet you control, every exchange sub-account you treat as part of the same risk book, and every token position worth modeling. Ignore this step and you'll optimize an incomplete portfolio, which is worse than not optimizing at all.
One option is to use a wallet tracker that consolidates histories and exports activity. For example, Wallet Finder.ai surfaces wallet histories, trades, tokens, and exports that can be taken into offline analysis. If you need market data feeds to pair with that wallet history, their guide to a crypto prices API is one practical starting point.
Not every token in your wallet belongs in the optimizer.
Use a filtering pass before you pull price data:
A clean asset universe is more important than a large one. In crypto, adding questionable assets often makes the optimizer look more advanced while making the output less believable.
Once you know what you're modeling, collect historical prices from a consistent source or set of sources.
For larger assets, public market data APIs often work fine. For smaller DeFi names, you may need protocol-specific or specialized providers. The key is to make sure the timestamps line up, the symbols match the assets you hold, and the series doesn't contain gaps that corrupt the return calculations.
Use one frequency per run. Daily data is usually the cleanest compromise for multi-asset DeFi portfolios. Hourly data can help for short-horizon trading books, but it introduces more microstructure noise and data quality problems.
| Data component | What to verify |
|---|---|
| Wallet history | Correct wallet addresses, complete token transfers, swap history, chain coverage |
| Asset identifiers | Contract addresses and symbols mapped consistently |
| Price series | Same currency basis, aligned timestamps, no silent missing periods |
| Portfolio snapshot | Current weights reflect the same assets used in historical analysis |
Garbage in, polished chart out. Most failed frontier work in crypto comes from bad holdings data, mismatched token identifiers, or price series that look complete but aren't.
A clean price table still produces bad portfolios if the return series is poorly constructed. This is the stage where many crypto frontiers go off the rails.
Efficient frontier work starts with returns because token prices are not comparable across assets. A governance token at $2,000 is not automatically richer, safer, or more attractive than one at $2. What matters is how each asset has behaved over time, how volatile that path has been, and how it has moved alongside the rest of the book.
Start by converting each aligned price series into periodic returns. Daily data is the default for many DeFi portfolios because it keeps the sample manageable and avoids some of the noise you get with intraday candles, thin liquidity, and oracle quirks.
Simple returns are usually enough for portfolio construction:
[
r_t = \frac{P_t}{P_{t-1}} - 1
]
Log returns can also work, but the choice matters less than consistency. Pick one method, use it across the full asset set, and keep the frequency fixed for the entire run.
Annualization is useful for reporting because it puts return and volatility on a scale investors recognize. It does not fix unstable inputs. In crypto, a sample that includes an airdrop cycle, a liquidity mining spike, or a post-exploit collapse can distort the average return so badly that the optimizer starts chasing noise.
Once returns are calculated, estimate the covariance matrix. That matrix is the core input for portfolio risk.
Each diagonal entry is an asset's own variance. Each off-diagonal entry measures how two assets have moved together. The optimizer uses those relationships to decide whether adding one token reduces total portfolio risk or just adds another version of the same exposure.
That distinction matters more in DeFi than many traders expect. Holding ETH, liquid staking derivatives, governance tokens from ETH-based protocols, and ETH-beta altcoins can look diversified in a wallet view while behaving like one crowded trade in a risk model.
For a quick check before optimization, reviewing correlation analysis for crypto portfolios helps frame which assets are providing you independent risk.
Use a repeatable sequence:
The review step matters. A covariance matrix can be mathematically valid and still be economically useless.
| Signal | What it usually means |
|---|---|
| Pairwise relationships vary across the matrix | You may have real diversification across chains, sectors, or strategy types |
| Many assets cluster at similar correlation levels | The portfolio is probably carrying one dominant market beta |
| Extreme values tied to very short histories | The estimate is unstable and should be treated carefully |
| Small-cap DeFi tokens show violent relationship shifts | Liquidity shocks and pricing gaps may be overwhelming any fundamental link |
On my side, I treat new tokens, bridged assets, and post-launch protocol tokens with extra skepticism. Their early return history often reflects listing dynamics and incentive programs more than investable behavior.
Another common problem is stale pricing. Some DeFi assets do not trade continuously in any meaningful size, and some price feeds smooth the path so much that volatility and covariance look lower than what a trader would experience exiting size. That leads to frontiers that overstate diversification and understate drawdown risk.
Desk habit: Inspect the covariance matrix manually and compare it with your market intuition. If the matrix says two assets are diversifying each other, but both sell off during the same funding stress or liquidity crunch, treat the estimate as suspect.
One last limitation should stay front of mind. Covariance assumes that the recent co-movement structure is a useful summary of risk. In DeFi, that summary misses smart contract failure, governance attacks, oracle breaks, bridge risk, and liquidation cascades. Use the matrix as a working risk model, not as proof that the portfolio is safe.
Open your optimizer on a basket of DeFi assets and it will usually make the same mistake a new trader makes. It chases the highest recent returns, ignores exit liquidity, and piles into the noisiest names in the set. The job here is to turn that raw output into a portfolio you could hold, rebalance, and defend when the market turns.
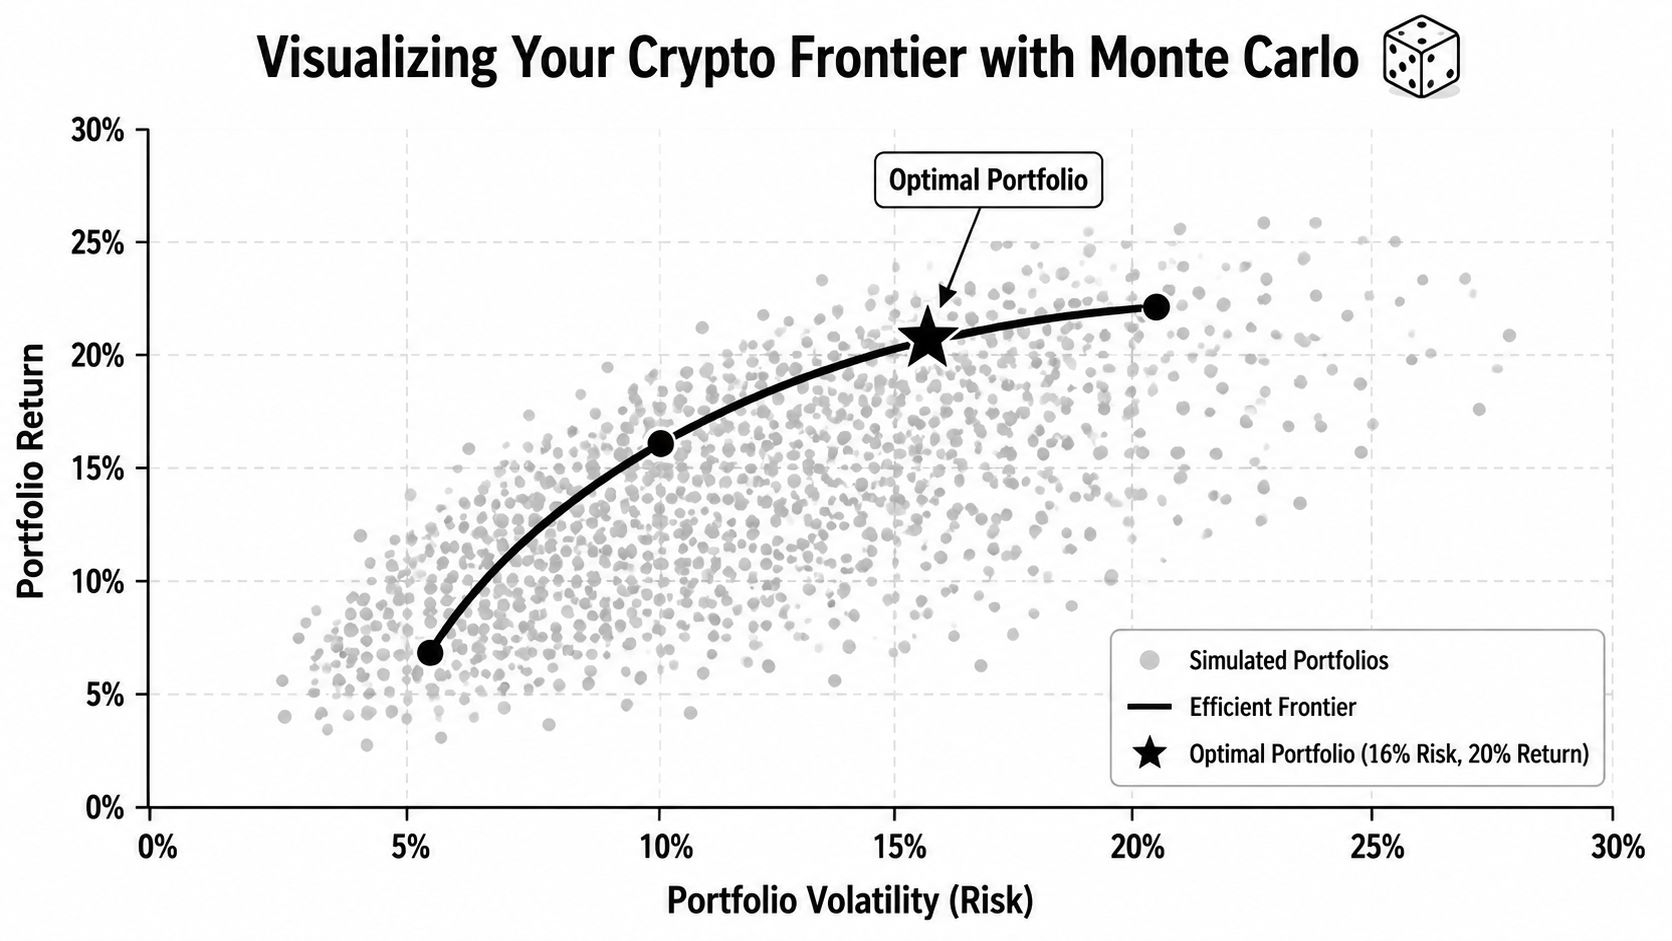
Monte Carlo simulation is the fastest way to pressure-test your assumptions before you hand the job to a solver. Generate a large set of random portfolios, calculate expected return and volatility for each one, and plot the cloud. In crypto, that visual matters because it quickly shows whether your opportunity set is broad or whether one or two tokens dominate everything.
A practical workflow looks like this:
For a quick check on whether your candidate mix is reducing concentration across holdings, a crypto diversification tool for wallet-level portfolio analysis is a useful companion to the frontier chart.
Monte Carlo gives intuition. Constrained optimization gives the line you can allocate against.
The standard approach is to solve a series of portfolio problems across a range of target returns. For each target, minimize variance subject to your constraints. Plot those solutions and you get the efficient frontier. You can run the process in reverse by setting a risk cap and maximizing return, but in practice I find return targets easier to audit because the weight changes are more interpretable.
Lumivero's guide to efficient frontier analysis lays out this constrained-optimization method clearly. For implementation, many traders approximate the frontier with a broad random sample first, then solve a smaller set of target-return portfolios to clean up the curve, as noted earlier.
That two-step process works well in DeFi. Random sampling helps you spot concentration risk and weird outliers. The optimizer then produces cleaner candidate portfolios once your constraints are realistic.
A frontier chart should answer a portfolio question, not just decorate the article or notebook.
Include these elements:
| Chart element | Why it matters |
|---|---|
| Current portfolio | Shows whether your live book is efficient or obviously dominated |
| Minimum-volatility portfolio | Acts as a baseline for the lowest modeled risk in your asset set |
| Several efficient portfolios | Lets you compare conservative, balanced, and aggressive allocations |
| Individual asset markers | Shows whether the frontier is being pulled by a single token or a small cluster |
I also label any portfolio that breaches a practical trading rule, even if it sits on the mathematical frontier. In crypto, a portfolio can be mean-variance efficient and still be a bad trade because one component is too illiquid, too operationally messy, or too exposed to protocol-specific failure.
A short walkthrough can help if you want to see the visual logic in action.
The interface between portfolio theory and execution reality poses challenges. If you leave the model unconstrained, it will often suggest positions that look efficient on paper and behave terribly in live markets.
The constraints that matter most in DeFi are usually simple:
The best frontier is the one you can trade with size, monitor with discipline, and survive during a liquidity squeeze. In DeFi, that usually means accepting a less efficient curve on paper in exchange for a portfolio that holds up better in the market.
A frontier chart is only valuable if it changes how you allocate risk.
Start by locating your current portfolio. If it sits below the efficient frontier, the message is direct. Your existing combination is not the best trade-off available from the assets you already hold. You may be able to reduce risk without giving up expected return, or raise expected return without taking more modeled risk.
Most traders focus on three areas of the curve:
Don't assume the highest point you can tolerate on a chart is the right choice. In crypto, the aggressive end of the frontier often depends heavily on estimated returns, which are the least stable input in the entire framework.
Use the frontier to narrow decisions, then apply judgment about liquidity, token design, and downside paths the model can't capture.
Efficient frontier analysis relies on historical data. That's the first limitation and the most important one.
Crypto markets change structure quickly. A token can move from dormant to hyper-liquid, from narrative darling to dead capital, or from productive collateral to governance casualty in a short period. The model also assumes risk can be summarized through standard deviation, which is useful but incomplete for DeFi.
Here are the blind spots that matter most:
| Blind spot | Why it matters |
|---|---|
| Smart contract risk | A protocol exploit doesn't look like ordinary volatility |
| Liquidity collapse | Exit prices during stress can diverge sharply from observed market prices |
| Fat-tailed returns | Crypto drawdowns and squeezes are often more violent than normal-distribution assumptions imply |
| Regime shifts | Historical relationships between assets can break when market structure changes |
| Reflexive tokenomics | Unlocks, emissions, and incentive changes can rewrite the risk profile fast |
The practical way to use efficient frontier analysis in crypto is to treat it as a screening and design tool.
Run it regularly. Re-estimate inputs after major market shifts. Compare multiple lookback windows. Stress test the output by removing one token at a time and seeing how much the frontier changes. If a small modeling change produces a wildly different "optimal" portfolio, trust the process less and your constraints more.
The model still earns its place because it forces discipline. It makes you specify assumptions, measure co-movement, and compare allocations on the same map. For DeFi traders used to managing portfolios by tabs, tweets, and wallet alerts, that alone is an upgrade.
If you're building crypto portfolios from wallet-level activity, Wallet Finder.ai can help you assemble the raw inputs before the optimization work starts. It lets you inspect wallet histories, exports, token activity, and trading behavior across major chains, which makes it easier to turn scattered on-chain positions into a dataset you can analyze.

A premier DeFi analytics platform empowering traders to discover and analyze profitable blockchain wallets, trades and tokens.

