
Recovery Factor Calculation for Smart Traders
Master the recovery factor calculation to measure a strategy's resilience. Learn the formula, see DeFi examples, and find top wallets with Wallet Finder.ai.

June 20, 2026


Wallet Finder
May 4, 2026

You’re probably already tracking perp funding, liquidation maps, exchange inflows, and a shortlist of wallets that tend to move early. Then BTC or ETH makes a sharp move anyway, and the post-trade review shows the same problem: the on-chain clues were there, but conviction was hard to judge.
That’s where open interest cme becomes useful.
Crypto-native traders often focus on speed. CME open interest adds something different: a read on whether larger, regulated participants are building positions or just trading noise. That matters because a rally driven by new positioning behaves differently from a rally driven by short covering. The same is true on the downside.
A lot of traders treat TradFi and DeFi as separate worlds. In practice, they’re linked by positioning, hedging, and liquidity. If you can read institutional participation through CME open interest, then compare that backdrop with what high-signal wallets are doing on-chain, you get a better filter for when to press and when to stay patient. If you want a broader framework for reading crypto sentiment first, this guide on crypto market sentiment analysis is a useful companion.
A familiar setup plays out in crypto every week. BTC breaks out, perp funding flips hot, CT starts calling for continuation, and smart wallets begin rotating into higher beta names. Then the move fades because the buying came from shorts getting forced out, basis traders adjusting hedges, or fast money chasing momentum instead of building fresh exposure.
Open interest helps separate those flows.
On CME, open interest is the number of futures or options contracts still open at the end of the session. For a crypto-native trader, the practical use is simple. It shows whether larger participants are carrying risk overnight, not just trading the intraday move.
That matters because the same price candle can come from very different positioning. A rally with rising open interest usually points to new participation entering the market. A rally with flat or falling open interest often points to short covering, dealer hedging, or traders closing existing positions into strength. Price alone will not tell you which one you are looking at.
The edge comes from combining venues instead of treating TradFi and DeFi as separate lanes. CME gives a cleaner read on regulated institutional positioning. On-chain wallet tracking shows where capital is rotating next. Put those together and you get a much better filter for conviction. If you want the broader framework first, this guide to crypto market sentiment analysis lays out the full sentiment stack.
One practical rule works well here.
Practical rule: If on-chain wallets are buying risk but CME open interest does not confirm fresh participation, assume the move can still be fragile and size accordingly.
That is the primary use of open interest cme for DeFi traders. It does not replace wallet tracking, exchange flow data, or funding. It tells you whether the institutional side is adding exposure, reducing it, or putting on protection before you mirror what looks like smart money on-chain.
Most beginners confuse the two because both rise during busy sessions. But they answer different questions.
Use a restaurant analogy. Volume is how many meals were served today. Open interest is how many tables are still reserved for later. One shows activity. The other shows committed participation.
A market can print heavy volume and still have weak conviction. That happens when traders open and close positions quickly, or when a move is mostly forced buying from shorts covering. Open interest gets closer to what you want to know: are fresh participants entering and staying in the trade?
Volume is fast and visible. It spikes on breakouts, headline days, and liquidation cascades. That makes it tempting to treat volume as confirmation.
The problem is that high volume can come from churn. Open interest changes only when the stock of open contracts changes. If OI rises, new capital is being committed by participants willing to carry exposure beyond the current session.
| Metric | What It Measures | Signal Interpretation | Analogy |
|---|---|---|---|
| Open Interest | Total outstanding contracts still open at day’s end | Higher OI suggests traders are adding positions and maintaining exposure | Reserved tables still booked |
| Volume | Total contracts traded during a session | High volume shows activity, but not necessarily lasting conviction | Meals served today |
A useful mental shortcut:
Volume tells you the market is busy. Open interest tells you traders are staying.
That’s why open interest cme matters to crypto-native traders. On-chain flows can show who moved. CME OI helps you judge whether broader capital is leaning in.
A crypto trader watching perp OI can refresh the screen all day. CME does not work like that. The signal arrives after the session, once clearing has sorted out what was opened, closed, and carried overnight.
CME publishes daily volume and open interest across Globex, ClearPort/PNT, and Open Outcry, which gives you a full exchange view instead of a single execution channel, as described in CME Group’s open interest lesson. It also publishes weekly and monthly reports, which are more useful for identifying participation trends than for finding intraday entries.
That reporting lag matters. If you trade crypto, the closest analogy is waiting for confirmed settlement data instead of reacting to every mempool update. By the time CME open interest prints, the useful question is not what happened tick by tick. It is who was willing to hold exposure into the close.
Daily CME OI works best as a positioning read. It helps answer whether new risk is entering the market or existing risk is being closed out.
That makes it useful for validating sentiment before you copy on-chain flows. If BTC rallies, a whale wallet rotates into DeFi beta, and CME OI rises with the move, the case for real risk appetite is stronger. If the same rally happens while OI fades, the move may be driven by short covering or position reduction, which is a very different setup for follow-through.
The raw OI number is only the first pass. The more informative layer is who holds that exposure.
Each Friday, the CFTC Commitment of Traders report breaks CME open interest into participant categories such as producers, swap dealers, and money managers. That gives you a TradFi version of wallet labeling. In crypto, you tag market makers, funds, or treasury wallets. In futures, you work with regulated participant buckets and compare how those groups are positioned week to week.
A practical workflow looks like this:
One caution from experience. Traders get in trouble when they build a big story from one daily print. CME open interest is more reliable as a series than as a single datapoint. Use it to confirm a regime shift, not to force a narrative onto one session.
A BTC breakout on Binance can look strong at 2 p.m. By the CME close, open interest can tell a very different story. If participation expands with the move, institutions may be pressing the trade. If participation shrinks, the rally may be driven by covering and cleanup, not fresh conviction.
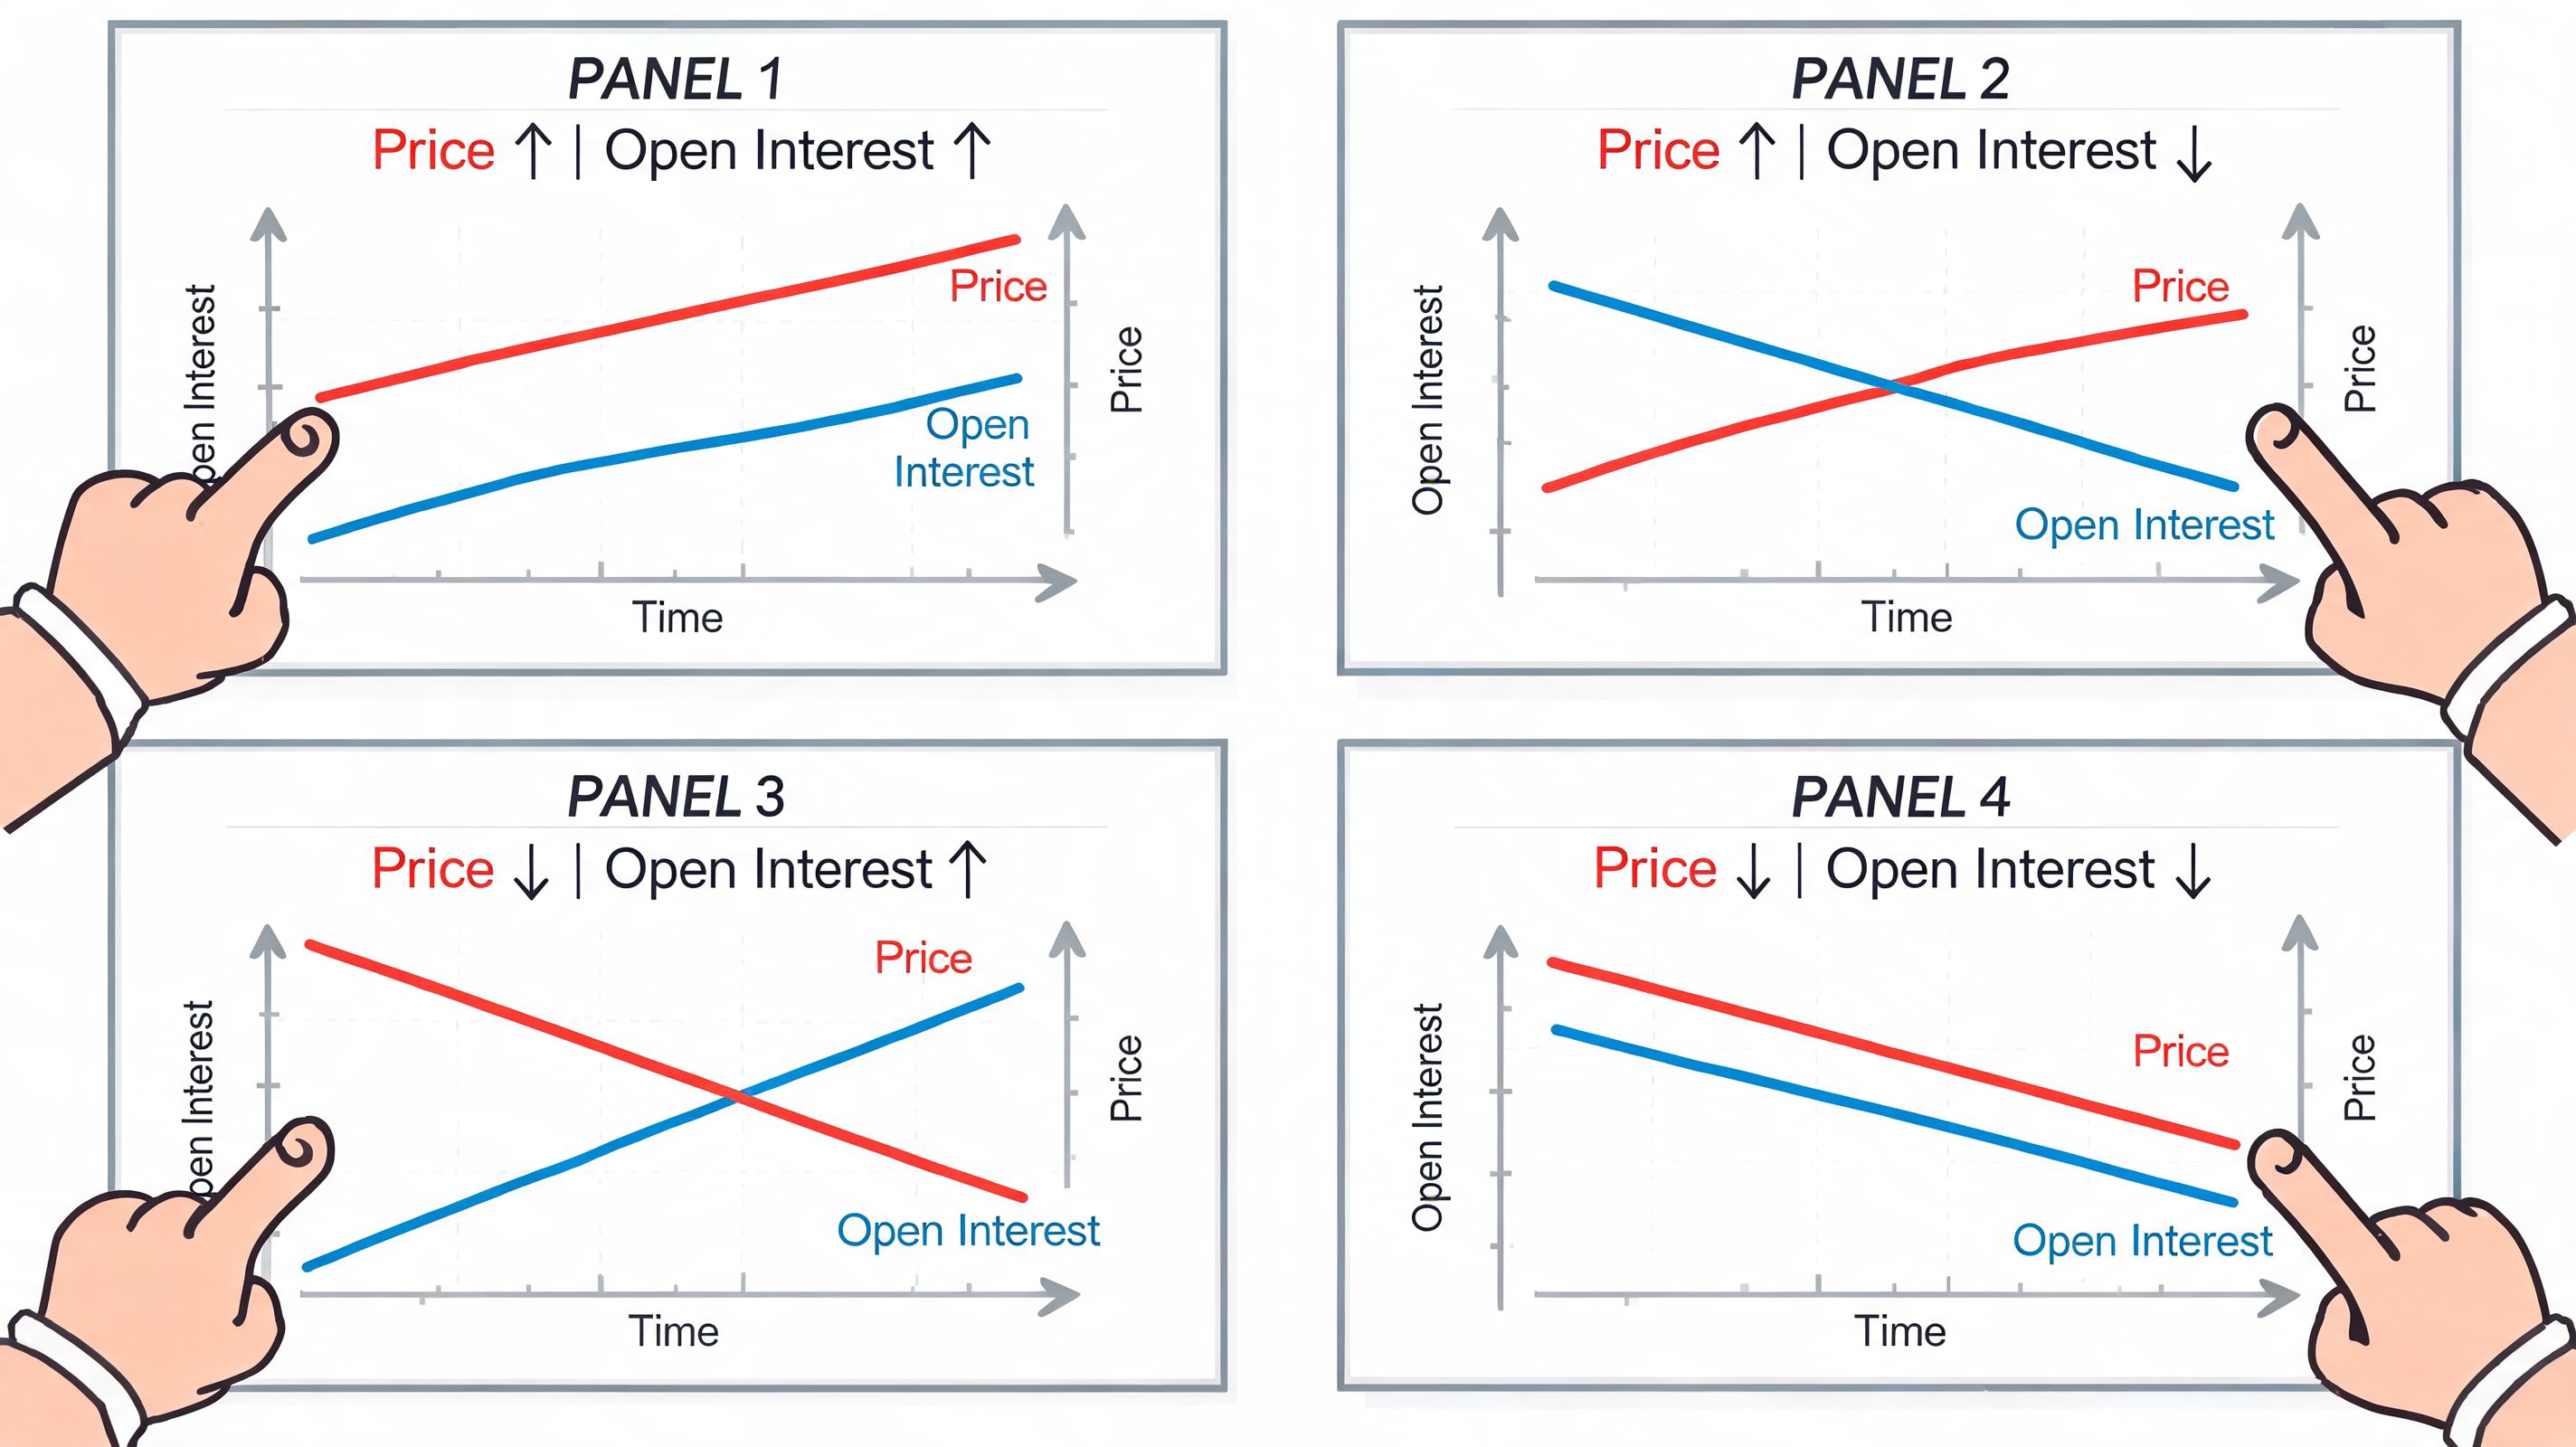
Price and OI need to be read together. OI on its own only shows whether exposure is being opened or closed. Price shows which side is taking control. For crypto traders, that distinction matters before copying a fund wallet into perp markets or rotating into higher-beta DeFi names.
This is the strongest confirmation setup. Price is advancing and new positions are being added, which usually means the move has real sponsorship behind it.
In practice, this is the tape where breakouts have a better chance of holding above the first retest. It does not guarantee upside. New shorts can enter too. But if price keeps pushing higher while OI builds, buyers are absorbing that supply.
For a DeFi trader, this is the cleanest backdrop for following on-chain risk-on behavior. If a tracked wallet is adding ETH beta, LSTs, or perp exposure while CME OI is also climbing, the TradFi and on-chain signals are lining up. If you automate wallet monitoring through crypto exchange API workflows, this is one of the highest-value confirmations to add to the stack.
This usually points to short covering or position reduction. Price rises, but the market is not attracting much fresh participation.
These rallies can travel farther than traders expect, especially after crowded positioning gets squeezed. Still, the base is weaker. Failed breakouts, shallow follow-through, and sharp reversals are more common here than in a true expansion phase.
My rule is simple. If wallets are buying into a price rise while CME OI is fading, I assume the move needs tighter risk management. Smaller size and faster profit-taking make more sense than treating it like the start of a durable trend.
This is the classic liquidation or de-risking pattern. Traders are closing positions and stepping back, which means participation is shrinking with price.
That matters because not every selloff reflects aggressive new bearish conviction. Sometimes the market is just clearing out stale longs. In crypto, this often lines up with forced unwinds, treasury rebalancing, or funds cutting gross exposure across venues. Once that flush passes, trend quality often weakens unless new sellers show up.
This is the bearish pressure setup. Price is declining while exposure grows, which usually means new shorts are entering, downside hedges are being added, or both.
For crypto natives, TradFi positioning can keep you out of bad copies. If a smart-money wallet is buying a dip on-chain but CME OI rises as price falls, I treat that wallet flow with caution. The institutionally expressed trade may still be risk-off, and the on-chain buy could be inventory management rather than directional conviction.
The edge comes from using these four states as a filter, not a trading signal by themselves. CME OI helps you judge whether institutional participation is expanding or contracting. On-chain wallet tracking helps you see where capital is rotating next. Used together, they give you a cleaner read before you mirror smart money in DeFi.
A trader sees BTC rally overnight, checks perp funding, and then wonders whether institutions added risk or just shuffled it across maturities. That answer usually does not come from crypto-native dashboards first. It starts with CME’s own reporting.
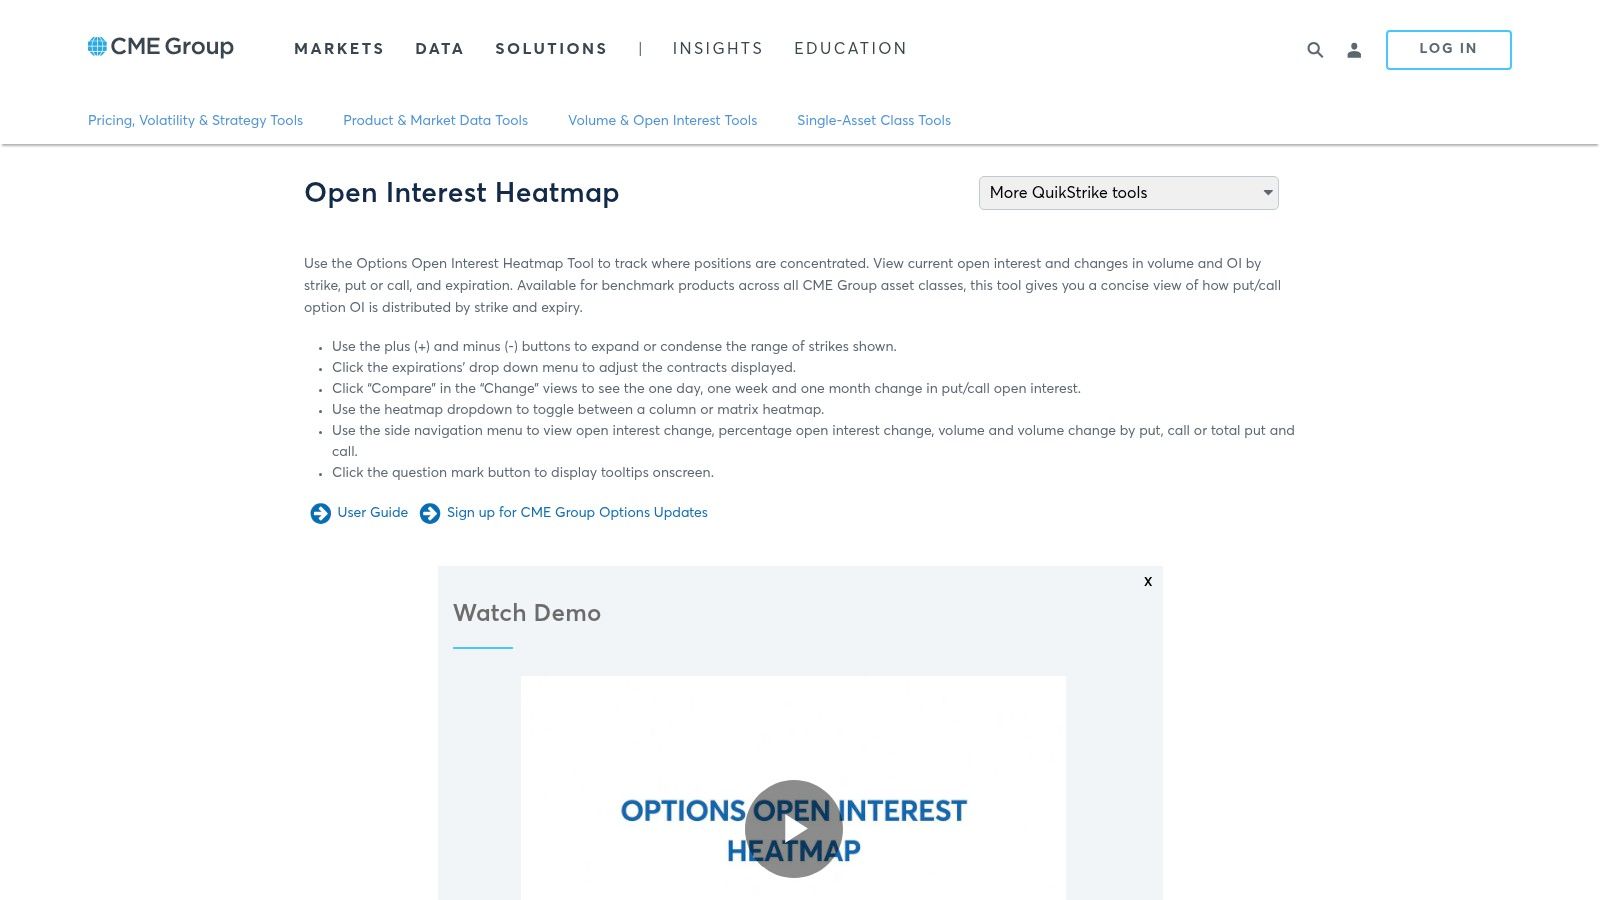
CME Group’s Open Interest Heatmap is one of the best free starting points for options positioning. It shows where open interest sits by strike, expiration, and put versus call exposure, which helps spot crowded levels and areas where dealer hedging can matter through the CME Open Interest Heatmap tool.
That matters in practice because OI is rarely spread evenly. It clusters around event dates, round-number strikes, and popular hedges. If ETH is trading near a heavily populated strike into expiry, I care less about the headline move and more about whether positioning can pin price or amplify a break.
| Tool type | Best use | Why it matters |
|---|---|---|
| CME daily reports | Official participation read | Best for verified end-of-day positioning |
| CME Open Interest Heatmap | Strike and expiration analysis | Good for concentration mapping and options context |
| Third-party visualizers | Faster charting and easier browsing | Better for scanning changes across sessions |
| Historical data pipelines | Quant research and backtesting | Needed for repeatable tests and model building |
Third-party tools help with workflow, especially if you compare multiple expiries or need cleaner charting. The trade-off is simple. Convenience can improve speed, but the official CME feed should remain the reference point when numbers disagree.
If you are testing how OI behaves around macro events, expiries, or large price dislocations, use CME historical datasets rather than relying on screenshots and manual notes. CME provides broader market data access for research workflows, and that is the right route for systematic work.
For crypto traders building a cross-venue stack, the data engineering problem looks familiar. You need clean ingestion, consistent timestamps, and a way to line up futures positioning with on-chain behavior. This guide to crypto exchange APIs for market data pipelines is useful if you want the crypto side of that stack to be as reliable as your TradFi inputs.
A practical setup is straightforward:
The common mistake is building a full research stack before learning how to read the daily structure. Start with where OI is building, where it is rolling off, and which expiries institutions keep returning to. That alone gives a crypto trader a much better filter before copying wallet activity on-chain.
A setup appears bullish on-chain. A few large wallets are accumulating, CT is calling for continuation, and price is holding trend. Before copying that flow, check whether institutional participation is building in the same direction on CME. That extra step filters out a lot of false confidence.
CME open interest gives a broad read on whether larger players are adding risk, hedging, or standing aside. Wallet tracking shows who is moving size on-chain and where that capital is going. Used together, they solve different parts of the same problem. One gives regime context. The other gives execution clues.
Start with the CME side and ask a narrow question. Is participation expanding into this move, clustering around a specific expiry, or shifting toward protection? As noted earlier, sharp increases in activity around one expiration usually mean institutions care about that window. That matters because wallet activity often looks bullish right before event risk, even when the futures and options complex is positioning more defensively.
Then form a tradeable hypothesis. Keep it plain. Institutions may be adding upside exposure into an event. They may be paying for downside protection while spot still looks stable. They may also be rolling risk forward without increasing conviction. Those are very different reads, and they should lead to different on-chain checks.
The on-chain step is where crypto traders usually move too fast.
Validate whether the wallets you track are behaving in a way that matches the CME read. If CME positioning looks defensive, strong confirmation would be treasury wallets reducing beta, funds rotating into majors, or smart money parking capital in stable assets instead of chasing smaller tokens. If CME participation is building with a constructive price structure, the cleaner confirmation is sustained accumulation, exchange withdrawals, and sector rotation into higher-beta names. Reviewing the mechanics of inflow and outflow analysis for wallet behavior helps here, because raw transfers are easy to misread.
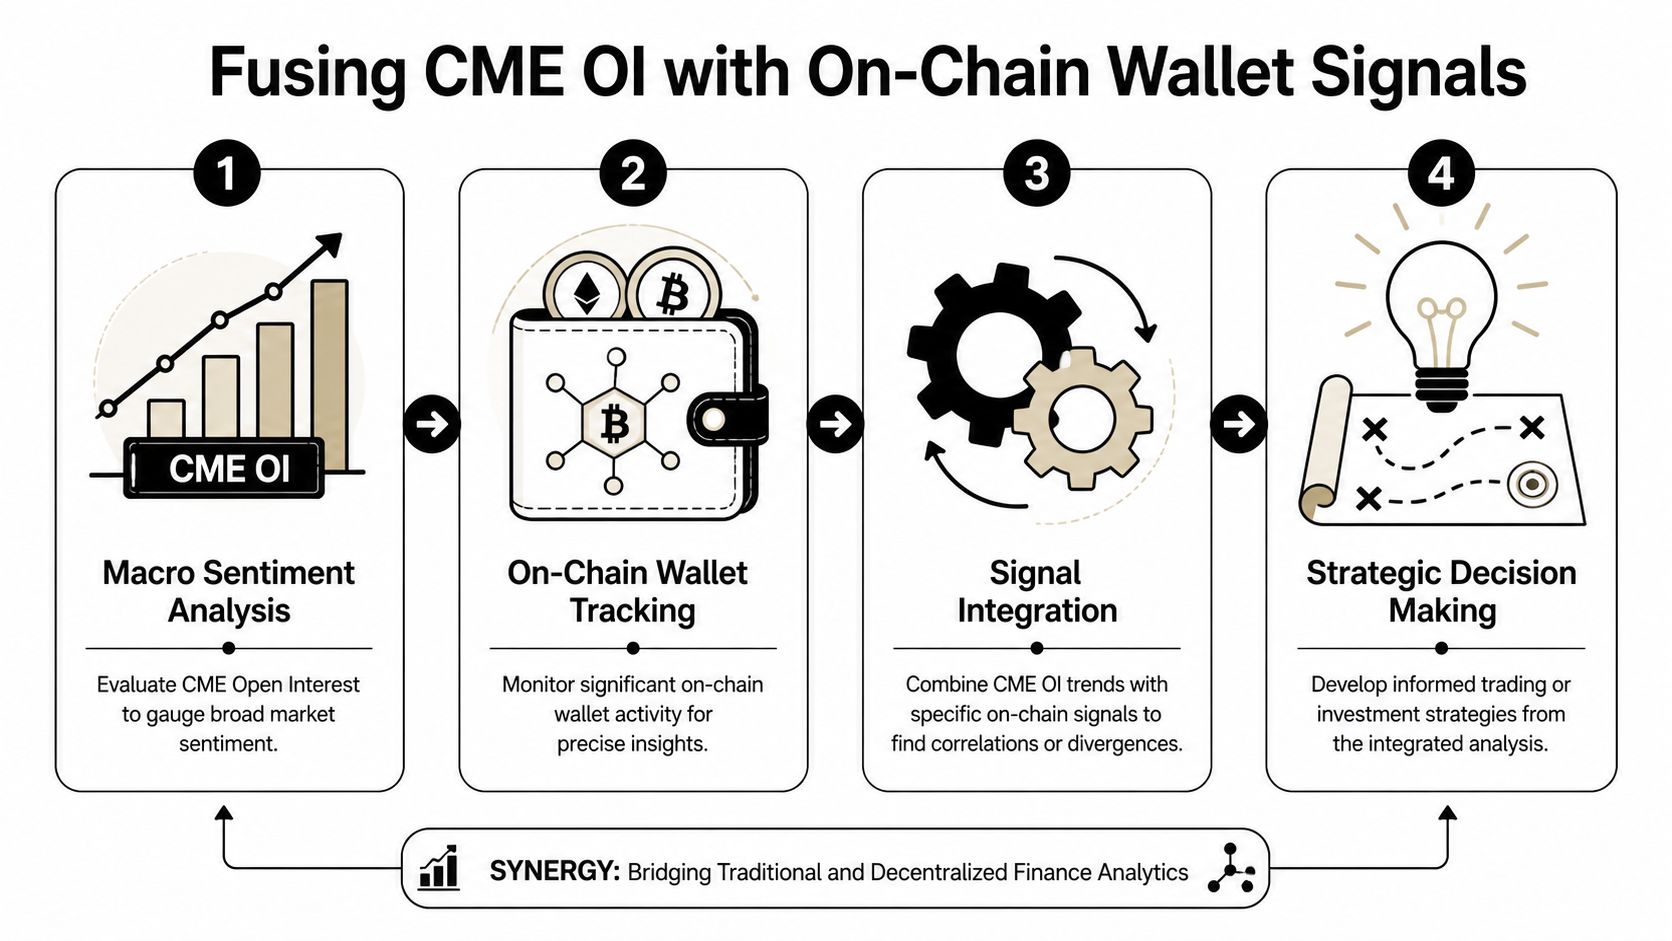
Here’s a short visual summary before going deeper.
The best signals come from agreement across venues, not from a single impressive wallet.
Bullish alignment
CME open interest rises with price holding structure, and tracked wallets are accumulating or withdrawing to long-term holding addresses. That combination suggests new participation and follow-through, not just noise.
Bearish alignment
CME positioning turns more defensive while wallets de-risk, rotate into majors, or move toward stablecoins. That does not guarantee downside, but it is a much better warning sign than either dataset on its own.
Divergence
CME activity leans cautious while wallets buy aggressively, or CME participation expands while on-chain conviction stays weak. In practice, this is often a wait signal. Let one side prove itself before committing size.
The job is to make TradFi positioning and on-chain behavior audit each other.
What works is using CME OI as a bias filter before mirroring smart money on-chain. It helps answer a simple question. Are you following wallet activity inside a supportive institutional regime, or are you chasing isolated flows against a cautious macro backdrop?
What fails is treating one wallet buy, one treasury transfer, or one whale rotation as proof of a broader thesis. Wallet data is specific but noisy. CME data is slower but broader. The edge comes from combining broad institutional intent with observable on-chain execution.
Amateur traders usually make the same errors with open interest cme. None of them come from lack of intelligence. They come from forcing a directional story onto a metric that needs context.
Open interest rising doesn’t mean bulls are winning. It means positions are being added. Those positions can be long, short, or hedged. You still need price action, structure, and options context.
Contract rolls and expiration-related behavior can distort OI. A drop in open interest around those periods may be mechanical rather than directional. Traders who don’t account for that often read routine position transfer as a sentiment event.
A large OI number in one contract doesn’t automatically matter more than a smaller one elsewhere. Product design, market maturity, and user base differ. The useful question is whether OI is changing materially relative to its own history and whether that change lines up with price.
This is the big one. OI works best when combined with:
Retail traders often want one metric that tells them what happens next. Open interest is better used as a filter than as an oracle.
The pro view is simple. OI is a context tool. Treat it that way and it improves decision quality. Treat it like a standalone trigger and it’ll produce false confidence.
| Question | Answer |
|---|---|
| Is open interest better than volume? | They do different jobs. Volume measures trading activity during the session. Open interest measures the stock of positions that remain open. For conviction and trend quality, OI is often more informative. |
| Can rising OI be bearish? | Yes. Rising OI just means traders are adding positions. If price is falling while OI rises, that can indicate new shorts or heavier downside hedging. |
| Why do crypto traders care about CME at all? | CME reflects participation in a regulated derivatives venue used by institutional players. That makes it a useful external sentiment check against crypto-native data. |
| Is options OI more useful than futures OI? | They answer different questions. Futures OI is cleaner for broad participation. Options OI is better for strike-specific positioning, hedging pressure, and expiration mapping. |
| What should I look at first each day? | Start with the direction of OI change, then check whether price moved in the same direction. After that, inspect strike and expiration concentration if options positioning is relevant. |
| What’s the biggest practical use for DeFi traders? | Use CME OI to filter wallet signals. If smart wallets and institutional positioning point the same way, conviction improves. If they diverge, patience usually beats prediction. |
Wallet Finder.ai helps traders turn raw wallet activity into something usable. You can find profitable wallets across chains, inspect full trading histories, monitor entries and exits, and set alerts when tracked wallets move. If you want to combine institutional context from CME with real-time on-chain execution signals, Wallet Finder.ai is built for that workflow.

A premier DeFi analytics platform empowering traders to discover and analyze profitable blockchain wallets, trades and tokens.

