
Recovery Factor Calculation for Smart Traders
Master the recovery factor calculation to measure a strategy's resilience. Learn the formula, see DeFi examples, and find top wallets with Wallet Finder.ai.

June 20, 2026


Wallet Finder
June 14, 2026
You're probably staring at a token chart, a spreadsheet, or a wallet export and asking a simple question that gets complicated fast: is this thing just riding crypto beta, or is there something idiosyncratic worth owning?
That question matters more in DeFi than in equities. In stocks, beta usually starts with a familiar benchmark and reasonably stable market structure. In crypto, correlations jump, liquidity disappears, benchmarks are debatable, and one token's return stream can mix market exposure, protocol-specific catalysts, incentives, and pure microstructure noise. If you calculate beta carelessly, you won't measure risk. You'll measure your own data errors.
A good beta calculation is still useful. It helps you separate market-driven moves from token-specific behavior, compare wallets and portfolios on a common risk axis, and avoid confusing a bull-market passenger with a differentiated strategy. The trick is to treat beta as a tool, not a permanent label.
Beta answers one practical question: when the crypto market moves, how does this asset usually move relative to it?
If a token behaves like a high-octane version of the market, it has high beta. If it tends to move less than the market, it has lower beta. If it trades on its own narrative for stretches, beta can look unstable, weak, or misleading depending on the window you choose.
New analysts often treat beta like a badge. High beta means aggressive. Low beta means defensive. That's too simplistic.
A memecoin can print a high beta because it amplifies broad risk-on moves. That doesn't make it strong. It just means it tends to swing harder when the market swings. A large Layer 1 token can show lower beta in some windows because liquidity is deeper and flows are broader. That doesn't make it safer in every relevant sense either. It may still gap on governance, regulatory, bridge, or token release headlines.
Practical rule: Beta measures systematic risk, which is the part of risk tied to the market you can't diversify away by holding more names in the same regime.
That's why beta matters for portfolio construction. If you're long ten tokens that all key off the same market tape, you may think you're diversified when you're just stacking the same factor.
Traders often err when assessing performance. If a wallet outperforms during a strong market, that return may come from simple market exposure, not skill. Beta explains the tide. Alpha is what's left after accounting for the tide.
A trader who buys high-beta assets early in a market rally can look brilliant. Sometimes they are. Sometimes they just loaded on market sensitivity before the move. Beta calculation helps you separate those cases.
A clean way to think about it:
| Term | What it captures | What it misses |
|---|---|---|
| Beta | Sensitivity to a chosen market benchmark | Token-specific catalysts, execution quality, narrative timing |
| Alpha | Return not explained by benchmark exposure | Can still be distorted by bad benchmark choice |
| Volatility | How much an asset moves overall | Whether it moves with the market |
If you already track realized swings, this guide to crypto volatility measurement is a useful complement because volatility and beta answer different questions.
Beta won't tell you whether a token is fundamentally sound. It won't tell you whether a market maker is supporting the book. It won't tell you whether a yield token's return stream is driven by emissions rather than price discovery. It also won't tell you whether the relationship you measured last month will hold next month.
That last point matters most in crypto. Beta is descriptive before it's predictive.
Most bad beta work fails before the math starts. The benchmark is wrong, the return interval is inconsistent, or the asset data includes stale prints and exchange-specific distortions.
Your benchmark defines what “market” means. In crypto, there isn't one universal answer.
If you're analyzing a broad alt, BTC can work as a rough market proxy because many assets still react to Bitcoin-led risk shifts. If you're evaluating a DeFi token on Ethereum, ETH may be more informative because ecosystem flows often matter more than Bitcoin headlines. If you manage a niche basket, a custom index can be better than either.
Use this decision frame:
The benchmark isn't a technical footnote. It drives the interpretation.
A short-window beta can be useful for active trading, but it can also be noisy. A longer-window beta smooths noise, but it may blend together multiple market regimes and hide changes that matter now.
NYU Stern's discussion of beta estimation highlights a point many crypto analysts learn the hard way: historical beta depends on how you estimate it, and regression-based measures can be less dependable than bottom-up approaches in unstable settings. It also notes that beta is commonly estimated by regressing asset returns on a stock index, while also recommending a bottom-up approach in some contexts and distinguishing between raw historical, unlevered, and bottom-up beta frameworks in practice. That matters because the “right” beta depends on use case, and financial gearing changes the equity risk profile (NYU Stern beta paper).
For crypto, that translates into a practical warning. A token's beta from one lookback window may not survive contact with a new regime.
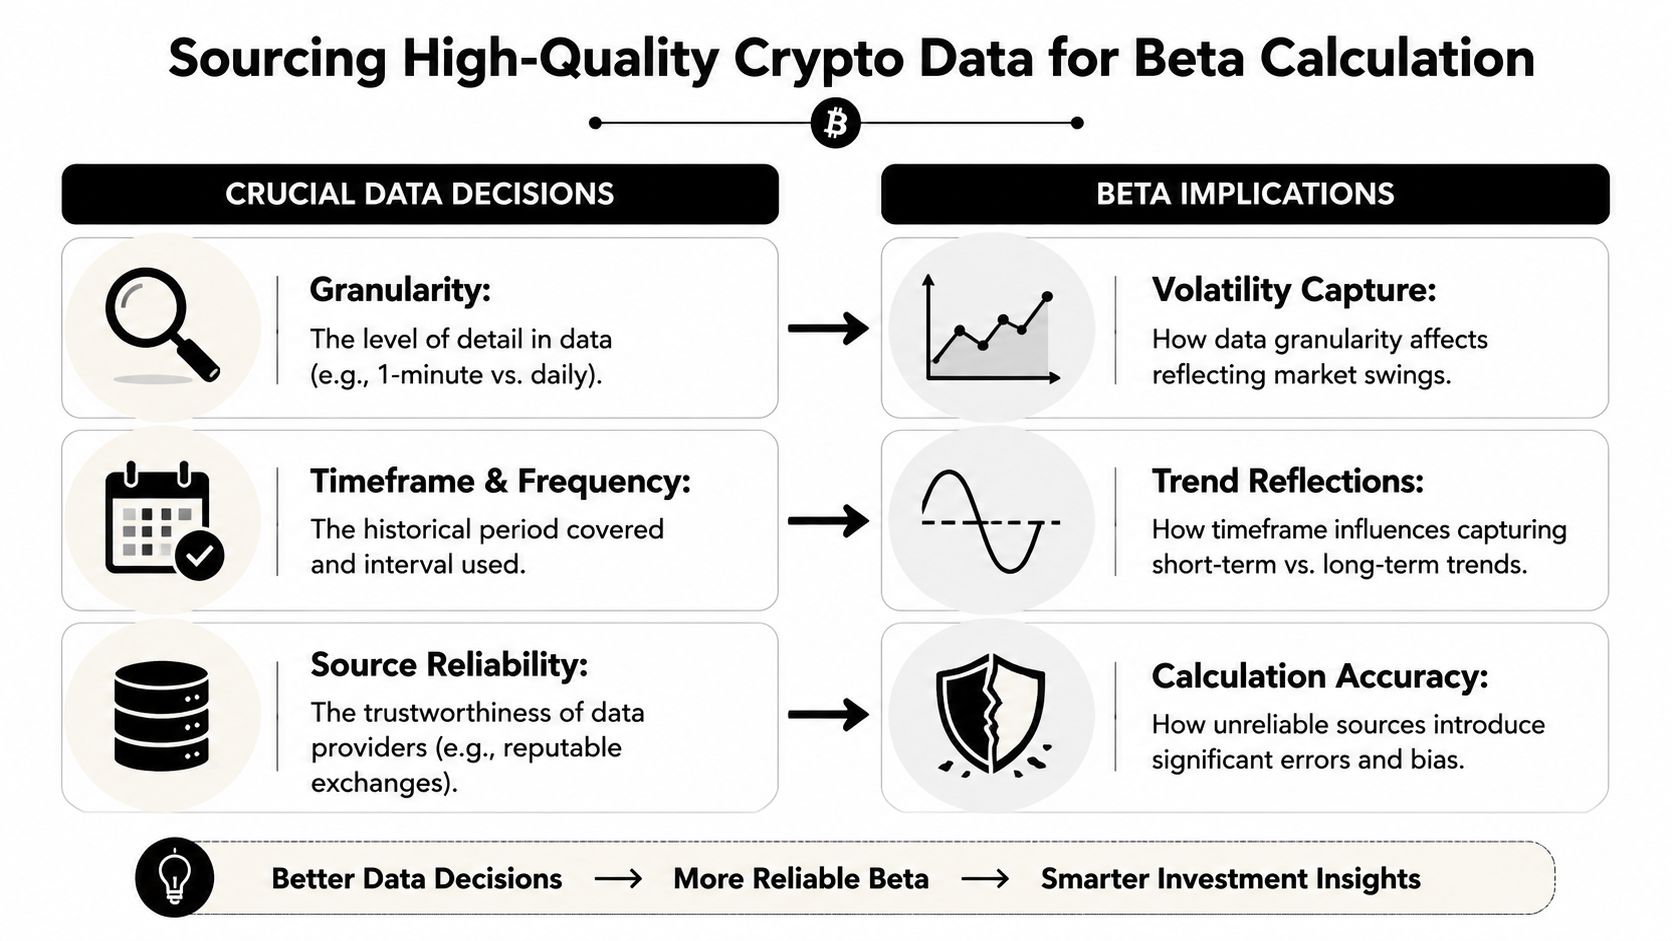
Don't mix venues carelessly. A thin token can show very different prints across exchanges. If one venue has poor liquidity or delayed updates, your returns series may include jumps that say more about market plumbing than market risk.
A workable checklist:
| Decision | Fast workflow | Safer workflow |
|---|---|---|
| Benchmark | BTC or ETH | Token-specific benchmark chosen by thesis |
| Time horizon | Recent window for tactical trading | Multiple windows to compare stability |
| Frequency | Daily returns | Daily plus a higher-frequency check for microstructure effects |
| Source | Single API pull | Cross-check venue consistency and missing values |
If the beta changes dramatically when you switch benchmark, frequency, or window, that isn't a nuisance. It's information.
Once the data is aligned, beta calculation is straightforward. The hard part is interpreting the output objectively.
There are two standard approaches. The first uses covariance and variance. The second uses linear regression. In clean datasets, they should point to the same beta estimate.
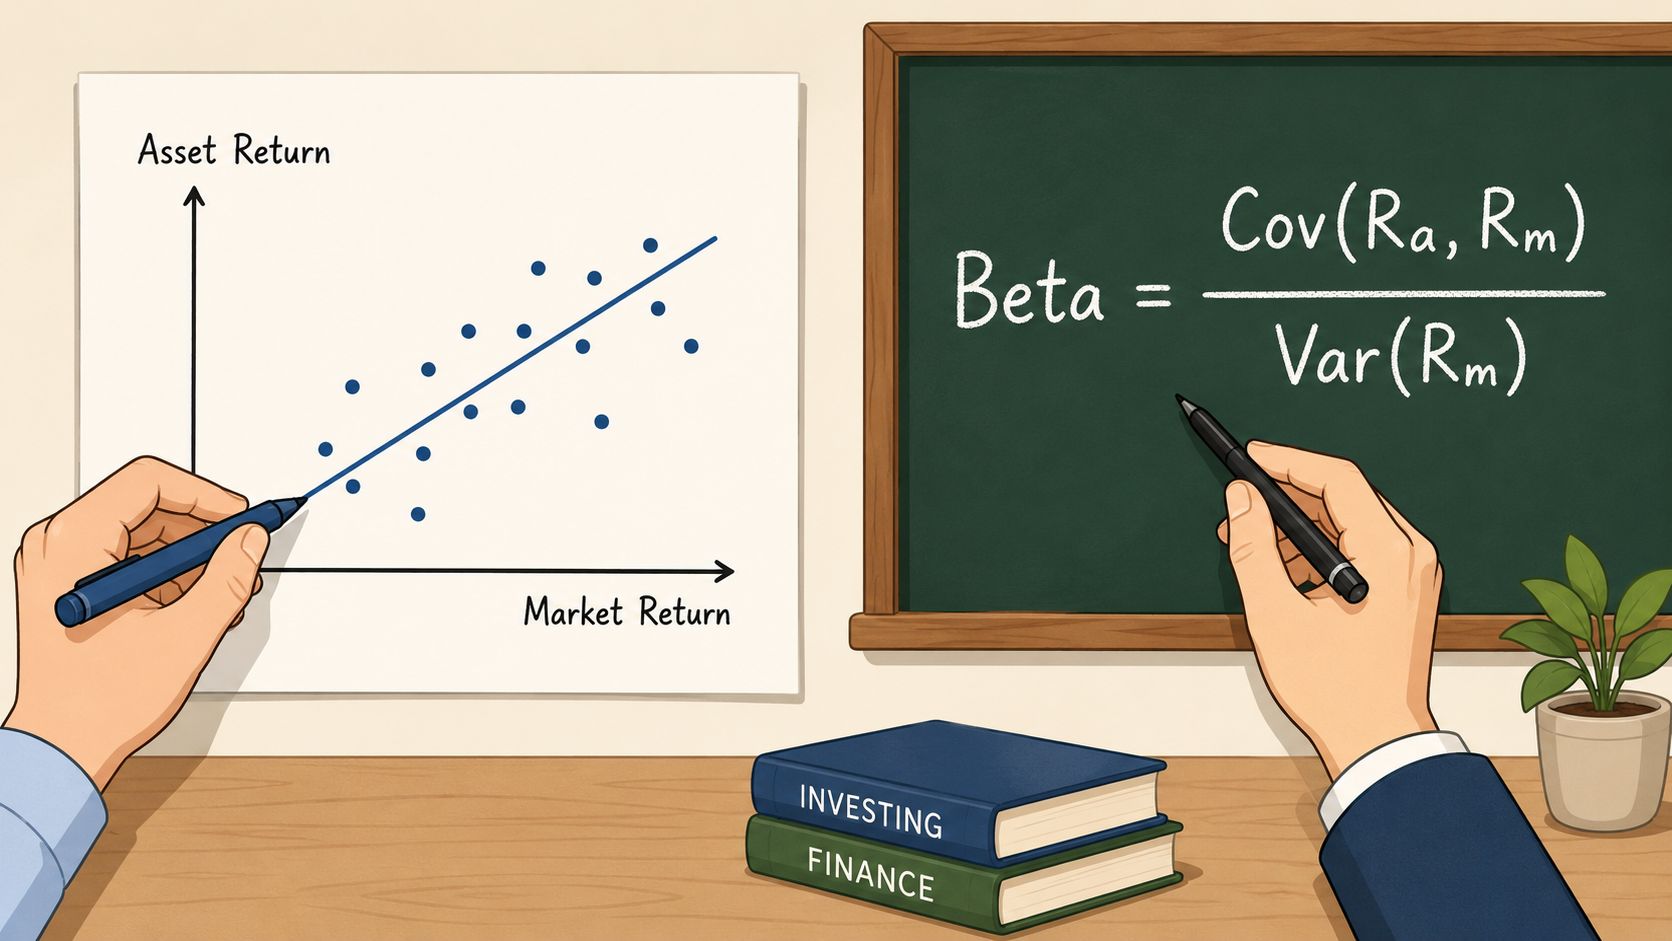
The formula is:
Beta = Covariance(asset returns, benchmark returns) / Variance(benchmark returns)
Think of covariance as asking whether the asset and market move together. Variance asks how much the market itself moves. Dividing one by the other gives you the asset's sensitivity to the market.
Use this workflow:
That's the classic beta calculation.
Regression gets you to the same destination in a way that's often easier to diagnose visually.
Set up the regression as:
Asset return = intercept + beta × benchmark return + error
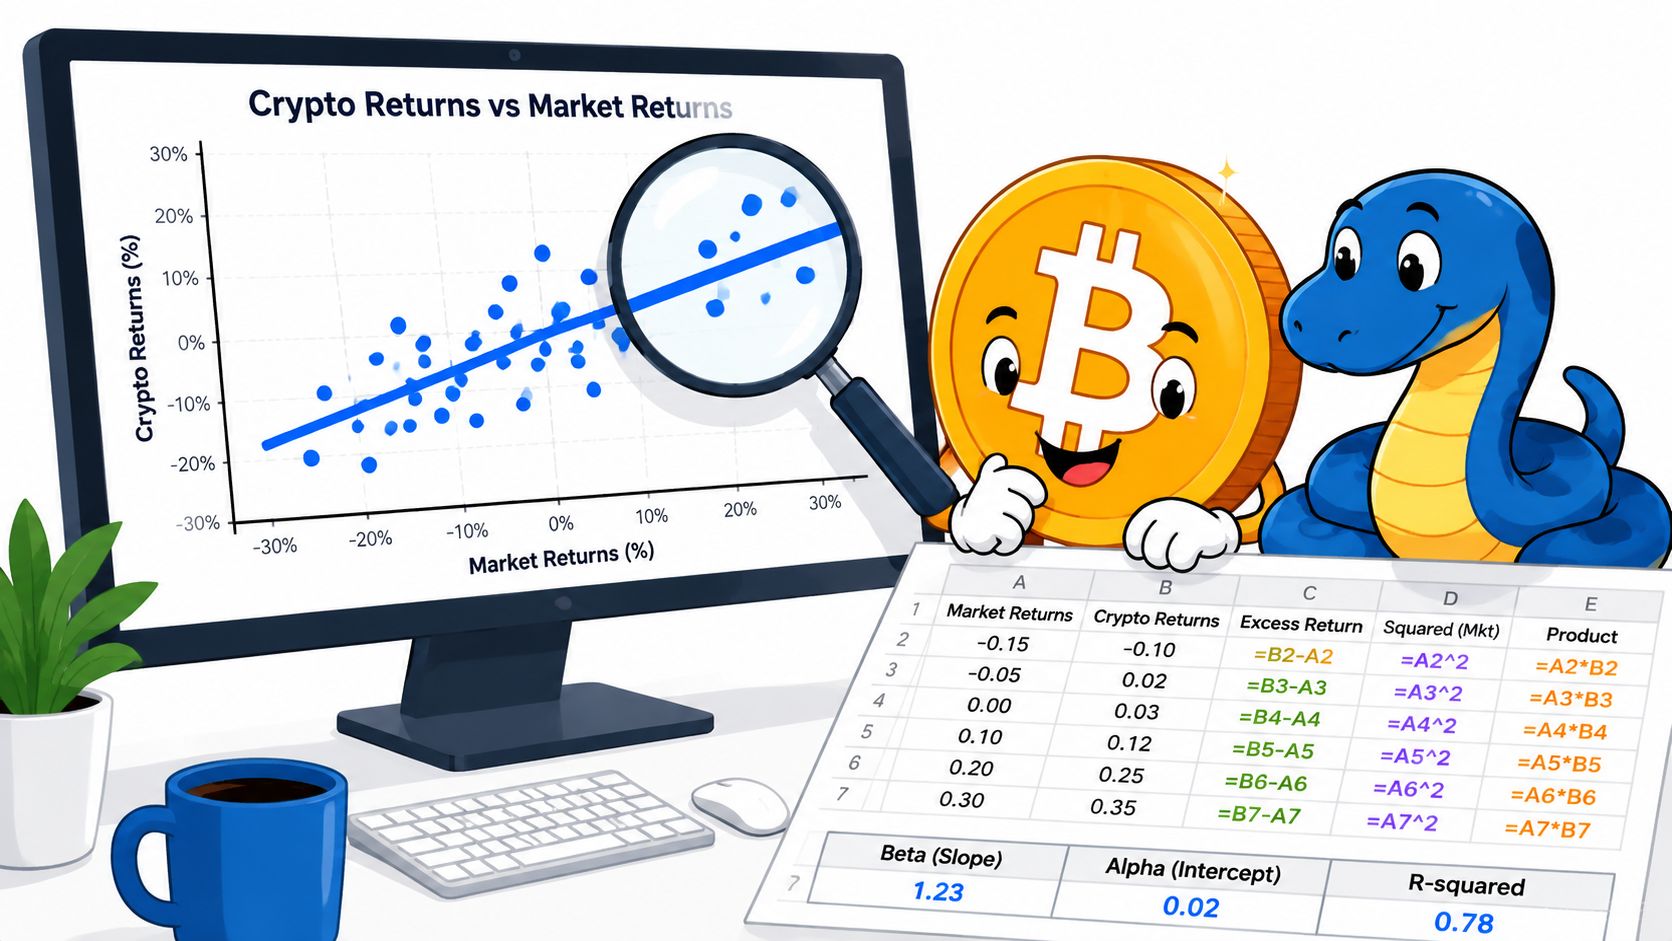
Plot benchmark returns on the x-axis and asset returns on the y-axis. The slope of the line of best fit is beta. The intercept is often used as a rough alpha proxy, though in crypto you should be cautious about over-reading it without a strong benchmark and stable sample.
Regression has a practical advantage. You can inspect the scatter. If the points are all over the place, your beta estimate may be weak even if the software gives you a precise-looking number.
Suppose you have a handful of daily returns for a DeFi token and ETH. You calculate both methods and get roughly the same slope. That consistency is what you want to see. If covariance-based beta and regression-based beta diverge materially, inspect your data handling first.
A worked statistical example outside crypto shows how rejection thresholds and true effect size shape beta in hypothesis testing, not market beta. In that example, a null mean of 300, actual mean of 310, sample size 40, and standard error 5.657 produced β = 0.3134, implying power of about 68.66% (worked beta example). That's a different use of the term beta, but it's a useful reminder that notation can collide across fields. In trading, be explicit that you mean market beta, not Type II error beta.
| Method | Best use | Limitation |
|---|---|---|
| Covariance / variance | Fast spreadsheet work and sanity checks | Harder to inspect relationship quality |
| Regression | Production workflow and diagnostics | Still vulnerable to bad benchmark choice and unstable samples |
A beta estimate with weak economic intuition is less useful than a rough estimate built on the right benchmark and cleaner data.
If you can export price history into rows with timestamps, you can calculate beta in a few minutes. The software isn't the bottleneck. Data discipline is.

Set up your sheet with:
If prices start on row 2, put returns from row 3 onward.
Example formulas:
(B3/B2)-1(C3/C2)-1Fill down both columns. Then calculate beta with either method.
Covariance / variance version
=COVARIANCE.S(D3:Dn,E3:En)/VAR.S(E3:En)Regression slope version
=SLOPE(D3:Dn,E3:En)If both formulas are working on the same aligned returns, the outputs should be very close.
A useful habit is to create one extra column for a scatter chart. Plot benchmark returns against asset returns and visually inspect the relationship before trusting the number.
Python is better once you need rolling windows, multiple benchmarks, or a batch process across many tokens.
Use this structure:
Sample script:
import pandas as pdimport statsmodels.api as sm# Load CSV with columns:# date, asset_price, benchmark_pricedf = pd.read_csv("prices.csv", parse_dates=["date"])df = df.sort_values("date").copy()# Calculate returnsdf["asset_ret"] = df["asset_price"].pct_change()df["bench_ret"] = df["benchmark_price"].pct_change()# Keep aligned observationsdf = df.dropna(subset=["asset_ret", "bench_ret"]).copy()# Covariance / variance betacov_beta = df["asset_ret"].cov(df["bench_ret"]) / df["bench_ret"].var()# Regression betaX = sm.add_constant(df["bench_ret"])model = sm.OLS(df["asset_ret"], X).fit()print("Covariance beta:", cov_beta)print("Regression beta:", model.params["bench_ret"])print("Intercept:", model.params["const"])print(model.summary())This gives you the slope from the regression, plus additional diagnostics. Those diagnostics matter because a headline beta without relationship quality can fool you.
For analysts who move data through spreadsheets before coding, this guide on importing JSON into Google Sheets is handy for getting API data into a workable format before you clean and export it.
A quick visual explainer helps if you're training a junior analyst or documenting your workflow:
| Tool | Best for | Not ideal for |
|---|---|---|
| Excel | Fast one-off beta calculation, manual review | Large universes, rolling analytics, reproducibility |
| Python | Batch analysis, rolling beta, regression diagnostics | Analysts who need quick ad hoc checks without setup |
If you only run one token against one benchmark, Excel is enough. If you monitor baskets, wallets, or multiple chains, move to Python early.
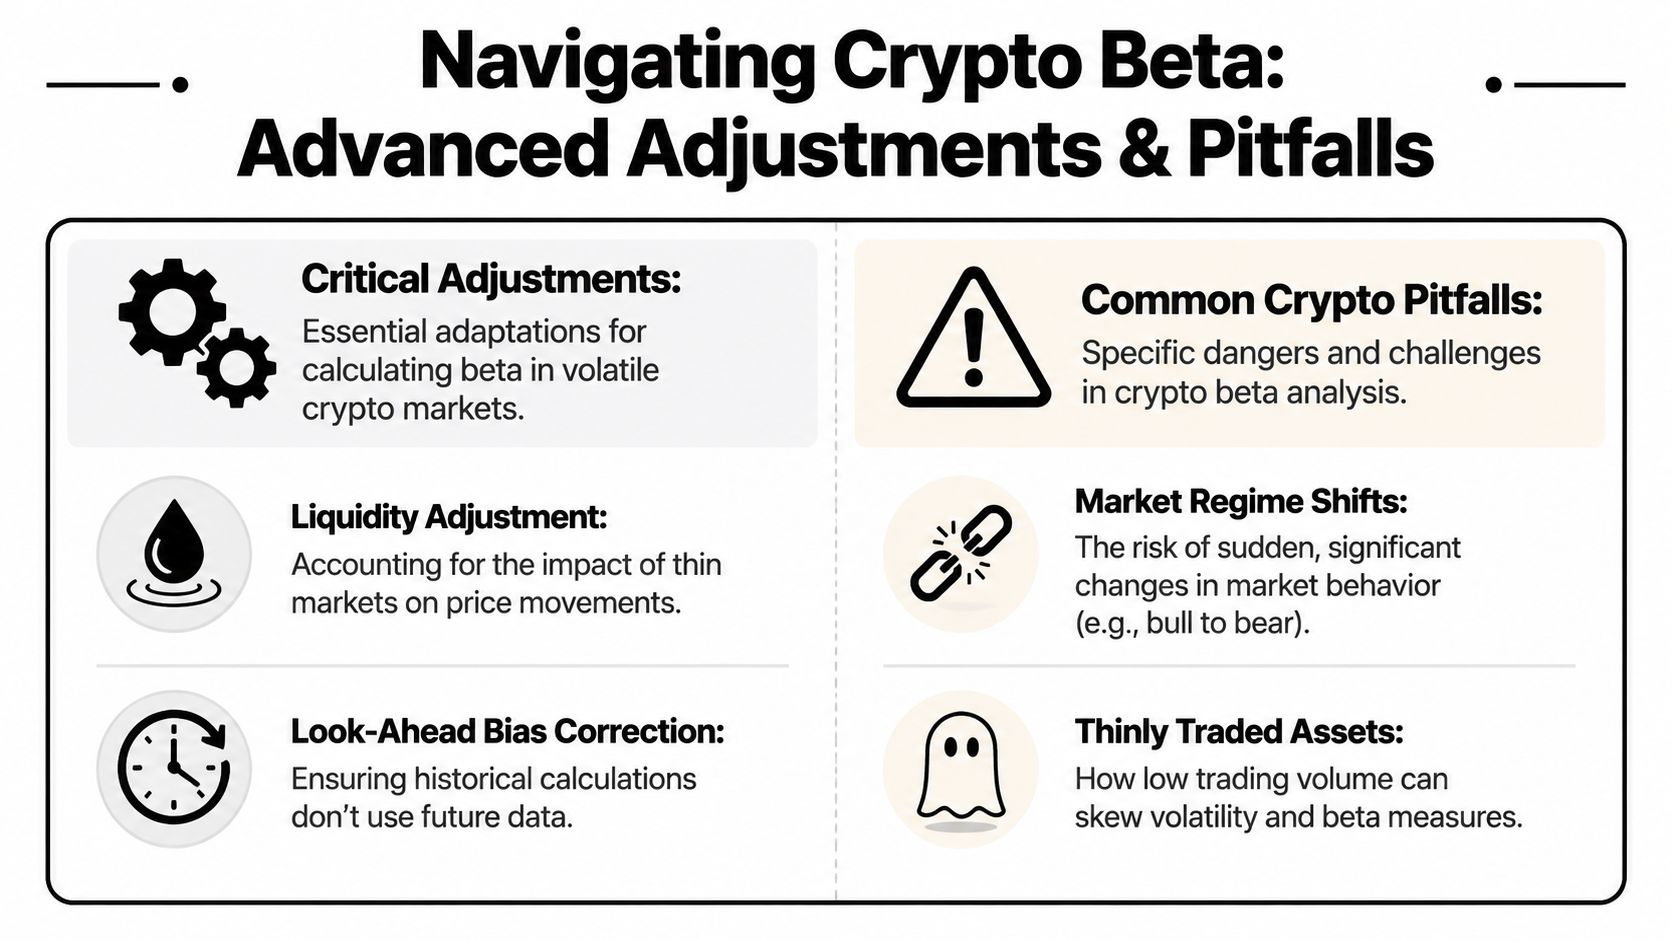
The biggest mistake in crypto beta work is treating beta like a fixed trait. It isn't.
A token can behave like a market amplifier during one regime, then detach completely when liquidity dries up, emissions change, or a catalyst dominates flows. Standard tutorials often skip this instability. That omission is costly in crypto.
A backward-looking beta can break when the market regime changes. Guidance on beta estimation often underplays how unstable estimates can become over short windows and in fast-moving markets, and how the result can shift when you change the return window, sampling frequency, or benchmark index. It also distinguishes regression-based beta from bottom-up estimates and suggests comparable-based approaches can be more reliable than a single historical sample in unstable settings (video discussion of beta instability).
In practice, that means you should often calculate rolling beta instead of relying on one static number. Roll the window through time and watch whether the relationship is stable, drifting, or snapping between regimes.
Don't ask, “What is this token's beta?” Ask, “What beta did this token show against this benchmark over this window, under these trading conditions?”
Even though crypto tokens aren't corporate equities in the standard sense, the conceptual distinction still helps.
For DeFi, the analogy is useful when protocol design or treasury structure changes the effective risk profile. If a token's economics are being reshaped by amplifying mechanisms, incentives, or structural changes, a simple historical beta may miss the actual exposure.
| Situation | What to do |
|---|---|
| Stable liquid major token | Historical regression beta is often a reasonable first pass |
| Thin alt with sporadic trading | Inspect liquidity and use multiple windows before trusting beta |
| Token after major tokenomics change | Treat old beta as stale |
| Sector basket or protocol family | Consider a custom or bottom-up style benchmark approach |
Beta becomes useful when it changes a trading decision.
If a wallet's gains mostly came from high-beta exposure during a favorable tape, you shouldn't mistake that for repeatable edge. Compare the wallet's realized return stream against a relevant benchmark and ask whether performance persists after accounting for market sensitivity.
A wallet that loads into high-beta names near market upswings may still be worth following. But you'd size it differently than a wallet that repeatedly generates returns from token selection, timing, or asymmetric entries.
For a new token, beta helps answer a narrow but important question: if the market wobbles, is this likely to wobble harder?
That doesn't replace fundamental work. It complements it. High beta into weak liquidity can turn a decent thesis into a bad entry if your holding period is short.
Portfolio beta is more useful than single-name beta for many traders. If your basket's exposure is heavily tied to one benchmark, you can hedge around the edges, rotate into lower-sensitivity names, or stop pretending your “diversified” portfolio is anything more than levered market exposure.
For on-chain researchers, unstable beta estimates over short windows are a feature, not a bug. They tell you that relationships are changing. Standard tutorials often miss that beta can change sharply with benchmark choice, sampling frequency, and market regime. In volatile crypto assets, comparable-based or broader contextual approaches can sometimes be more reliable than trusting one historical sample, as noted in the earlier discussion of estimation instability.
That matters when you analyze whale wallets, sector rotations, or protocol cohorts. If the beta is drifting, the strategy may be drifting too.
Wallet Finder.ai helps you turn this kind of analysis into something tradable. You can track wallets, inspect complete trade histories, export datasets for your own beta calculation workflow, and monitor smart-money behavior across major chains. If you want cleaner inputs for wallet-level risk analysis and copy-trading research, start with Wallet Finder.ai.

A premier DeFi analytics platform empowering traders to discover and analyze profitable blockchain wallets, trades and tokens.

