Price Realization Definition: Prevent Profit Leakage
Get the precise price realization definition. Learn its formula, how it differs from realized price, and on-chain methods to stop profit leakage.

May 30, 2026
Wallet Finder

May 30, 2026

You're probably looking at a wallet, exchange account, or trade log that says you're up on one token and down on another, but it still isn't clear what you made. That confusion is normal. Crypto trading produces a lot of noisy numbers, and most of them don't answer the question.
A useful Crypto PnL calculator does one thing well. It turns trades into a consistent view of profit, loss, and return after the costs that matter. If you understand the math first, you can build a clean manual tracker. Once that starts to feel tedious, automation stops being a luxury and becomes part of disciplined trading.
PnL means profit and loss. In trading terms, it's the result of your position after comparing what you paid, what you sold for, and what the trade cost you along the way.
The basic formula behind most tools is Net P&L = (Exit Price − Entry Price) × Quantity − Fees, and ROI is net P&L divided by the invested amount, as outlined in this crypto PnL formula reference. That matters because a calculator that ignores fees can materially overstate returns.
The first split you need to understand is realized versus unrealized PnL.
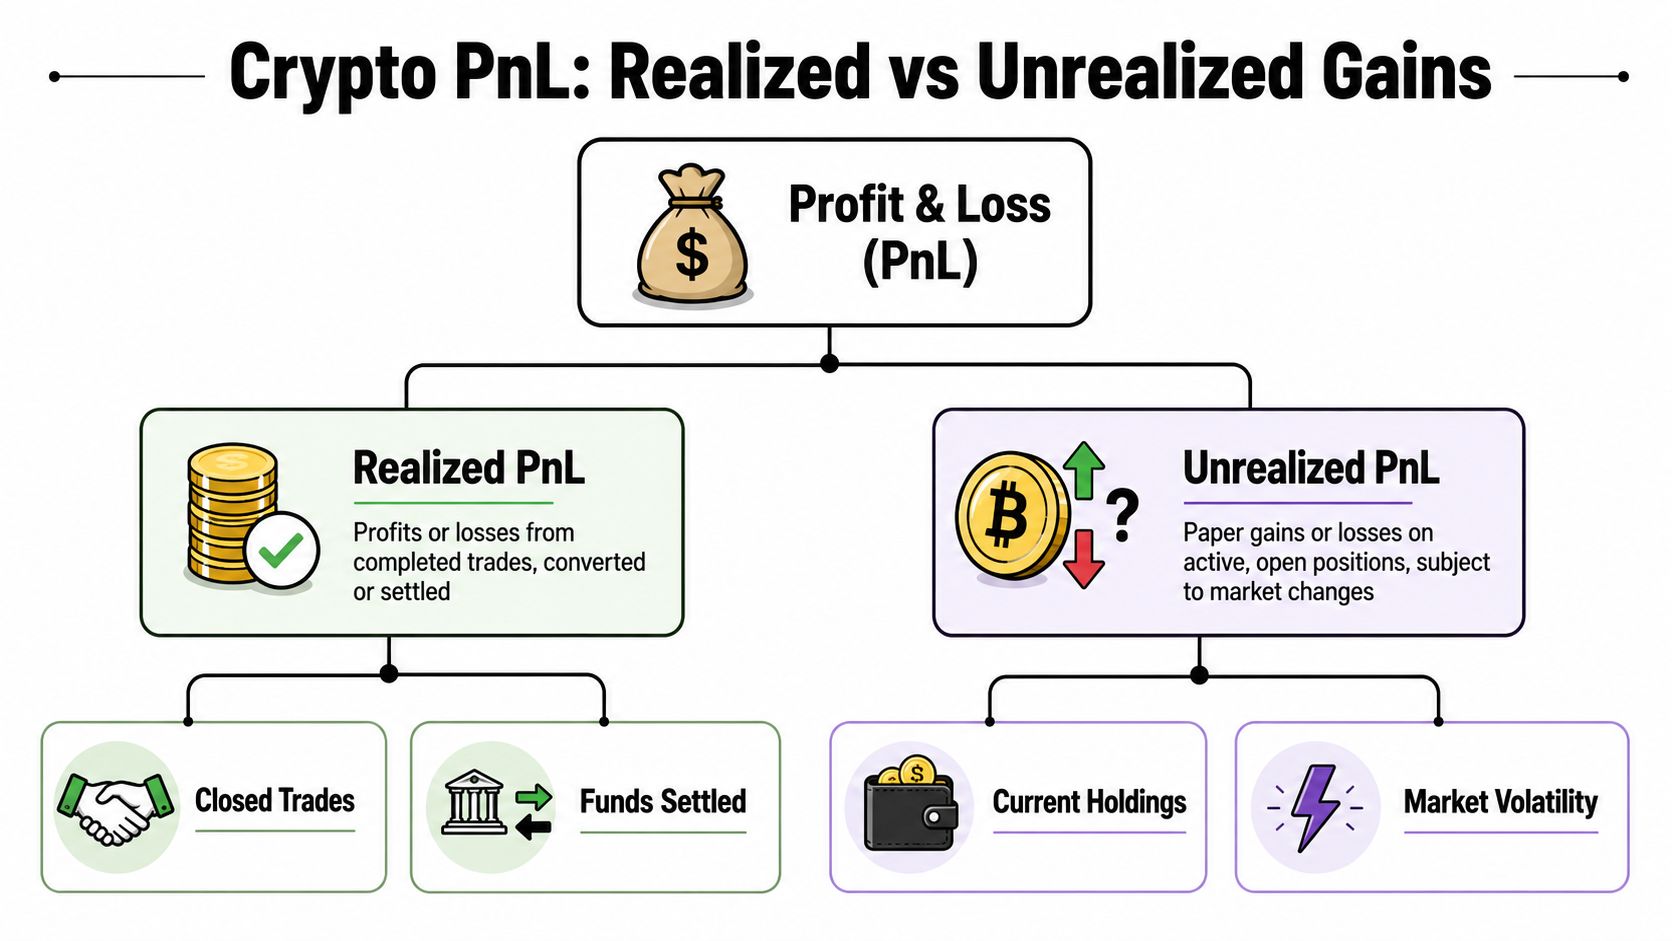
Realized PnL is the profit or loss from a trade you've already closed. You bought, you sold, and the result is locked in.
A simple example helps. Suppose you buy one coin, then later sell that same coin. Once the sale completes, the trade has a final result. If you paid fees on entry and exit, they reduce the number that lands in your account.
That's why serious traders track net PnL, not just price movement. Gross profit might look fine on a chart. Net profit tells you what the trade was worth.
Practical rule: If the trade is closed, stop calling it potential profit. It's realized PnL, and it belongs in your records exactly as it happened.
Unrealized PnL is your open-position profit or loss. It's what the position would show if you exited at the current market price, but you haven't sold yet.
Say you bought a token and still hold it in your wallet. If the current market price is above your entry, your unrealized PnL is positive. If price drops below your entry, it's negative. Either way, the number can change with the next candle.
Many traders confuse account value with actual performance. Open profits feel good, but they aren't settled. A volatile market can erase them quickly.
If you mix realized and unrealized PnL in one bucket, you'll misread your own trading. Closed trades measure execution quality. Open trades measure current exposure.
That distinction becomes even more important when you compare wallets, copy trades, or evaluate whether a strategy works across different tokens. You need a clean basis for comparison, not a mashup of locked-in gains and floating paper profits.
Use this mental model:
If you want a cleaner walkthrough of trade math before building your own tracker, this guide on how to calculate crypto profits is a good companion read.
The simple formula works well when you buy once and sell once. Things get more complicated when you accumulate the same asset at different prices, then sell only part of the position.
That's where cost basis comes in. Cost basis is the acquisition value assigned to the units you sold. If you bought the same token multiple times, the method you choose changes your realized gain or loss.
Take a simple scenario. You buy ETH once at $2,000. Later, you buy ETH again at $3,000. Then you sell 1 ETH at $2,500.
The sale price is fixed, but the trade result depends on which purchase lot you treat as the one sold first.
| Cost Basis Method Comparison (Sell 1 ETH at $2,500) | |||
|---|---|---|---|
| Method | Cost Basis of ETH Sold | Realized Gain/Loss | Tax Implication |
| FIFO | $2,000 | Gain of $500 before fees | Can show higher taxable gain when earlier buys were cheaper |
| LIFO | $3,000 | Loss of $500 before fees | Can reduce taxable gain or create a loss if recent buys were higher |
| HIFO | $3,000 | Loss of $500 before fees | Often minimizes gains when the highest-cost lot is available |
FIFO means first in, first out. It assumes the earliest purchased unit is the one you sold.
LIFO means last in, first out. It assumes the most recently acquired unit is sold first.
HIFO means highest in, first out. It assigns the highest-cost unit first, which can reduce gains when your records support that treatment.
Your PnL can be directionally correct while your tax reporting is wrong. Cost basis is often where that mismatch starts.
For active traders, the best method is usually the one you can apply consistently and document cleanly. The wrong approach is switching methods mentally from trade to trade because one version “looks better.”
A practical workflow looks like this:
For traders who regularly scale in and out, average-price thinking can hide a lot of errors. If you want a simpler way to understand blended entry logic before applying formal lot accounting, this explainer on a crypto average calculator is useful.
Most spreadsheet errors happen in one of three places:
If you only buy and fully sell in one move, cost basis is easy. If you ladder entries, rotate between tokens, or trim positions in pieces, your method choice becomes part of your actual trading infrastructure.
A spreadsheet is still the best way to learn how PnL tracking works. It forces you to define each trade, record costs properly, and confront the difference between a neat chart and a messy execution log.
For most traders, Google Sheets or Excel is enough to build a solid manual Crypto PnL calculator.
![]()
Start with one sheet for raw transactions. Don't overdesign it. You need structure more than polish.
Use columns like these:
If you trade across multiple wallets, this last field matters a lot. Without it, internal transfers can look like phantom buys or sells.
Keep raw data separate from calculations. One tab should hold transaction history exactly as imported or entered. Another can calculate lot matching, realized PnL, running totals, and current holdings.
A beginner-friendly setup is:
| Tab | Purpose |
|---|---|
| Transactions | All buys, sells, swaps, fees, and transfers |
| Open Lots | Remaining unsold units by asset |
| Realized PnL | Closed-trade results after fees |
| Holdings Summary | Current quantity, blended cost, and market value |
This separation prevents one bad formula from contaminating everything else.
A spreadsheet is useful only if you can audit it. If you can't trace a result back to a line item, the number isn't trustworthy.
At the trade level, the realized result still comes back to the same logic: proceeds minus cost basis minus fees. For a simple one-lot sale, you can express it as exit value less entry value less costs.
If you're selling from a single matched lot, your logic is straightforward:
That works well for simple spot trading. Once you start matching across multiple lots, the formula itself stays simple, but the lot assignment becomes the hard part.
The bigger limitation is that most manual trackers stop at trade math. They don't answer risk questions. That gap matters because professional position sizing depends on account balance, stop-loss distance, and risk percentage, not just expected return, as discussed in this crypto leverage calculator overview.
A running total gives you a quick read on how your closed trading is performing over time. In a dedicated realized PnL tab, add one column for the result of each closed trade and another that cumulatively sums prior rows.
That view is useful for spotting patterns:
This walkthrough is worth watching if you want a visual process for spreadsheet setup and trade logging:
Manual tracking works best when your activity is simple. It starts to strain when you:
That's the point where spreadsheets stop being a learning tool and start becoming an operational burden.
The basic formula is necessary, but it isn't sufficient for serious trading. Your true result often diverges from the neat output shown by a simple calculator because execution in crypto is rarely clean.
The major shift in modern PnL tools was moving beyond simple buy-sell math to include fees, magnified trading exposure, slippage, funding rates, and tax-aware exit planning. Some tools also support unlimited exit targets, and 10x capital amplification is commonly used as a simple example of how trading exposure amplifies outcomes, as described in this crypto calculator overview.
Many traders think about “fees” as a single exchange charge. In practice, you may have several cost layers on one idea.
A spot trade can include:
These costs don't always show up in the same place. Some are visible in exchange history. Others sit in wallet activity. If your calculator only captures one of them, the PnL will look cleaner than reality.
Slippage is the gap between the quoted price and your actual fill. On liquid majors, that gap may feel small. On fast-moving or thinly traded tokens, it can reshape the entire entry.
That matters because your PnL starts from the actual execution price, not the chart price you remember. Traders often record the intended entry, then later wonder why the result doesn't line up.
The market doesn't settle your trade based on your planned fill. It settles on what actually executed.
Amplified trading magnifies gains and losses, but the operational headache is broader than that. A position with amplified exposure introduces margin behavior, liquidation risk, and recurring costs tied to how long the trade stays open.
For perpetual futures, funding rates can shift the net result over time. A trade that looks profitable on price movement alone can degrade if funding works against the position long enough. That's one reason traders who hold perps need more than a simple entry-exit calculator.
A reliable process should track at least these layers:
| Factor | Why it changes true PnL |
|---|---|
| Fill price | Determines your actual entry and exit |
| Fees | Reduce net gains or deepen losses |
| Funding | Adds recurring cost or credit on perps |
| Leverage | Amplifies both price impact and liquidation sensitivity |
| Multi-target exits | Creates blended average exits instead of one clean sale |
Crypto-to-crypto swaps are where many casual trackers fall apart. If you swap one asset for another, you usually need to treat that as disposing of the first asset and acquiring the second at its new basis.
That means one transaction can create:
The more active your trading, the less useful a one-screen calculator becomes. At that point, PnL isn't just a trade result. It becomes a record of execution quality, cost control, and accounting discipline.
Manual tracking teaches good habits. It also has a ceiling. Once you trade across wallets, chains, and protocols, the hard part isn't the formula. The hard part is collecting reliable history, classifying it correctly, and validating the result.
That's where an automated Crypto PnL calculator becomes the practical next step.
A good automated workflow removes repetitive data entry and reduces the small mistakes that subtly ruin performance tracking. Those mistakes are familiar to anyone who has tried to maintain a spreadsheet for more than a few weeks.
Typical failure points include:
Automation doesn't change the math. It improves the integrity of the input.

A one-off calculator is fine if you want to test one trade idea. Serious wallet analysis needs a broader record.
For on-chain traders, the useful questions are usually:
Those are pattern questions. You don't answer them with one formula box. You answer them with structured history, tagged behavior, and repeatable performance views.
Among tools built for on-chain analysis, Wallet Finder.ai tracks wallet activity across major ecosystems and surfaces trading history, PnL, entry and exit timing, position sizing, and related wallet-level behavior. That matters if you're evaluating your own wallets or studying other traders before mirroring them.
The practical difference is that you're no longer limited to “Did this trade make money?” You can inspect the context around the result:
If you're comparing options for software in this category, this guide on a crypto profit loss app gives a useful framework for what to check.
Traders often focus on convenience first. Accuracy should come first. An automated tool is only valuable if you can still sanity-check what it produces.
A good validation process looks like this:
This is especially important if you use multiple venues or rotate capital quickly between chains. Automation saves time, but validation preserves trust.
Clean PnL tracking isn't about prettier dashboards. It's about making better decisions from numbers you're willing to rely on.
Most traders move through three stages.
At first, they estimate profit in their head. That works until the trade count rises.
Then they build a spreadsheet. This is the right middle step because it teaches how cost basis, fees, and realized results work.
Finally, they automate. That becomes necessary when wallet activity gets too dense to maintain manually without introducing errors.
That progression is healthy. If you skip the fundamentals, automated output can feel like magic and you won't know when it's wrong. If you stay manual for too long, tracking itself starts stealing time from research, execution, and review.
A strong PnL process should help you answer three things quickly:
| Question | What a good system should show |
|---|---|
| Did I make money? | Realized and unrealized PnL separated clearly |
| Why did the result look like that? | Fees, fills, sizing, and exit behavior |
| Can I trust the number? | Traceable underlying transactions and auditability |
For active DeFi traders, copy traders, and on-chain researchers, that last point is often the deciding one.
If you want a faster way to analyze wallet history, validate realized results, and study trading behavior without maintaining a fragile spreadsheet, Wallet Finder.ai is worth exploring. It's built for tracking on-chain wallets, reviewing PnL in context, and turning raw transaction history into something you can use.